- Data and data representation (lecture 1)

Содержание
- 2. Module Aims: To foster in students confidence to cope with the processing and analyzing of quantitative
- 3. Learning outcomes: apply numerical skills to business and/or engineering problems present statistical data in a variety
- 4. In brief, you will learn how ...: To appreciate benefit of numerical data for businesses To
- 5. Teaching methods: 1-hour online lecture each week (online) 2-hour tutorial each week (offline) 1-hour workshop each
- 6. Assessment methods: Two assessments (or components): In-class test (30%+10%). 30% goes to an in-class test in
- 7. LECTURE 1 DATA & DATA REPRESENTATION Temur Makhkamov Indira Khadjieva QM Module Leaders tmakhkamov@wiut.uz i.khadjieva@wiut.uz Office
- 8. Lecture outline DATA the meaning and types of data sources of data the scales of measurements
- 9. What is data? (1) Data – the facts and figures that are collected, analyzed and summarized.
- 10. What is data? (2) Data may be obtained through already existing-sources or through statistical studies. 1.
- 11. Primary and Secondary data Primary data – the data that are obtained as a result of
- 12. Questions: What data is more costly (expensive): primary or secondary? What data is more reliable (trustworthy):
- 13. Statistical data Q: What are the components of the statistical table?
- 14. Components of the tabular data Element – the entity or item on which data are collected.
- 15. Main types of data Qualitative data provide labels or names for variables. They can be nonnumeric
- 16. Question: Consider this room as an element. Are its variables such as, Names of students quantitative
- 17. Quantitative Data Discrete data – the data obtained as a result of counting. Examples: Number of
- 18. Scale of Measurement
- 19. SM for Qualitative Data (1) Nominal scale – a scale of measurement that uses name or
- 21. SM for Qualitative Data (2) Ordinal scale – a scale of measurement that is nominal and
- 23. SM for Quantitative Data (1) Interval scale – a scale of measurement that is ordinal and
- 25. SM for Quantitative Data (2) Ratio scale – a scale of measurement that is interval and
- 29. Raw data Raw data – the data that has not been processed (analyzed, categorized, put in
- 30. Aggregate data Aggregate data – the data that has already been processed to serve one’s goal.
- 31. Cross-section data – data collected at the same point in time or based on the same
- 32. Population and Sample Population – a collection of all elements of interest in a particular study.
- 33. Part 2. Data representation PART II. Data representation tools and techniques
- 34. Section I Qualitative data: Case 1. Research conducted on 50 individuals’ choice on GM Uzbekistan automobiles.
- 35. Tabular Methods: Frequency and Relative frequency tables
- 36. Graphical Method: Bar graph
- 37. Graphical Method: Pie chart
- 38. Quantitative data: Discrete Case 2. The store sold the following numbers of refrigerators on 30 different
- 39. Tabular Methods: Frequency, relative and cumulative frequency table Range = 23 – 0 = 23; Group
- 40. Tabular Method: Stem-and-Leaf diagram
- 41. Graphical Method: Histogram Histogram
- 42. Graphical Method Cumulative frequency
- 43. Quantitative data: Time series Case 3. the following table shows the profit made by three cotton
- 44. Quantitative data: Time series Times series graph (line graph)
- 45. Quantitative data: Time series Case 4: The company XYZ produces three types of products (A, B,
- 46. Tabular form
- 47. Graphical form Component bar graph
- 48. Graphical form Multiple bar graph
- 49. Graphical Method Scatter graph
- 50. Concluding remarks: Today, you learnt: The components of statistical table; The main types of data; The
- 51. Essential readings (Part 1) Jon Curwin…, “Quantitative Methods…”, Chapters 1-2 Glyn Burton…, “Quantitative Methods…”, Chapter 1
- 53. Скачать презентацию

Слайд 3Learning outcomes:
apply numerical skills to business and/or engineering problems
present statistical data in
Learning outcomes:
apply numerical skills to business and/or engineering problems
present statistical data in

Слайд 4In brief, you will learn how ...:
To appreciate benefit of numerical data
In brief, you will learn how ...:
To appreciate benefit of numerical data

Слайд 5Teaching methods:
1-hour online lecture each week (online)
2-hour tutorial each week (offline)
1-hour workshop
Teaching methods:
1-hour online lecture each week (online)
2-hour tutorial each week (offline)
1-hour workshop

Слайд 6Assessment methods:
Two assessments (or components):
In-class test (30%+10%).
30% goes to an in-class test
Assessment methods:
Two assessments (or components):
In-class test (30%+10%).
30% goes to an in-class test

Слайд 7LECTURE 1
DATA & DATA REPRESENTATION
Temur Makhkamov
Indira Khadjieva
QM Module Leaders
tmakhkamov@wiut.uz
i.khadjieva@wiut.uz
Office hours:
LECTURE 1
DATA & DATA REPRESENTATION
Temur Makhkamov
Indira Khadjieva
QM Module Leaders
tmakhkamov@wiut.uz
i.khadjieva@wiut.uz
Office hours:

Слайд 8Lecture outline
DATA
the meaning and types of data
sources of data
the scales
Lecture outline
DATA
the meaning and types of data
sources of data
the scales

Слайд 9What is data? (1)
Data –
the facts and figures that are collected, analyzed
What is data? (1)
Data –
the facts and figures that are collected, analyzed

Слайд 10What is data? (2)
Data may be obtained through already existing-sources or through
What is data? (2)
Data may be obtained through already existing-sources or through

Слайд 11Primary and Secondary data
Primary data – the data that are obtained as
Primary and Secondary data
Primary data – the data that are obtained as

Слайд 12Questions:
What data is more costly (expensive):
primary or secondary?
What data is
Questions:
What data is more costly (expensive):
primary or secondary?
What data is

Слайд 13Statistical data
Q: What are the components of the statistical table?
Statistical data
Q: What are the components of the statistical table?

Слайд 14Components of the tabular data
Element – the entity or item on which
Components of the tabular data
Element – the entity or item on which

Слайд 15Main types of data
Qualitative data provide labels or names for variables. They
Main types of data
Qualitative data provide labels or names for variables. They

Слайд 16Question:
Consider this room as an element.
Are its variables such as,
Names
Question:
Consider this room as an element.
Are its variables such as,
Names

Слайд 17Quantitative Data
Discrete data – the data obtained as a result of counting.
Examples:
Quantitative Data
Discrete data – the data obtained as a result of counting.
Examples:

Слайд 18Scale of Measurement
Scale of Measurement

Слайд 19SM for Qualitative Data (1)
Nominal scale – a scale of measurement that
SM for Qualitative Data (1)
Nominal scale – a scale of measurement that


Слайд 21SM for Qualitative Data (2)
Ordinal scale – a scale of measurement that
SM for Qualitative Data (2)
Ordinal scale – a scale of measurement that


Слайд 23SM for Quantitative Data (1)
Interval scale – a scale of measurement that
SM for Quantitative Data (1)
Interval scale – a scale of measurement that


Слайд 25SM for Quantitative Data (2)
Ratio scale – a scale of measurement that
SM for Quantitative Data (2)
Ratio scale – a scale of measurement that


Слайд 29Raw data
Raw data – the data that has not been processed (analyzed,
Raw data
Raw data – the data that has not been processed (analyzed,

Слайд 30Aggregate data
Aggregate data – the data that has already been processed to
Aggregate data
Aggregate data – the data that has already been processed to

Слайд 31
Cross-section data – data collected at the same point in time or
Cross-section data – data collected at the same point in time or

Слайд 32Population and Sample
Population – a collection of all elements of interest in
Population and Sample
Population – a collection of all elements of interest in

Слайд 33Part 2. Data representation
PART II. Data representation tools and techniques
Part 2. Data representation
PART II. Data representation tools and techniques

Слайд 34Section I Qualitative data:
Case 1. Research conducted on 50 individuals’ choice on
Section I Qualitative data:
Case 1. Research conducted on 50 individuals’ choice on

Слайд 35Tabular Methods:
Frequency and Relative frequency tables
Tabular Methods:
Frequency and Relative frequency tables

Слайд 36Graphical Method: Bar graph
Graphical Method: Bar graph

Слайд 37Graphical Method: Pie chart
Graphical Method: Pie chart

Слайд 38Quantitative data: Discrete
Case 2. The store sold the following numbers of refrigerators
Quantitative data: Discrete
Case 2. The store sold the following numbers of refrigerators

Слайд 39Tabular Methods:
Frequency, relative and cumulative frequency table
Range = 23 – 0
Tabular Methods:
Frequency, relative and cumulative frequency table
Range = 23 – 0

Слайд 40Tabular Method:
Stem-and-Leaf diagram
Tabular Method:
Stem-and-Leaf diagram

Слайд 41Graphical Method: Histogram
Histogram
Graphical Method: Histogram
Histogram

Слайд 42Graphical Method
Cumulative frequency
Graphical Method
Cumulative frequency

Слайд 43Quantitative data: Time series
Case 3. the following table shows the profit made
Quantitative data: Time series
Case 3. the following table shows the profit made

Слайд 44Quantitative data: Time series
Times series graph (line graph)
Quantitative data: Time series
Times series graph (line graph)

Слайд 45Quantitative data: Time series
Case 4:
The company XYZ produces three types of
Quantitative data: Time series
Case 4:
The company XYZ produces three types of

Слайд 46Tabular form
Tabular form

Слайд 47Graphical form
Component bar graph
Graphical form
Component bar graph

Слайд 48Graphical form
Multiple bar graph
Graphical form
Multiple bar graph

Слайд 49Graphical Method
Scatter graph
Graphical Method
Scatter graph

Слайд 50Concluding remarks:
Today, you learnt:
The components of statistical table;
The main types of data;
The
Concluding remarks:
Today, you learnt:
The components of statistical table;
The main types of data;
The

Слайд 51Essential readings (Part 1)
Jon Curwin…, “Quantitative Methods…”, Chapters 1-2
Glyn Burton…, “Quantitative Methods…”,
Essential readings (Part 1)
Jon Curwin…, “Quantitative Methods…”, Chapters 1-2
Glyn Burton…, “Quantitative Methods…”,

 Человек и закон. Правонарушения
 Презентация опыта работы по ведению внеурочной деятельности в рамках апробации Стандартов второго поколения в МОУ Мальчевская СО
 Выбор стратегии маркетинга
 Дифференциация звуков С — Ш в играх
 Молодежный центр ЮИ СФУ
 Презентация без названия(1)
 Покажи красный цвет
 Эмоции – это суперсила
 Проектная деятельность в МОУ «Чебеньковская СОШ»
 В поисках истины
 Сварка
 Добро пожаловать на проект Почта Банк
 Публичное выступление – призыв Берегите природу
 Прогерия
 Целевые кредиты
 Фрустрация как эмоциональное состояние
 Ленин атындағы шахтының жағдайында Д6 қыртысы бойынша конвейерлі бремсбергті жүргізудің технологиясы
 Формирование музыкальных способностей с помощью музыкально-дидактических игр
 Внешняя и внутренняя политика Николая Второго
 Выполнение чертежей. Часть 1
 Роль школьного курса ОБЖ в подготовке юношей к службе в армии
 Бизнес-план. Кафе Chocolate
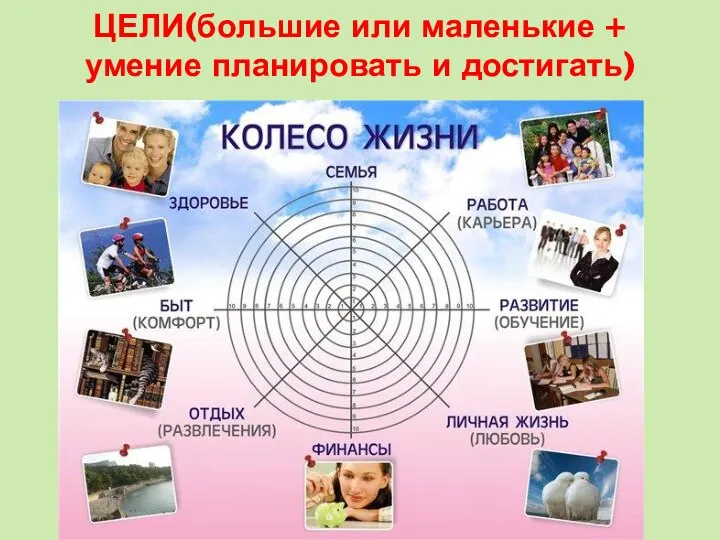 Колесо жизни. Цели (большие или маленькие + умение планировать и достигать)
 Виды карманов
 Сочинение-описание "Лисица" 2 класс
 Архитектура XX-XIX века
 Самое главное в жизни
 Презентация на тему ПОП-АРТ