- Market Analysis for Office Buildings

Содержание
- 2. Building Users Differentiated by Users/Tenants Major Institutional/Professional Occupied by banks, insurance companies, professionals, corporate headquarters General
- 3. Building Users Differentiated by Users/Tenants Quasi-industrial may be located in industrial parks flex and/or research and
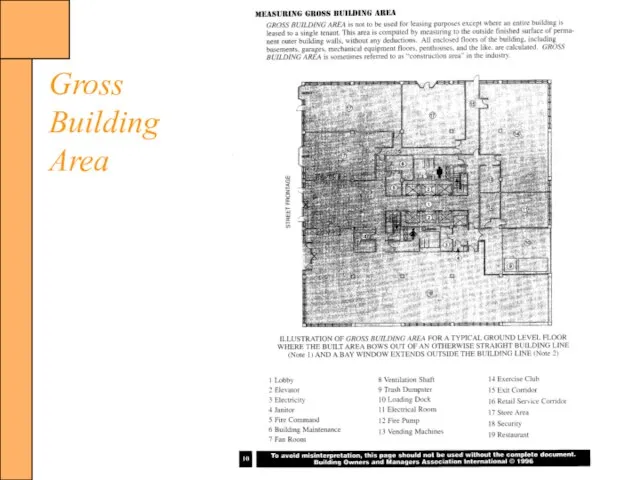
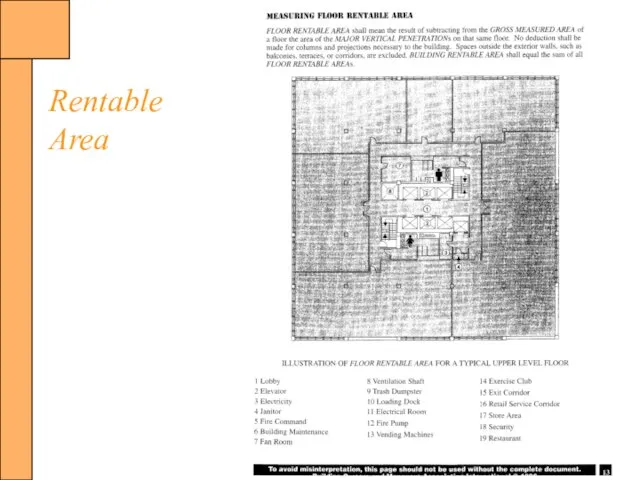
- 4. Building Terms Gross Building Area (GBA) Total area of the building in square feet Rentable Area
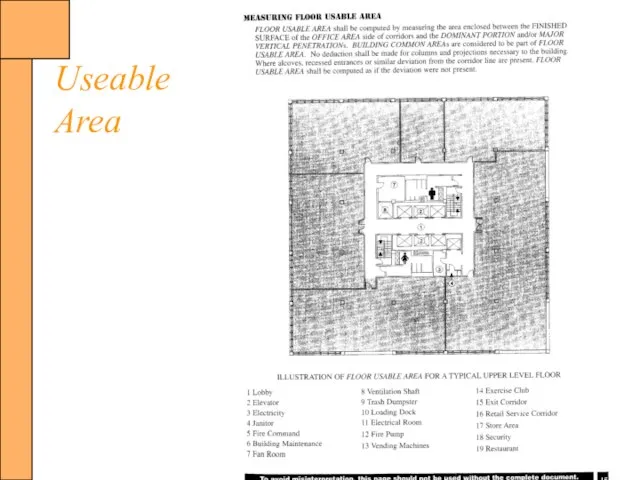
- 5. Building Terms Rented Area Amount of space under lease in a building Net Occupied Space (Useable)
- 6. Gross Building Area
- 7. Rentable Area
- 8. Useable Area
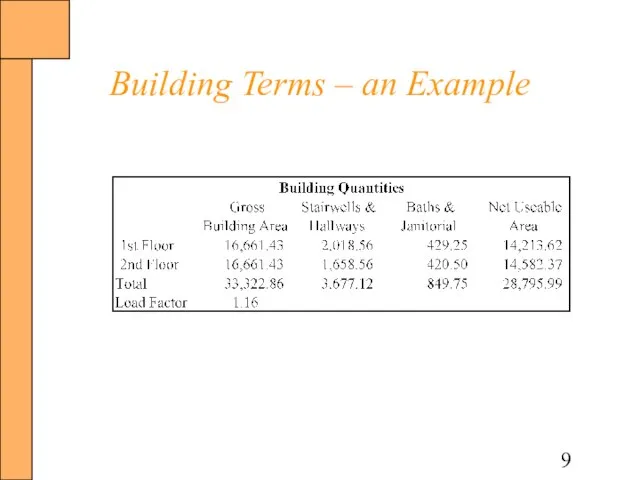
- 9. Building Terms – an Example
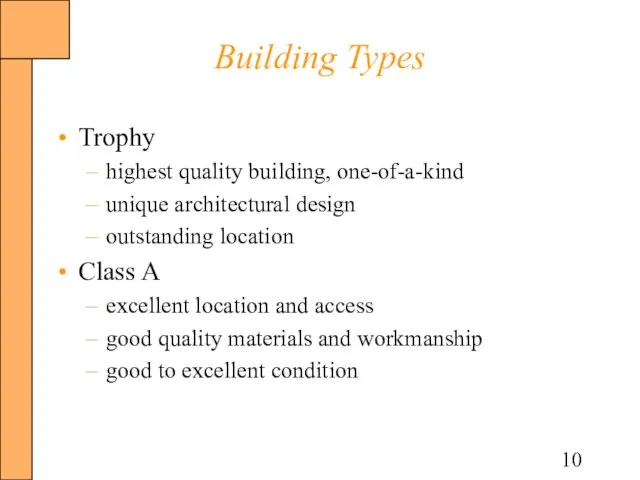
- 10. Building Types Trophy highest quality building, one-of-a-kind unique architectural design outstanding location Class A excellent location
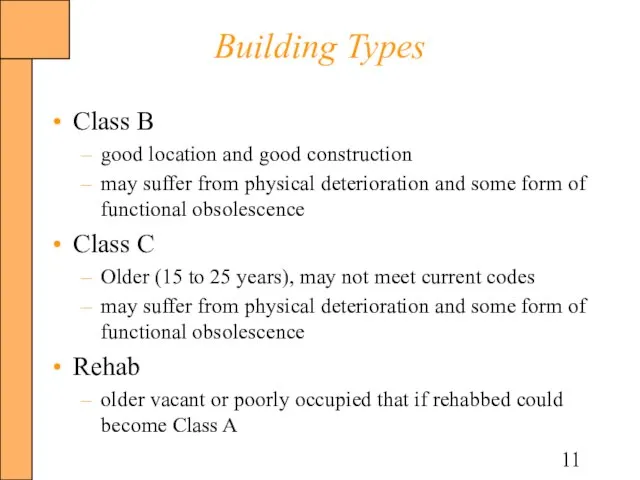
- 11. Building Types Class B good location and good construction may suffer from physical deterioration and some
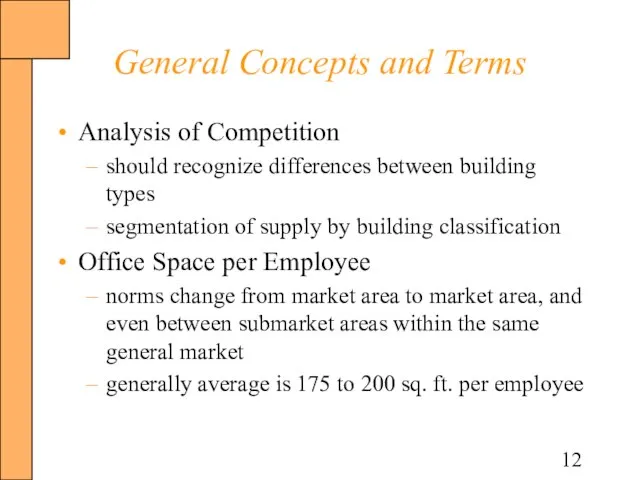
- 12. General Concepts and Terms Analysis of Competition should recognize differences between building types segmentation of supply
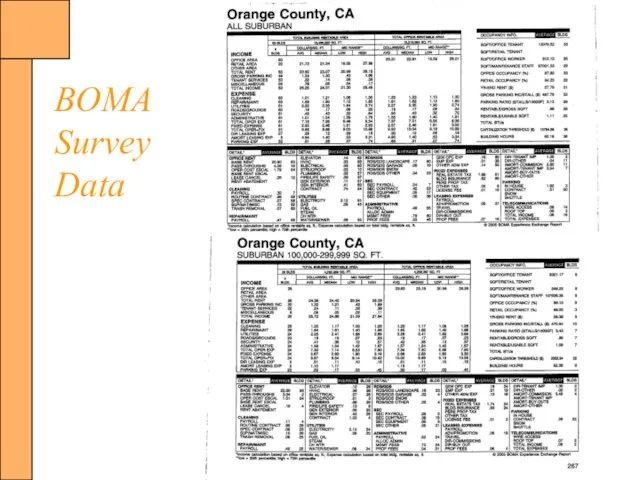
- 13. BOMA Survey Data
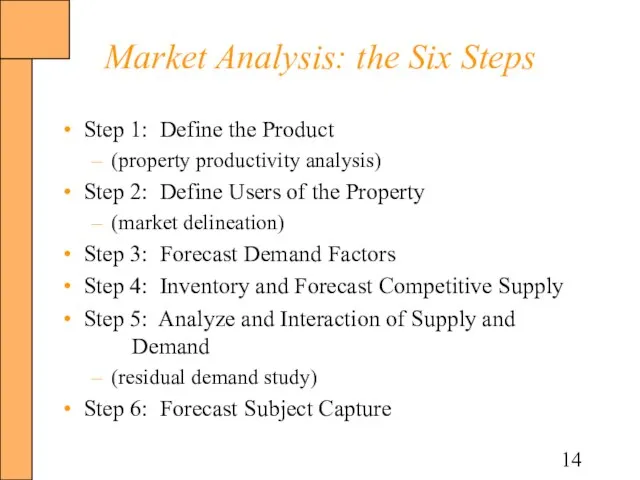
- 14. Market Analysis: the Six Steps Step 1: Define the Product (property productivity analysis) Step 2: Define
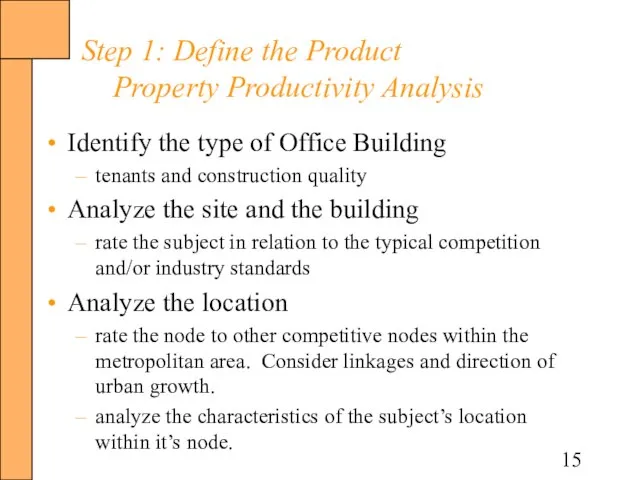
- 15. Step 1: Define the Product Property Productivity Analysis Identify the type of Office Building tenants and
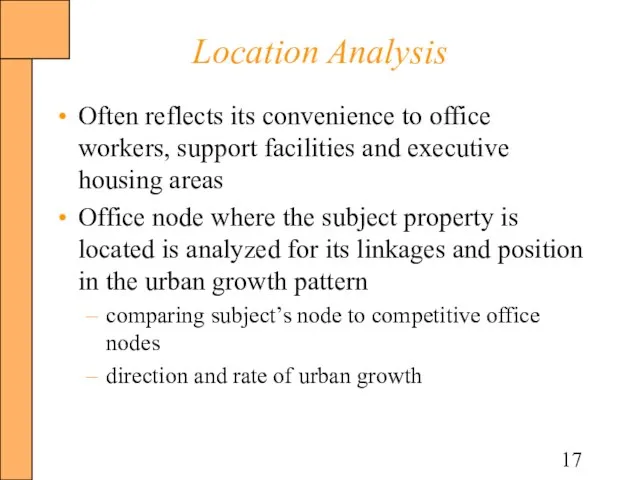
- 17. Location Analysis Often reflects its convenience to office workers, support facilities and executive housing areas Office
- 18. Location Analysis Identification of Office Nodes Downtown (central business district) Uptown located along major arterial highways
- 19. Typical Nodes of Office Building Development
- 20. Location Analysis Identification of Node Linkages Employee and Management Housing Support facilities within the node hotel,
- 22. Location Analysis Land Use considerations Reputation of the area Nuisances in the area Traffic conditions adjacent
- 23. Location Analysis Citywide growth analysis Procedure for analysis map current major urban centers and housing areas
- 24. Step 2: Define the Users of the Property Market Delineation Specify the market of possible property
- 25. Step 3: Forecast Demand Factors Inferred (trend) methods general employment growth (decline) trends general secondary data
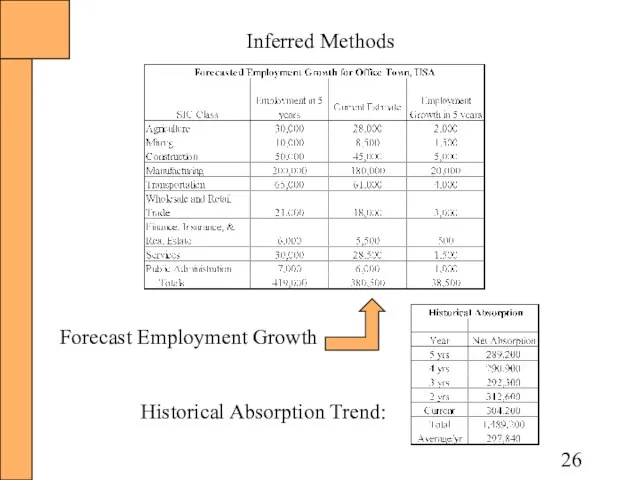
- 26. Inferred Methods Historical Absorption Trend: Forecast Employment Growth
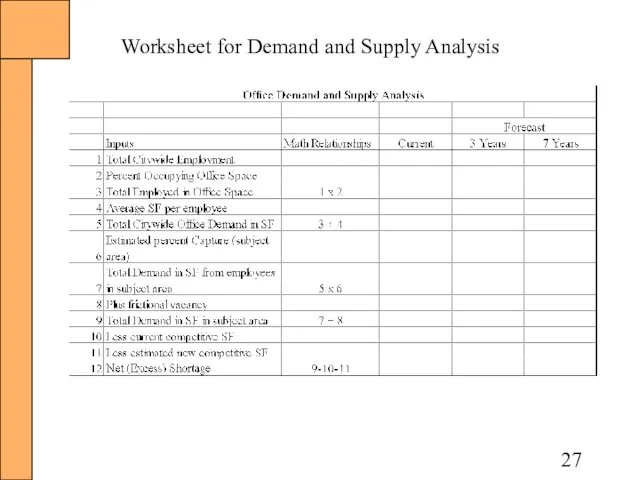
- 27. Worksheet for Demand and Supply Analysis
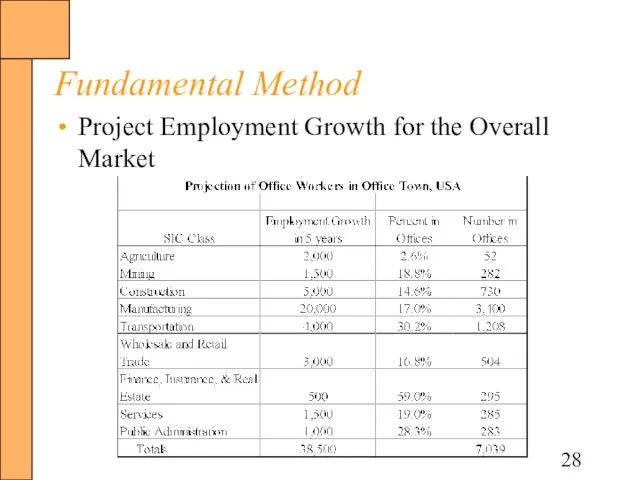
- 28. Fundamental Method Project Employment Growth for the Overall Market
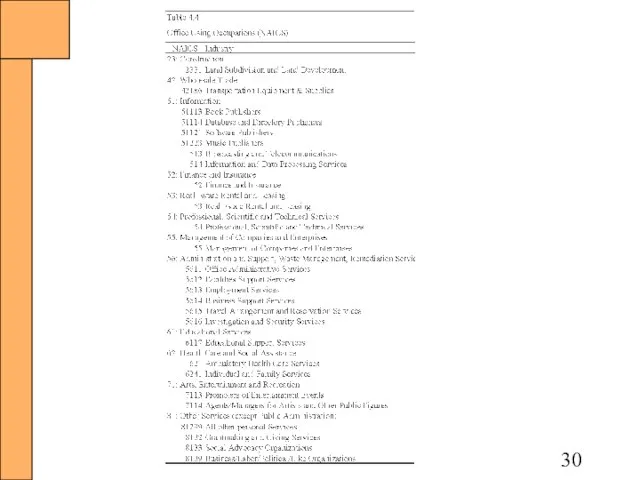
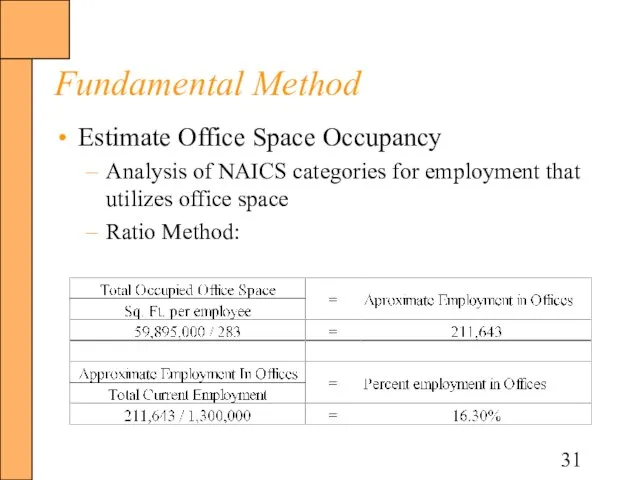
- 31. Fundamental Method Estimate Office Space Occupancy Analysis of NAICS categories for employment that utilizes office space
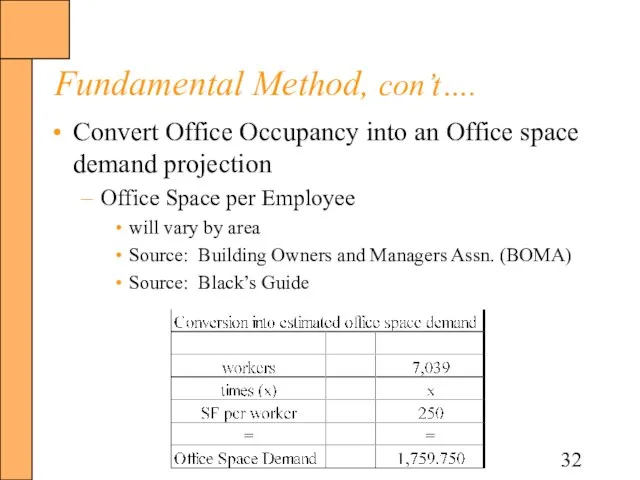
- 32. Fundamental Method, con’t…. Convert Office Occupancy into an Office space demand projection Office Space per Employee
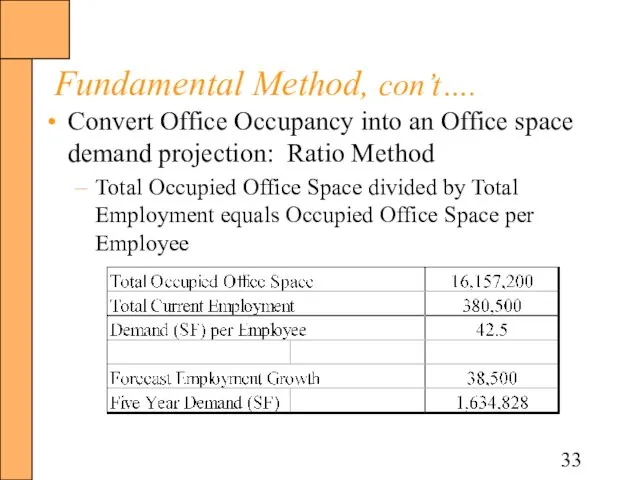
- 33. Fundamental Method, con’t…. Convert Office Occupancy into an Office space demand projection: Ratio Method Total Occupied
- 34. Fundamental Method, con’t…. Reconcile Demand Forecast Inferred Method Growth Trends: Positive Market Occupancy: Moderate Positive Citywide
- 35. Step 4: Inventory and Forecast Competitive Supply Inventory the current competitive office space within the subject’s
- 36. Survey of Existing Office Space
- 37. Inventory of Space Under Construction and Forecast of New Planned Space Review of Building Permits yields:
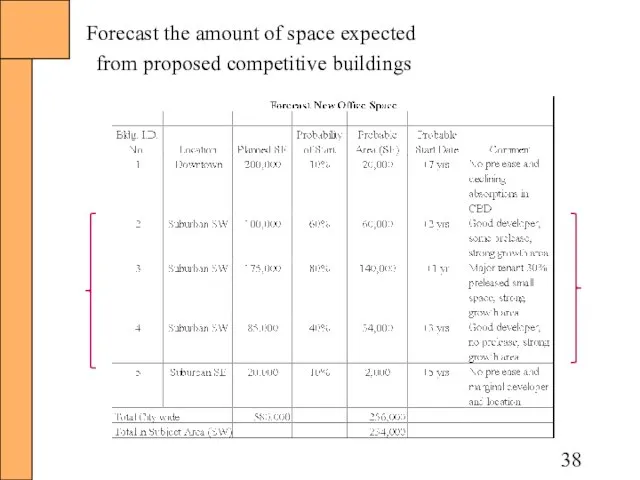
- 38. Forecast the amount of space expected from proposed competitive buildings
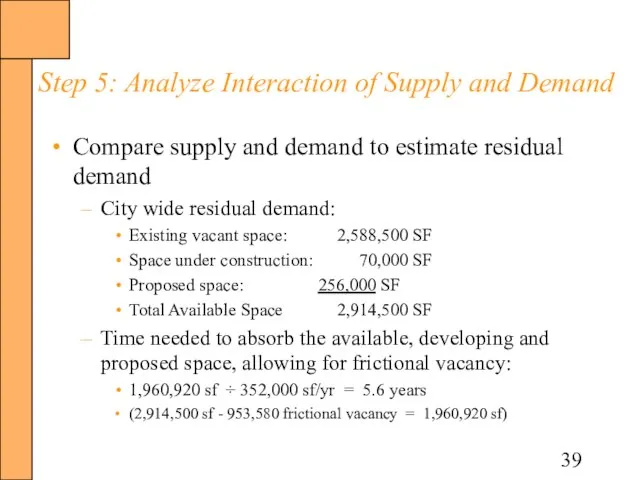
- 39. Step 5: Analyze Interaction of Supply and Demand Compare supply and demand to estimate residual demand
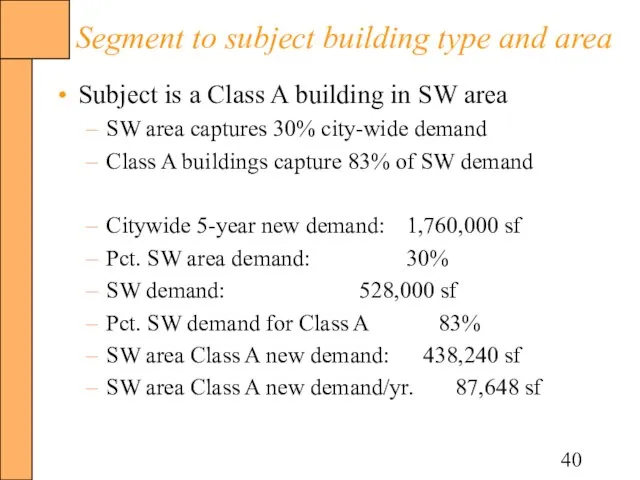
- 40. Segment to subject building type and area Subject is a Class A building in SW area
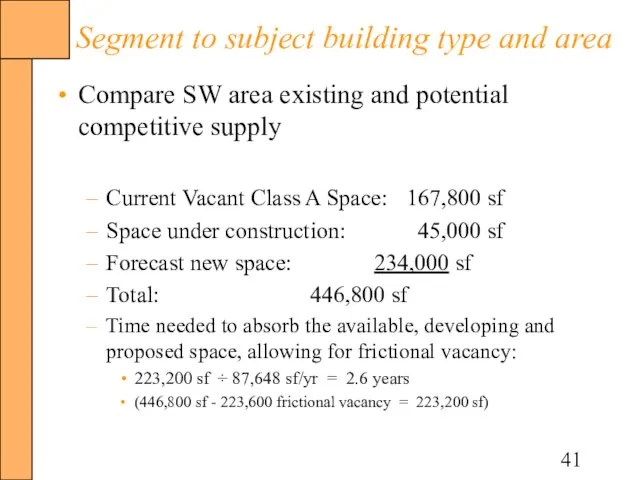
- 41. Segment to subject building type and area Compare SW area existing and potential competitive supply Current
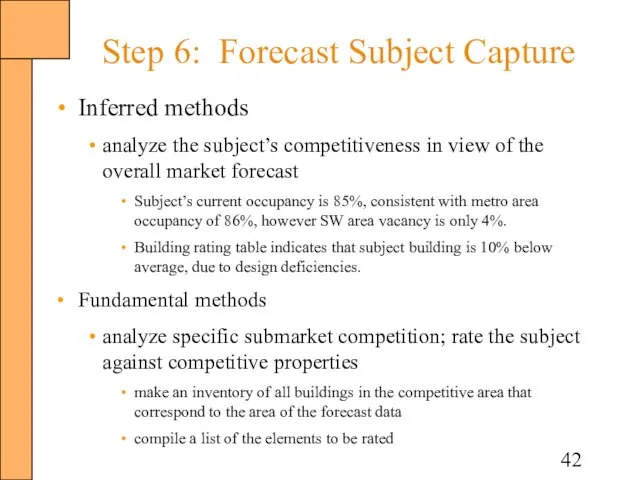
- 42. Step 6: Forecast Subject Capture Inferred methods analyze the subject’s competitiveness in view of the overall
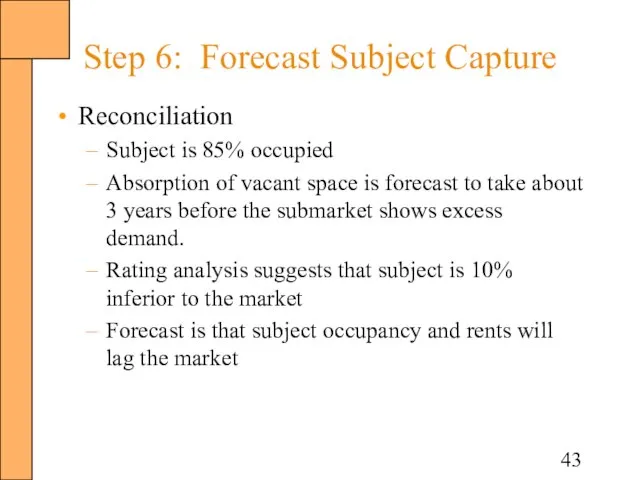
- 43. Step 6: Forecast Subject Capture Reconciliation Subject is 85% occupied Absorption of vacant space is forecast
- 45. Скачать презентацию
Слайд 2Building Users
Differentiated by Users/Tenants
Major Institutional/Professional
Occupied by banks, insurance companies, professionals, corporate headquarters
General
Building Users
Differentiated by Users/Tenants
Major Institutional/Professional
Occupied by banks, insurance companies, professionals, corporate headquarters
General
Слайд 3Building Users
Differentiated by Users/Tenants
Quasi-industrial
may be located in industrial parks
flex and/or research and
Building Users
Differentiated by Users/Tenants
Quasi-industrial
may be located in industrial parks
flex and/or research and
Слайд 4Building Terms
Gross Building Area (GBA)
Total area of the building in square feet
Rentable
Building Terms
Gross Building Area (GBA)
Total area of the building in square feet
Rentable
Слайд 5Building Terms
Rented Area
Amount of space under lease in a building
Net Occupied Space
Building Terms
Rented Area
Amount of space under lease in a building
Net Occupied Space
Слайд 6Gross
Building
Area
Gross
Building
Area
Слайд 7Rentable
Area
Rentable
Area
Слайд 8Useable
Area
Useable
Area
Слайд 9Building Terms – an Example
Building Terms – an Example
Слайд 10Building Types
Trophy
highest quality building, one-of-a-kind
unique architectural design
outstanding location
Class A
excellent location and access
good
Building Types
Trophy
highest quality building, one-of-a-kind
unique architectural design
outstanding location
Class A
excellent location and access
good
Слайд 11Building Types
Class B
good location and good construction
may suffer from physical deterioration and
Building Types
Class B
good location and good construction
may suffer from physical deterioration and
Слайд 12General Concepts and Terms
Analysis of Competition
should recognize differences between building types
segmentation of
General Concepts and Terms
Analysis of Competition
should recognize differences between building types
segmentation of
Слайд 13BOMA
Survey
Data
BOMA
Survey
Data
Слайд 14Market Analysis: the Six Steps
Step 1: Define the Product
(property productivity analysis)
Step 2:
Market Analysis: the Six Steps
Step 1: Define the Product
(property productivity analysis)
Step 2:
Слайд 15Step 1: Define the Product
Property Productivity Analysis
Identify the type of Office Building
tenants
Step 1: Define the Product
Property Productivity Analysis
Identify the type of Office Building
tenants
Слайд 17Location Analysis
Often reflects its convenience to office workers, support facilities and executive
Location Analysis
Often reflects its convenience to office workers, support facilities and executive
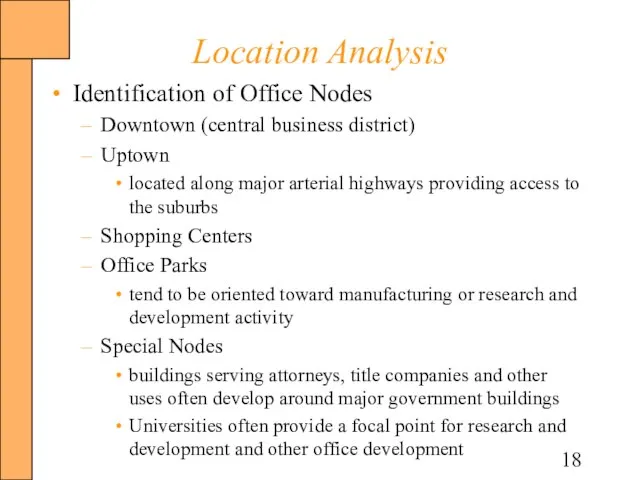
Слайд 18Location Analysis
Identification of Office Nodes
Downtown (central business district)
Uptown
located along major arterial highways
Location Analysis
Identification of Office Nodes
Downtown (central business district)
Uptown
located along major arterial highways
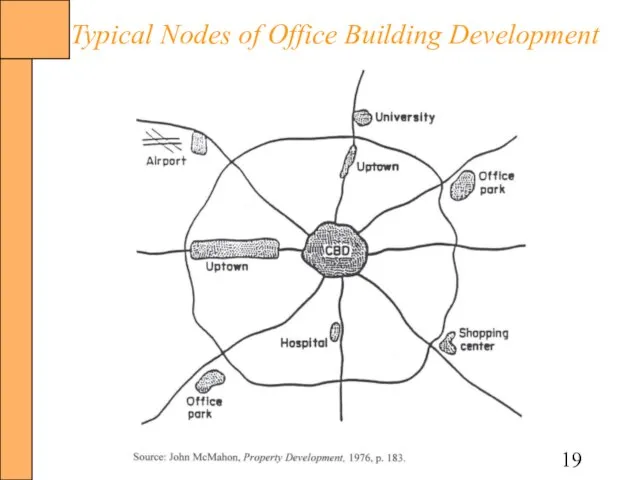
Слайд 19Typical Nodes of Office Building Development
Typical Nodes of Office Building Development
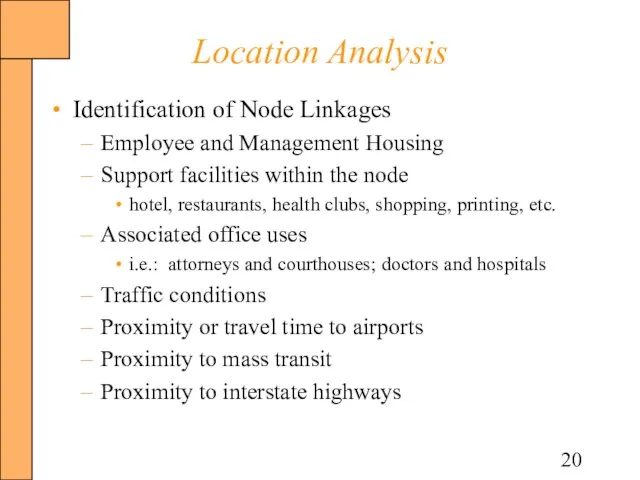
Слайд 20Location Analysis
Identification of Node Linkages
Employee and Management Housing
Support facilities within the node
hotel,
Location Analysis
Identification of Node Linkages
Employee and Management Housing
Support facilities within the node
hotel,
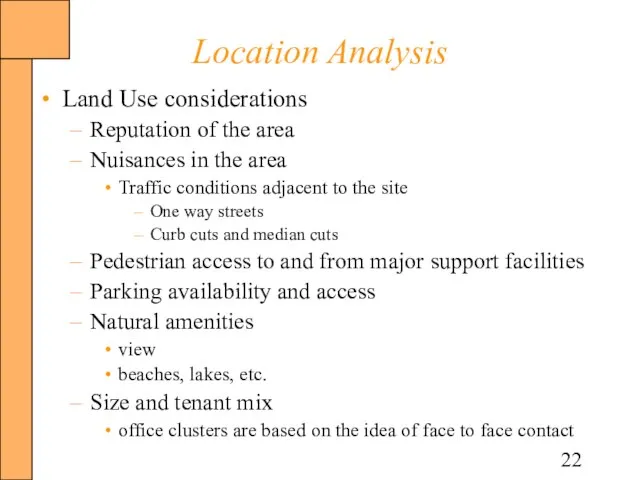
Слайд 22Location Analysis
Land Use considerations
Reputation of the area
Nuisances in the area
Traffic conditions adjacent
Location Analysis
Land Use considerations
Reputation of the area
Nuisances in the area
Traffic conditions adjacent
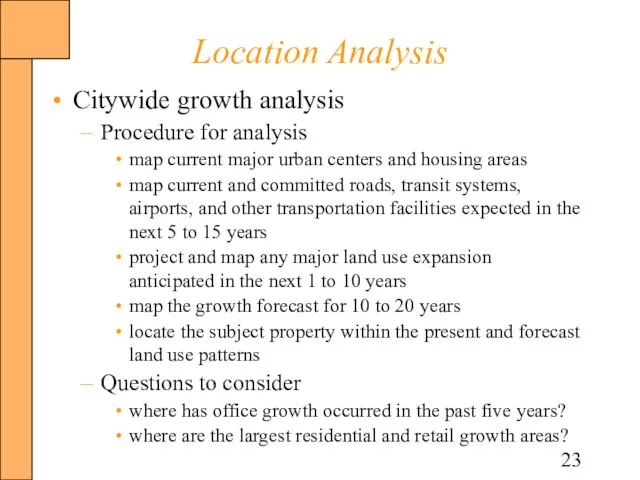
Слайд 23Location Analysis
Citywide growth analysis
Procedure for analysis
map current major urban centers and housing
Location Analysis
Citywide growth analysis
Procedure for analysis
map current major urban centers and housing
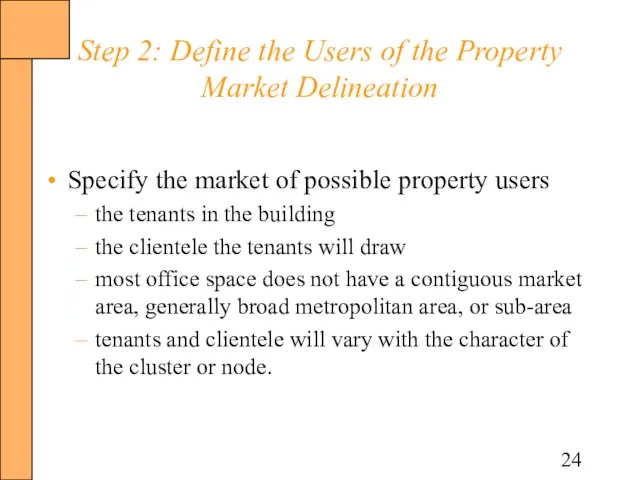
Слайд 24Step 2: Define the Users of the Property
Market Delineation
Specify the market of
Step 2: Define the Users of the Property
Market Delineation
Specify the market of
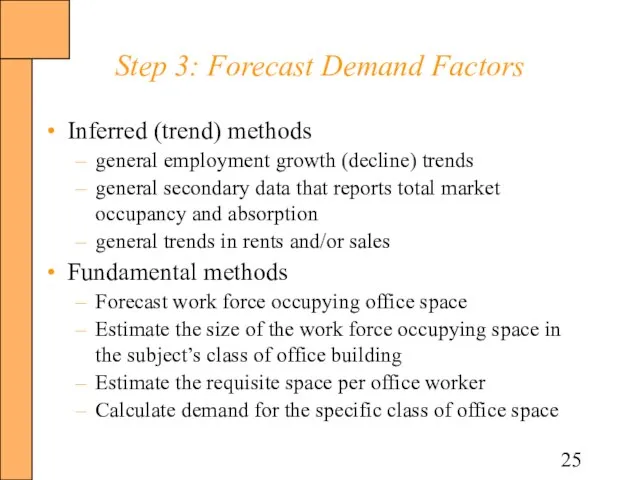
Слайд 25Step 3: Forecast Demand Factors
Inferred (trend) methods
general employment growth (decline) trends
general secondary
Step 3: Forecast Demand Factors
Inferred (trend) methods
general employment growth (decline) trends
general secondary
Слайд 26Inferred Methods
Historical Absorption Trend:
Forecast Employment Growth
Inferred Methods
Historical Absorption Trend:
Forecast Employment Growth
Слайд 27Worksheet for Demand and Supply Analysis
Worksheet for Demand and Supply Analysis
Слайд 28Fundamental Method
Project Employment Growth for the Overall Market
Fundamental Method
Project Employment Growth for the Overall Market
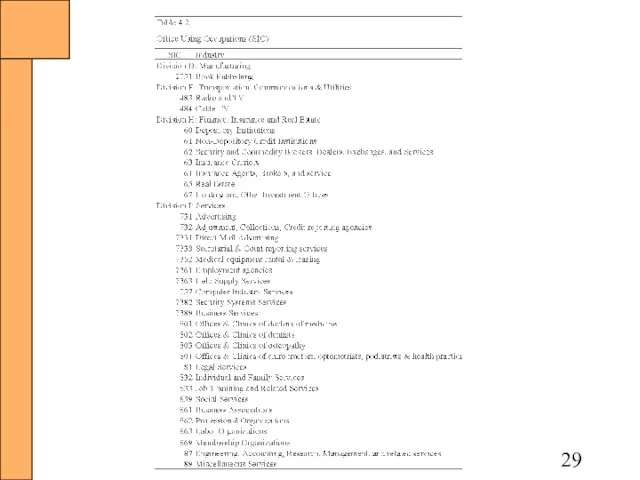
Слайд 31Fundamental Method
Estimate Office Space Occupancy
Analysis of NAICS categories for employment that utilizes
Fundamental Method
Estimate Office Space Occupancy
Analysis of NAICS categories for employment that utilizes
Слайд 32Fundamental Method, con’t….
Convert Office Occupancy into an Office space demand projection
Office Space
Fundamental Method, con’t….
Convert Office Occupancy into an Office space demand projection
Office Space
Слайд 33Fundamental Method, con’t….
Convert Office Occupancy into an Office space demand projection: Ratio
Fundamental Method, con’t….
Convert Office Occupancy into an Office space demand projection: Ratio
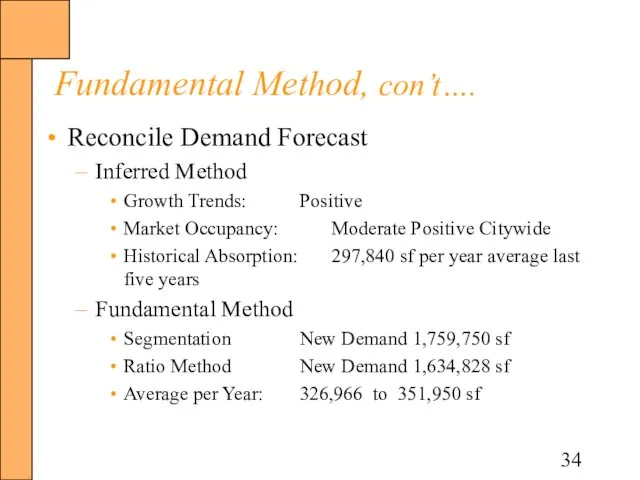
Слайд 34Fundamental Method, con’t….
Reconcile Demand Forecast
Inferred Method
Growth Trends: Positive
Market Occupancy: Moderate Positive Citywide
Historical Absorption: 297,840 sf
Fundamental Method, con’t….
Reconcile Demand Forecast
Inferred Method
Growth Trends: Positive
Market Occupancy: Moderate Positive Citywide
Historical Absorption: 297,840 sf
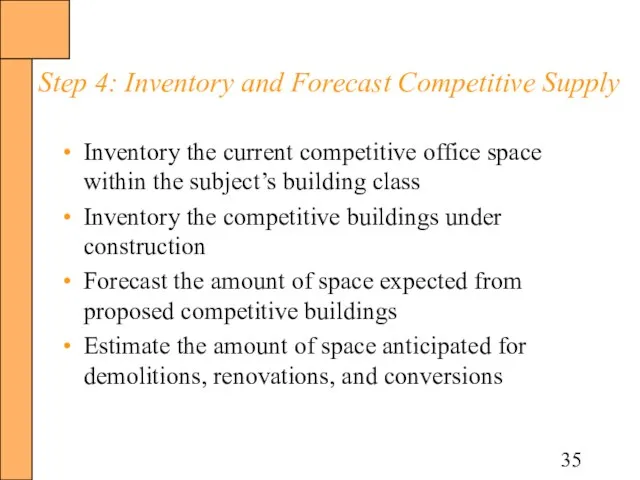
Слайд 35Step 4: Inventory and Forecast Competitive Supply
Inventory the current competitive office space
Step 4: Inventory and Forecast Competitive Supply
Inventory the current competitive office space
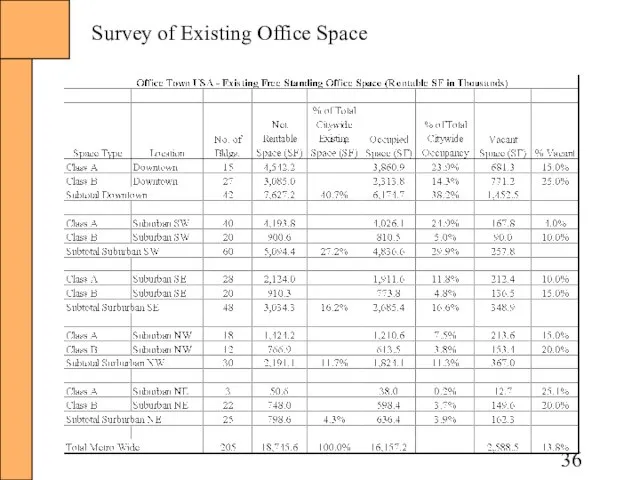
Слайд 36Survey of Existing Office Space
Survey of Existing Office Space
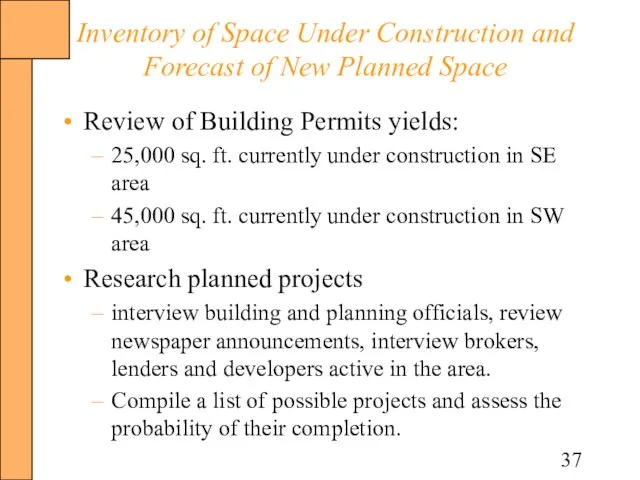
Слайд 37Inventory of Space Under Construction and Forecast of New Planned Space
Review of
Inventory of Space Under Construction and Forecast of New Planned Space
Review of
Слайд 38Forecast the amount of space expected
from proposed competitive buildings
Forecast the amount of space expected
from proposed competitive buildings
Слайд 39Step 5: Analyze Interaction of Supply and Demand
Compare supply and demand to
Step 5: Analyze Interaction of Supply and Demand
Compare supply and demand to
Слайд 40Segment to subject building type and area
Subject is a Class A building
Segment to subject building type and area
Subject is a Class A building
Слайд 41Segment to subject building type and area
Compare SW area existing and potential
Segment to subject building type and area
Compare SW area existing and potential
Слайд 42Step 6: Forecast Subject Capture
Inferred methods
analyze the subject’s competitiveness in view of
Step 6: Forecast Subject Capture
Inferred methods
analyze the subject’s competitiveness in view of
Слайд 43Step 6: Forecast Subject Capture
Reconciliation
Subject is 85% occupied
Absorption of vacant space is
Step 6: Forecast Subject Capture
Reconciliation
Subject is 85% occupied
Absorption of vacant space is
 Введення в Macromedia Flash CS3
 Возможности и ограничения применения общенаучных методов познания в методических системах предметного обучения Аспирант кафед
 Сыворотка-бустер с пептидами морского коллагена
 Военные реформы Петра I
 Лаборатория робототехники и программирования
 Словосполучення. Будова і види словосполучень за способами вираження головного слова
 Конвенции о защите прав человека в судах РФ
 Прионы и вирииды
 Презентация на тему Руды металлов
 Книга - наш лучший друг
 Информационно-коммуникационные технологии (ИКТ) - использование компьютера для поиска, передачи, сохранения, структурирования и о
 Лицо. Овынъ
 Процесс управления маркетингом
 Компьютерные вирусы
 Айратекс. Бизнес-пакеты
 Сущность права
 Лекция 2
 Презентация на тему Как выполняли арифметические действия в Древнем Риме
  Перспективні напрямки інтернет-проектів в Україні
 Презентация на тему Особенности международной сегментации
  О захвате самолета
 День семьи, любви и верности
 Виконала студентка Херсонського кооперативного економіко-правового коледжу групи П-291 Кулик Вікторія Херсон крізь призму розвитк
 Презентация на тему Возрастные особенности кровеносных сосудов
 Как пополнить Ваш счет и вывести средства
 Поделки из соленого теста
 王磐 朝天子·咏喇叭 阿廖娜
 Античне мистецтво. Давня Греція. Культура етрусків