- Interpret Charts

Содержание
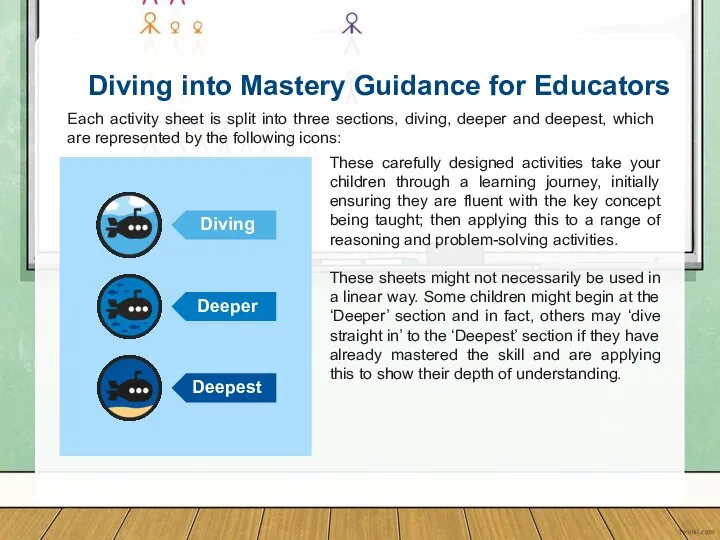
- 2. Diving into Mastery Guidance for Educators Each activity sheet is split into three sections, diving, deeper
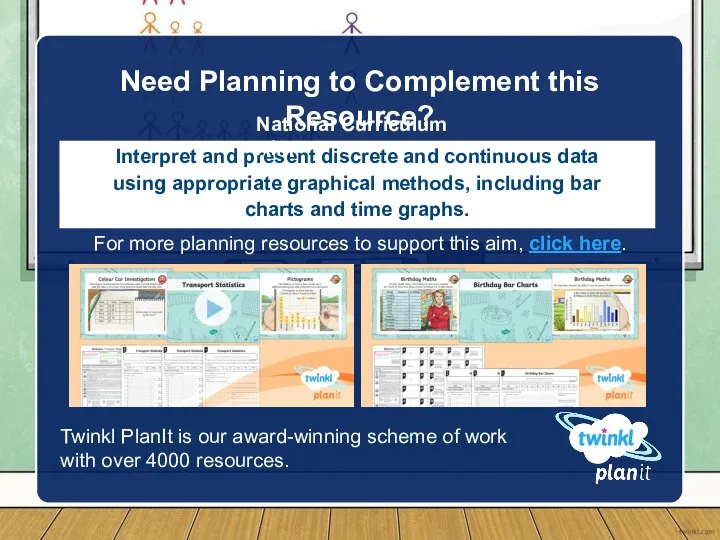
- 3. National Curriculum Objective Interpret and present discrete and continuous data using appropriate graphical methods, including bar
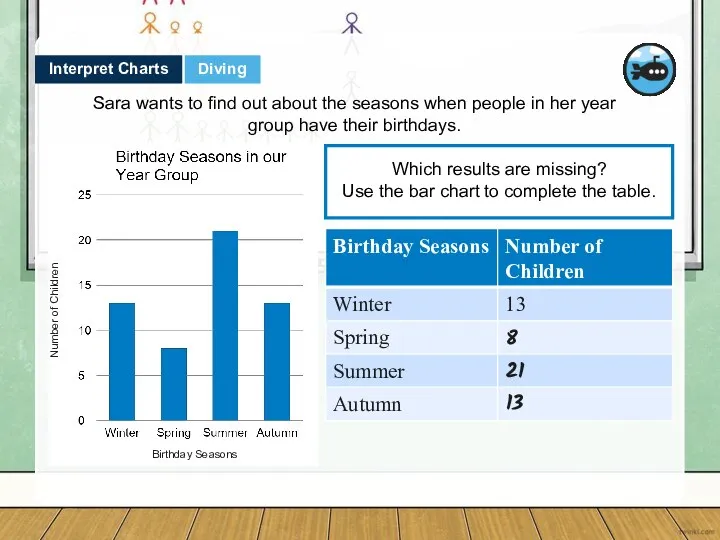
- 4. Interpret Charts Which results are missing? Use the bar chart to complete the table. Sara wants
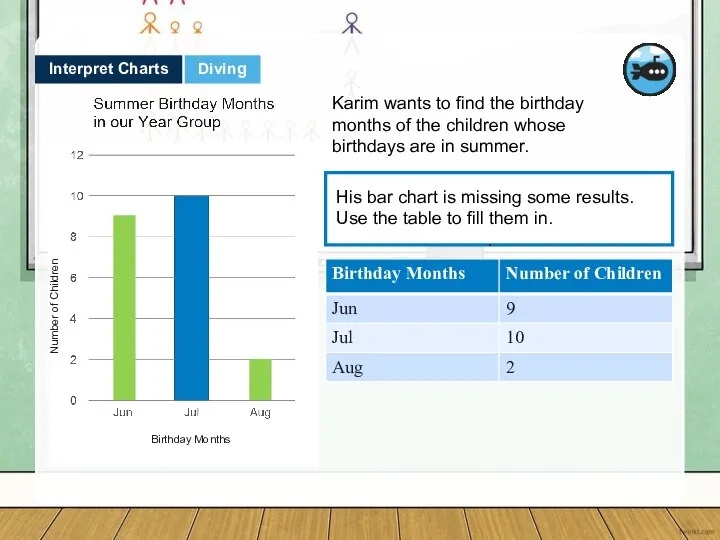
- 5. Interpret Charts His bar chart is missing some results. Use the table to fill them in.
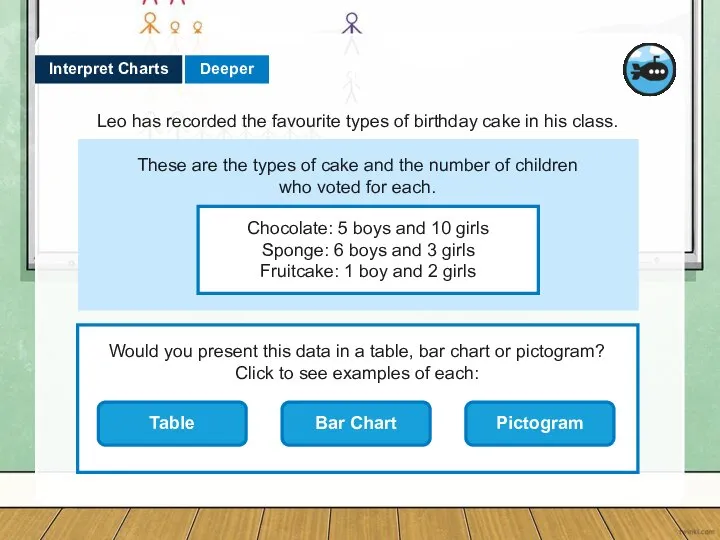
- 6. Leo has recorded the favourite types of birthday cake in his class. Deeper Interpret Charts These
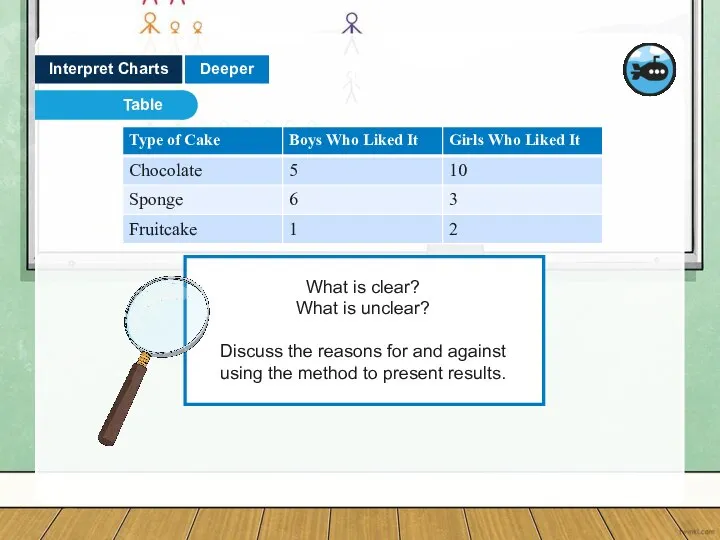
- 7. Deeper Interpret Charts What is clear? What is unclear? Discuss the reasons for and against using
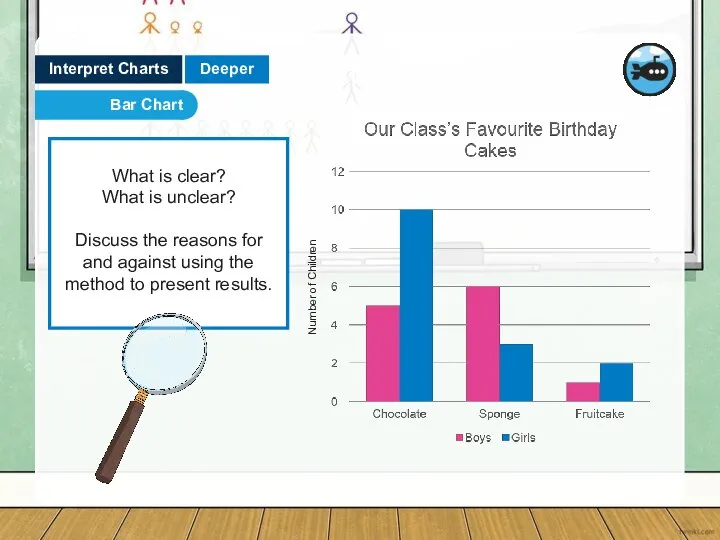
- 8. Deeper Interpret Charts What is clear? What is unclear? Discuss the reasons for and against using
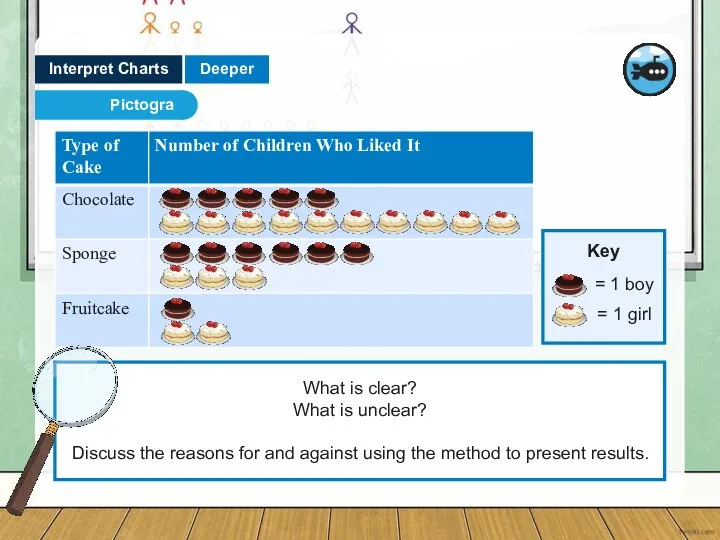
- 9. Deeper Interpret Charts Pictogram What is clear? What is unclear? Discuss the reasons for and against
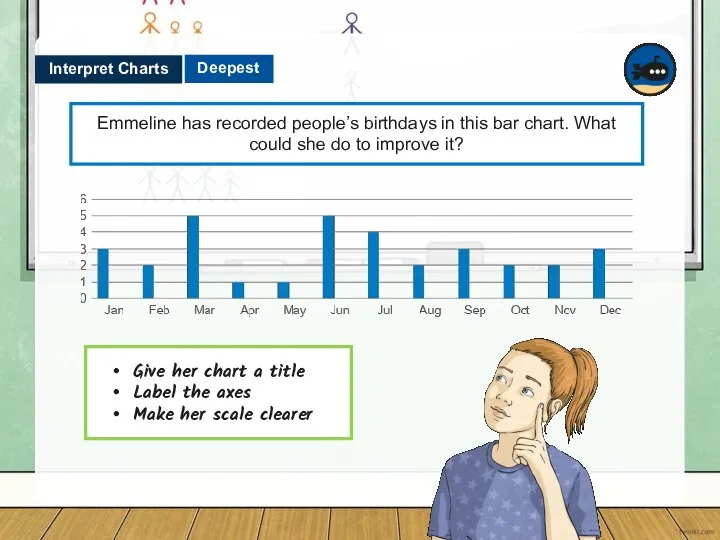
- 10. Deepest Emmeline has recorded people’s birthdays in this bar chart. What could she do to improve
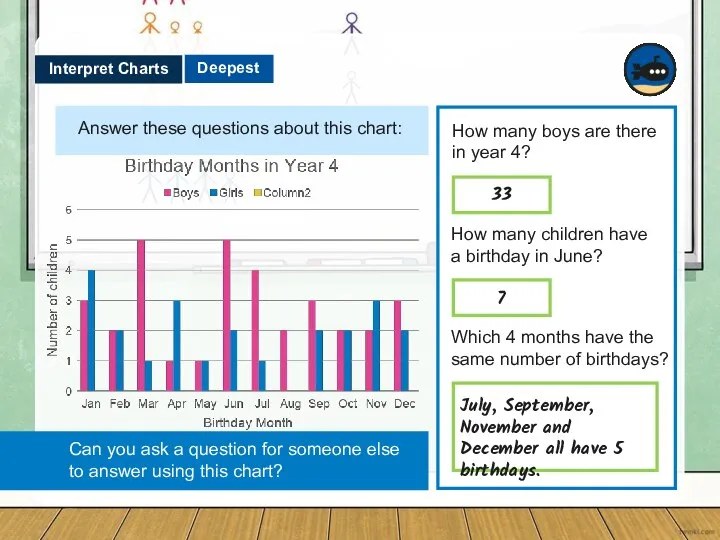
- 11. Deepest Answer these questions about this chart: Interpret Charts How many boys are there in year
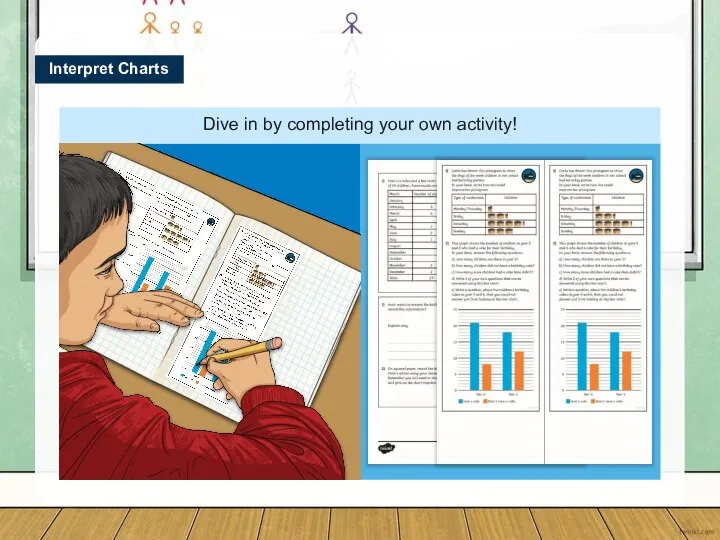
- 12. Dive in by completing your own activity! Interpret Charts
- 13. For more planning resources to support this aim, click here. Twinkl PlanIt is our award-winning scheme
- 15. Скачать презентацию
Слайд 3
National Curriculum Objective
Interpret and present discrete and continuous data using appropriate
National Curriculum Objective
Interpret and present discrete and continuous data using appropriate
Слайд 4Interpret Charts
Which results are missing?
Use the bar chart to complete the
Interpret Charts
Which results are missing?
Use the bar chart to complete the
Слайд 5Interpret Charts
His bar chart is missing some results. Use the table to
Interpret Charts
His bar chart is missing some results. Use the table to
Слайд 6Leo has recorded the favourite types of birthday cake in his class.
Deeper
Interpret
Leo has recorded the favourite types of birthday cake in his class.
Deeper
Interpret
Слайд 7Deeper
Interpret Charts
What is clear?
What is unclear?
Discuss the reasons for and against using
Deeper
Interpret Charts
What is clear?
What is unclear?
Discuss the reasons for and against using
Слайд 8Deeper
Interpret Charts
What is clear?
What is unclear?
Discuss the reasons for and against using
Deeper
Interpret Charts
What is clear?
What is unclear?
Discuss the reasons for and against using
Слайд 9Deeper
Interpret Charts
Pictogram
What is clear?
What is unclear?
Discuss the reasons for and against using
Deeper
Interpret Charts
Pictogram
What is clear?
What is unclear?
Discuss the reasons for and against using
Слайд 10Deepest
Emmeline has recorded people’s birthdays in this bar chart. What could she
Deepest
Emmeline has recorded people’s birthdays in this bar chart. What could she
Слайд 11Deepest
Answer these questions about this chart:
Interpret Charts
How many boys are there in
Deepest
Answer these questions about this chart:
Interpret Charts
How many boys are there in
Слайд 12Dive in by completing your own activity!
Interpret Charts
Dive in by completing your own activity!
Interpret Charts
Слайд 13
For more planning resources to support this aim, click here.
Twinkl PlanIt
For more planning resources to support this aim, click here.
Twinkl PlanIt
 Занимательный английский язык
 We are talking about Canada
 Twenty + fifty-eight
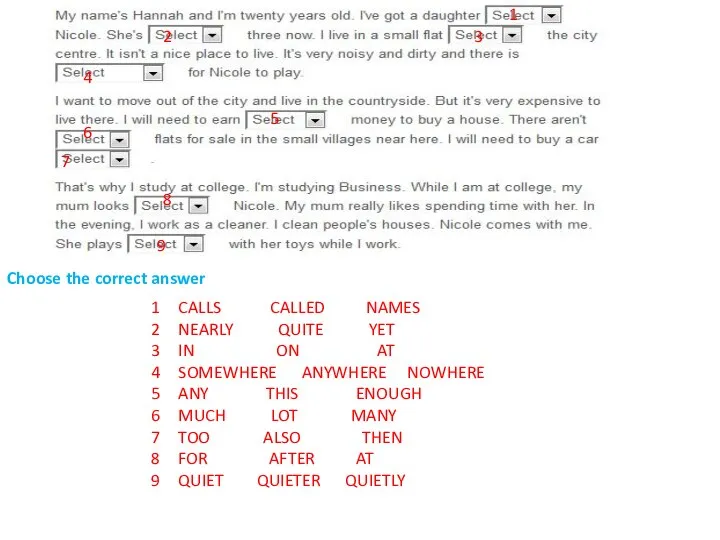 Test assignments
 Magic Momens
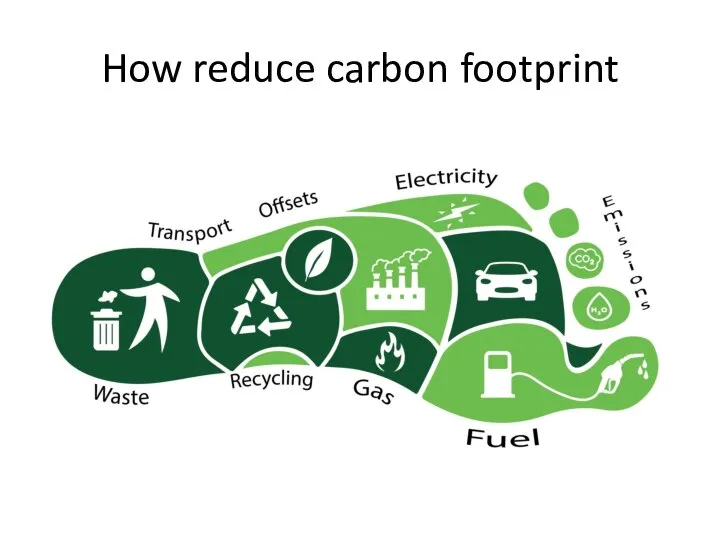 How reduce our carbon footprint
 Путешествие в Волшебную страну
 Preparing for SAT. Grade 1
 Презентация на тему Условные предложения
 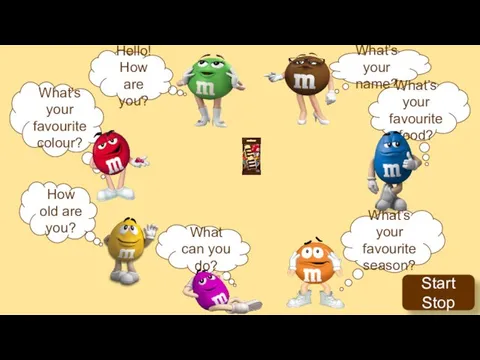 What’s your name?
 Click on the right name
 What is communication_
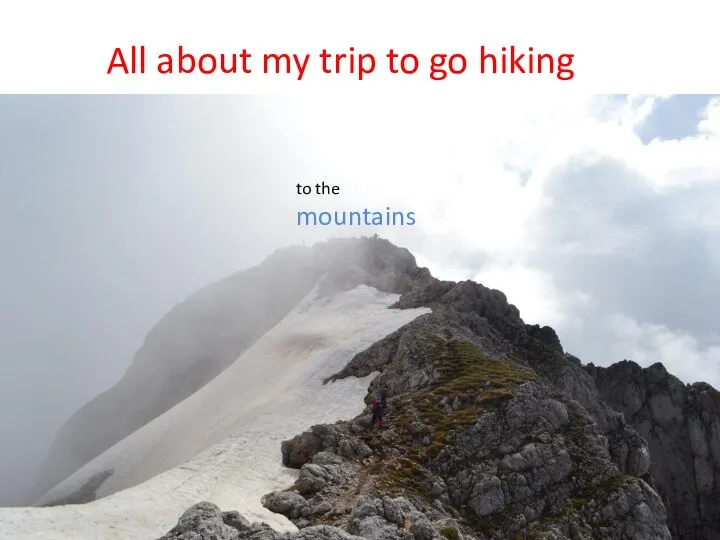 All about my trip to go hiking to the mountains
 Simply Speaking 2
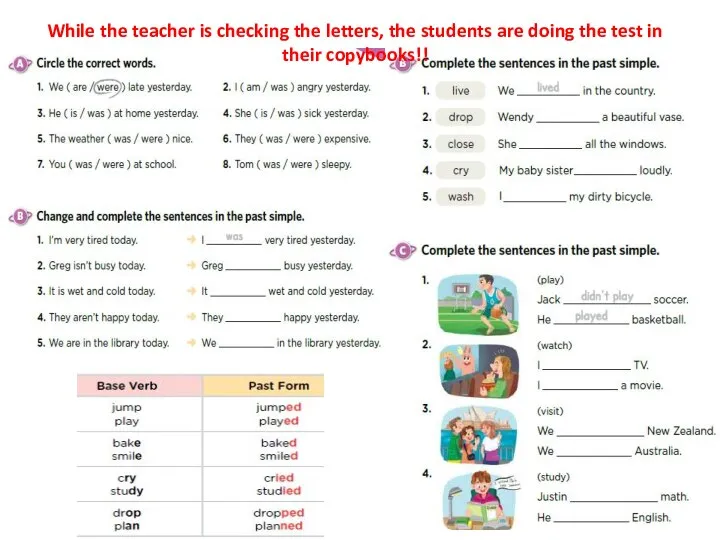 Kidsbox (was+weather)
 Shape of you
 Evacuation points
 Comparatives and Superlatives
 About your world
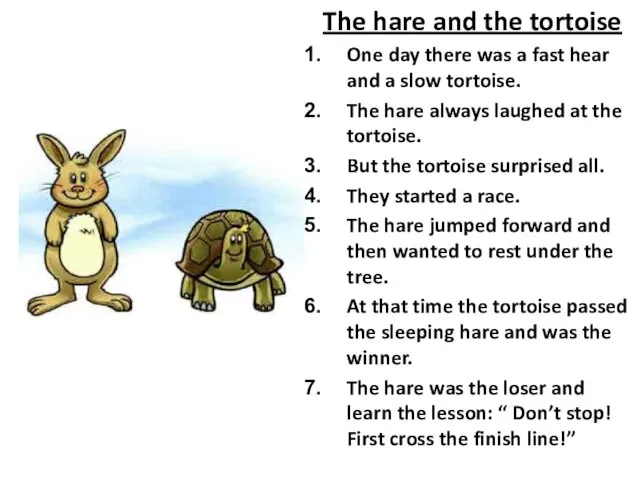 The hare and the tortoise
 Questions template
 Презентация на тему Кластер на уроках английского языка
  I like the cat
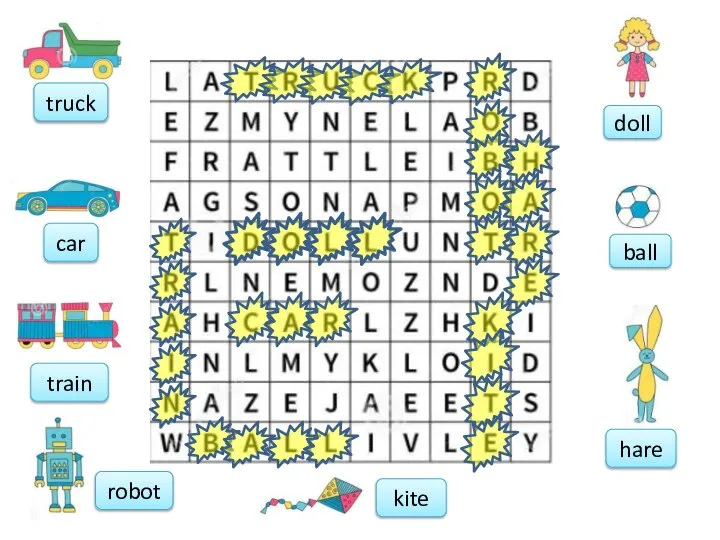 Wordsearch toys
 Эллиптические конструкции
 Lesson planning
 Shopping game
 Сложные слова. 3 класс