- Confidence intervals

Содержание
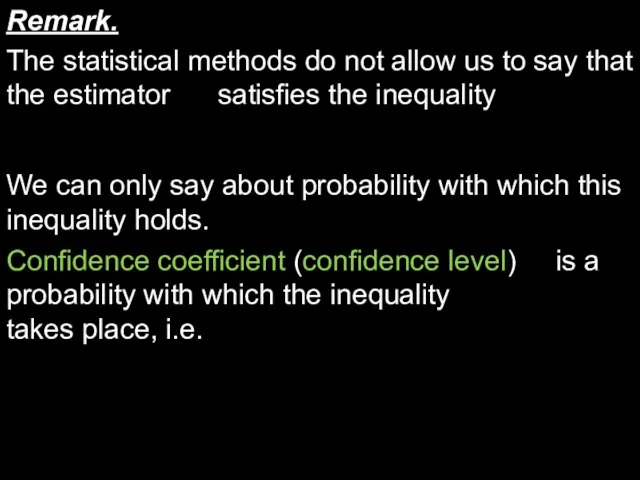
- 2. Confidence coefficient (confidence level) is a probability with which the inequality takes place, i.e. Remark. The
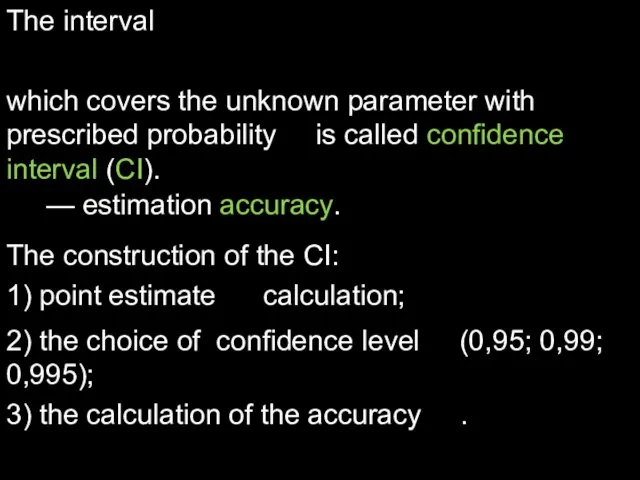
- 3. The interval which covers the unknown parameter with prescribed probability is called confidence interval (CI). —
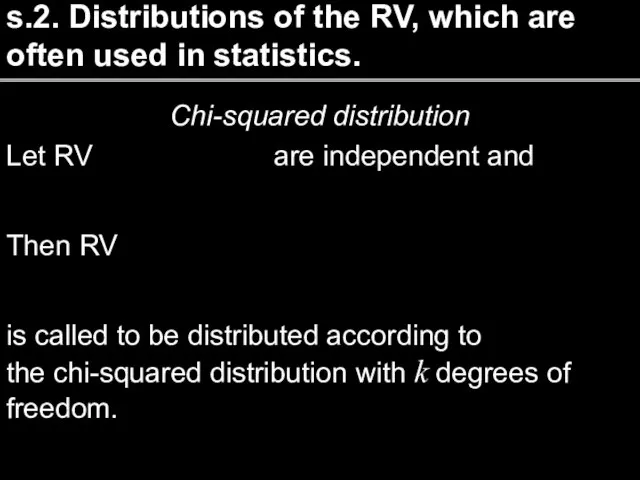
- 4. s.2. Distributions of the RV, which are often used in statistics. Chi-squared distribution Let RV are
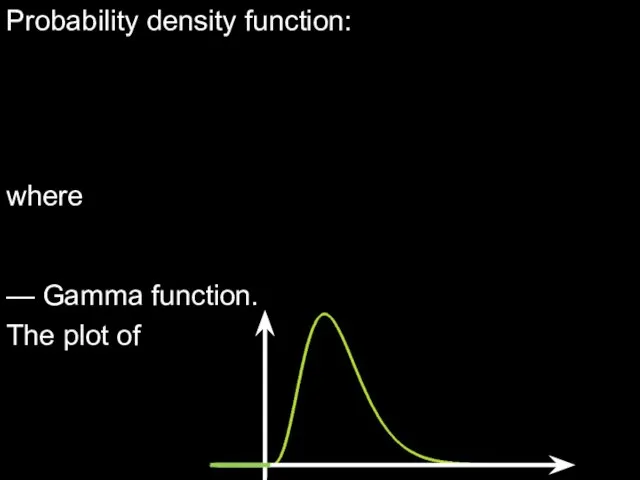
- 5. Probability density function: where — Gamma function. The plot of
- 6. The expected value: The variance: The quantile of the distribution, which corresponds the statistical significance ,
- 7. Student’s t-distribution (t-distribution) Let RV has the chi-squared distribution with k degrees of freedom. Then the
- 8. Probability density function: The plot of the The expected value: The variance:
- 9. The quantile of the t-distribution, which corresponds the statistical significance , is a such value that
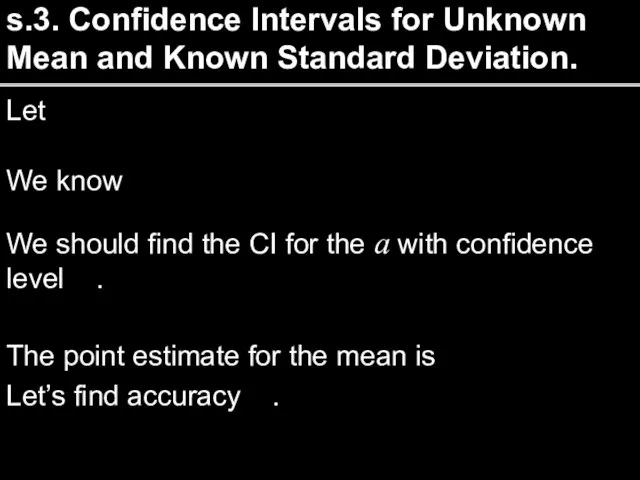
- 10. s.3. Confidence Intervals for Unknown Mean and Known Standard Deviation. Let We know We should find
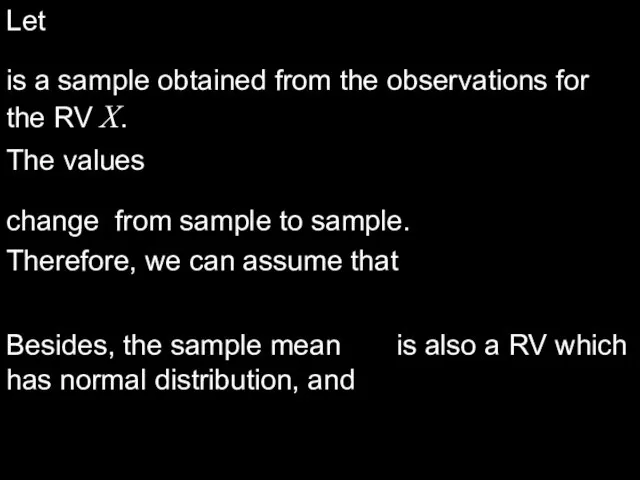
- 11. Let is a sample obtained from the observations for the RV X. The values change from
- 12. i.e.
- 13. Since then Let us denote Then and
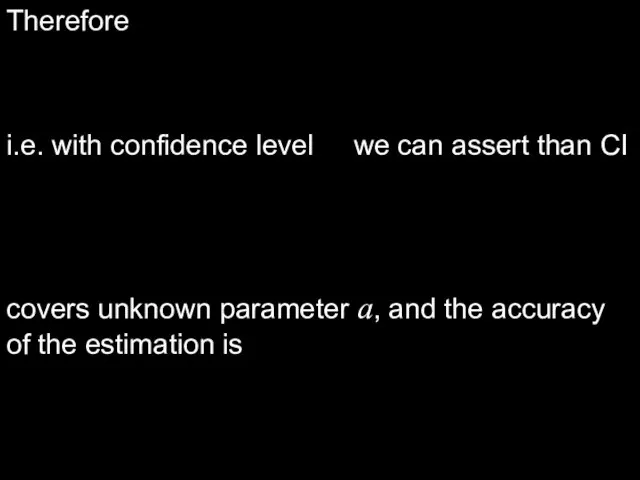
- 14. Therefore i.e. with confidence level we can assert than CI covers unknown parameter a, and the
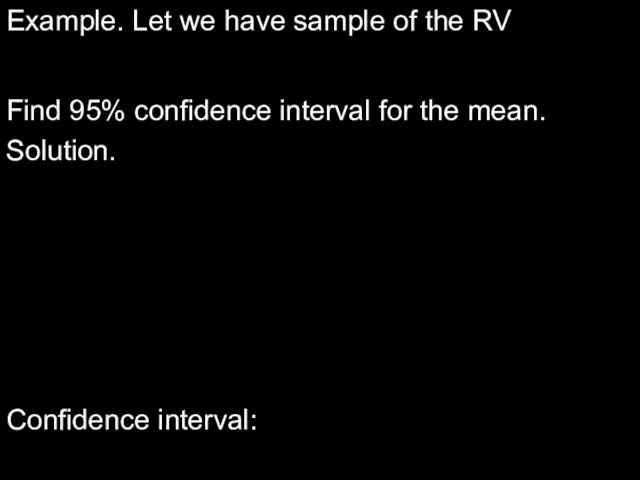
- 15. Example. Let we have sample of the RV Find 95% confidence interval for the mean. Solution.
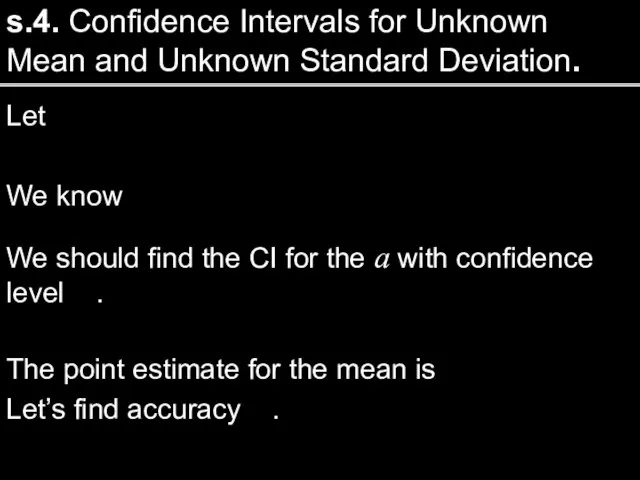
- 16. s.4. Confidence Intervals for Unknown Mean and Unknown Standard Deviation. Let We know We should find
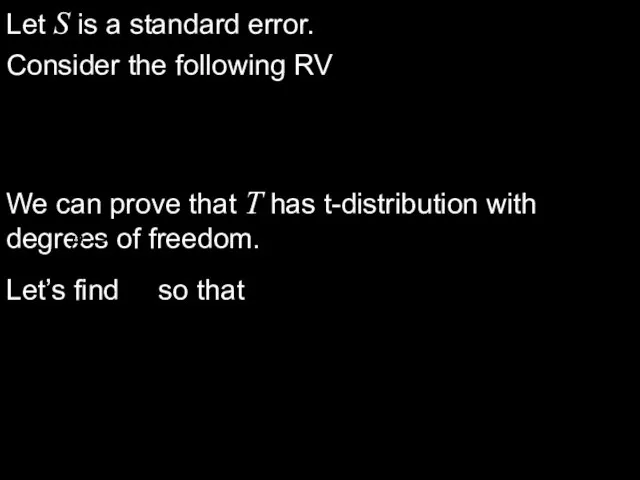
- 17. Let S is a standard error. Consider the following RV We can prove that T has
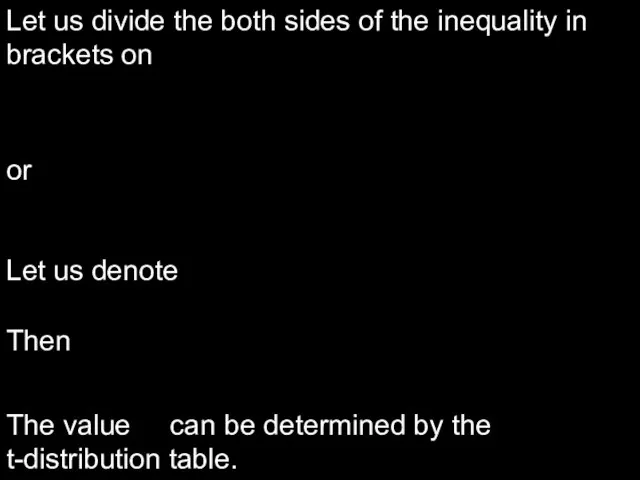
- 18. Let us divide the both sides of the inequality in brackets on or Let us denote
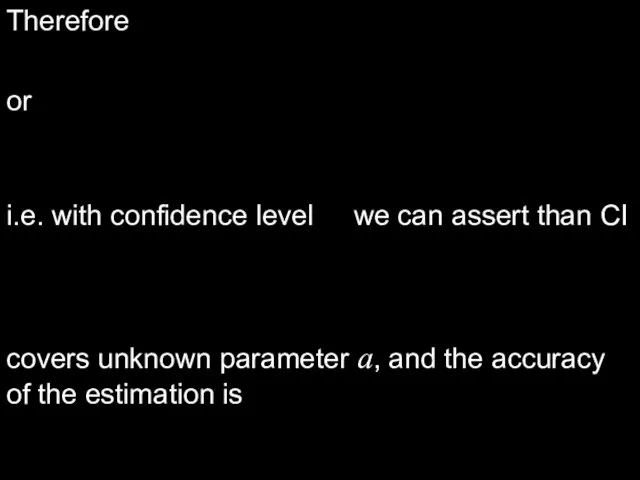
- 19. i.e. with confidence level we can assert than CI Therefore or covers unknown parameter a, and
- 20. Example. In the previous example find CI for the unknown mean, if standard deviation is unknown.
- 22. Скачать презентацию
Слайд 3The interval
which covers the unknown parameter with prescribed probability is called confidence
The interval
which covers the unknown parameter with prescribed probability is called confidence
Слайд 4s.2. Distributions of the RV, which are often used in statistics.
Chi-squared distribution
Let
s.2. Distributions of the RV, which are often used in statistics.
Chi-squared distribution
Let
Слайд 5Probability density function:
where
— Gamma function.
The plot of
Probability density function:
where
— Gamma function.
The plot of
Слайд 6The expected value:
The variance:
The quantile of the distribution, which corresponds the statistical
The expected value:
The variance:
The quantile of the distribution, which corresponds the statistical
Слайд 7Student’s t-distribution (t-distribution)
Let
RV has the chi-squared distribution with k degrees of freedom.
Then the RV
is called
Student’s t-distribution (t-distribution)
Let
RV has the chi-squared distribution with k degrees of freedom.
Then the RV
is called
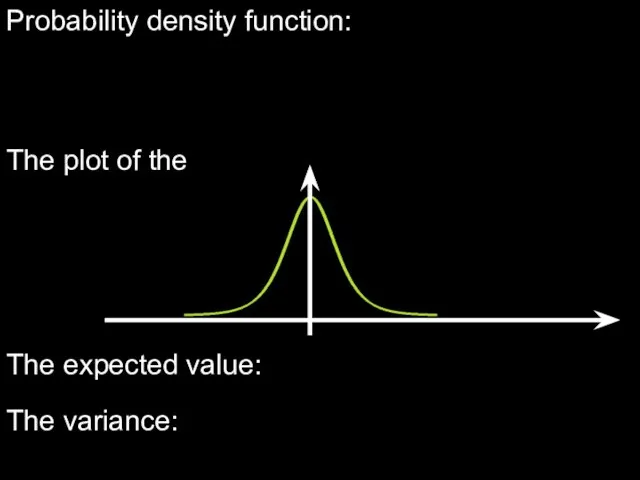
Слайд 8Probability density function:
The plot of the
The expected value:
The variance:
Probability density function:
The plot of the
The expected value:
The variance:
Слайд 9The quantile of the t-distribution, which corresponds the statistical significance , is
The quantile of the t-distribution, which corresponds the statistical significance , is
Слайд 10s.3. Confidence Intervals for Unknown Mean and Known Standard Deviation.
Let
We know
We should
s.3. Confidence Intervals for Unknown Mean and Known Standard Deviation.
Let
We know
We should
Слайд 11Let
is a sample obtained from the observations for the RV X.
The values
change
Let
is a sample obtained from the observations for the RV X.
The values
change
Слайд 12i.e.
i.e.

Слайд 13Since
then
Let us denote
Then
and
Since
then
Let us denote
Then
and

Слайд 14Therefore
i.e. with confidence level we can assert than CI
covers unknown parameter a,
Therefore
i.e. with confidence level we can assert than CI
covers unknown parameter a,
Слайд 15Example. Let we have sample of the RV
Find 95% confidence interval
Example. Let we have sample of the RV
Find 95% confidence interval
Слайд 16s.4. Confidence Intervals for Unknown Mean and Unknown Standard Deviation.
Let
We know
We should
s.4. Confidence Intervals for Unknown Mean and Unknown Standard Deviation.
Let
We know
We should
Слайд 17Let S is a standard error.
Consider the following RV
We can prove that
Let S is a standard error.
Consider the following RV
We can prove that
Слайд 18Let us divide the both sides of the inequality in brackets on
or
Let
Let us divide the both sides of the inequality in brackets on
or
Let
Слайд 19i.e. with confidence level we can assert than CI
Therefore
or
covers unknown parameter a,
i.e. with confidence level we can assert than CI
Therefore
or
covers unknown parameter a,
Слайд 20Example. In the previous example find CI for the unknown mean, if
Example. In the previous example find CI for the unknown mean, if
 Этапы консультирования
 Presentation_of_Uzbekistan_RU-03-2022
 Война России в союзе с Австрией против Наполеона
 Процесс запуска изменений. InterimConsult
 ТОПОГРАФИЧЕСКАЯ АНАТОМИЯ И ОПЕРАТИВНАЯ ХИРУРГИЯ ЛИЦА
  Тема 7-8 (7.1., 7.2) Понятие об инновационном проекте
 Презентация на тему Презентация учителя-дефектолога
 Рисуем мимозу
 СОВРЕМЕННЫЕ МЕТОДЫ СТОИМОСТНО-ОРИЕНТИРОВАННОГО УПРАВЛЕНИЯ ПРЕДПРИЯТИЕМ
 Что же есть человек?
 Жизнь на Земле
 2022-04-04_GIA-9_normat_dok
 КОНДИЦИОНЕРЫ АВТОНОМНЫЕ ДЛЯ АТОМНЫХ ЭЛЕКТРОСТАНЦИЙ КСА – 6,5/25 1КСА – 6,5/25
 Презентация на тему Трансгенные продукты
 ПРОГРАММА ИНФОРМАТИЗАЦИИ ОБРАЗОВАТЕЛЬНОГО УЧЕРЕЖДЕНИЯ
 День защитника Отечества
 Создать плакат реклам кампании
  Общие требования и правила оформления текстов. Лексические средства научного произведения
 Мир психологии
 Торговый Дом Дианна-Юг
 Взаимодействие органов исполнительной власти региона и органов местного самоуправления в сфере образовательной политики
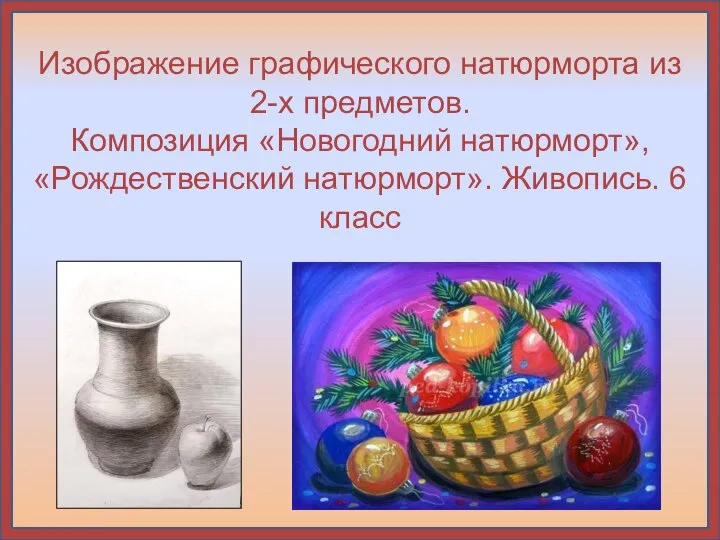 Новогодний натюрморт
 бойцовский клуб воин
 Растения, которые мы едим
 Что такое телеканал Успех? Это тематический канал платного ТВ с круглосуточным вещанием по всей России, странам СНГ и Балтии Наши з
 Внеклассная массовая работа как средство эстетического воспитания учащихся
 Презентация на тему История создания книги и библиотеки
 Культура России XVII века