- Describing Line Graphs

Содержание
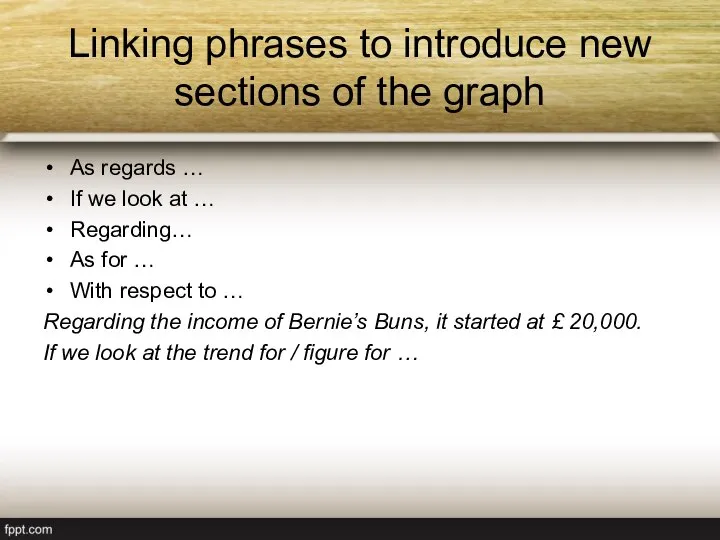
- 2. Linking phrases to introduce new sections of the graph As regards … If we look at
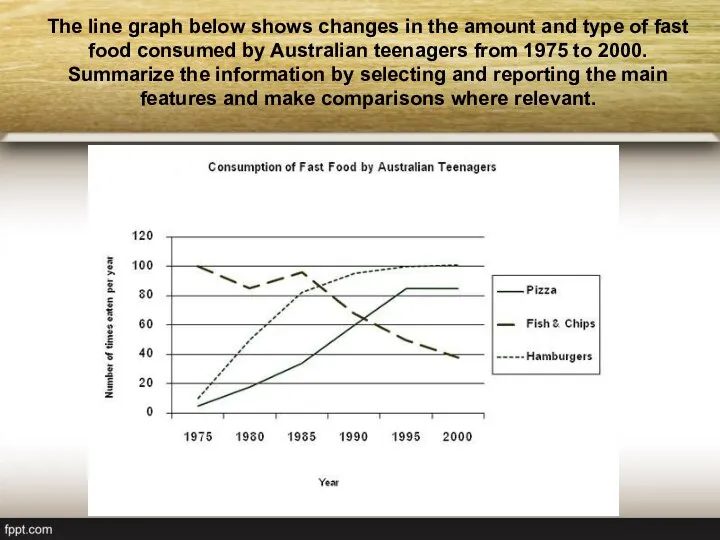
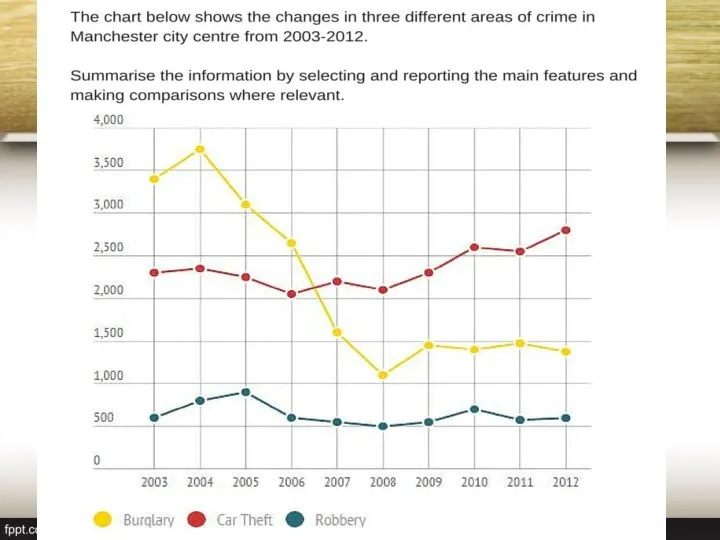
- 3. The line graph below shows changes in the amount and type of fast food consumed by
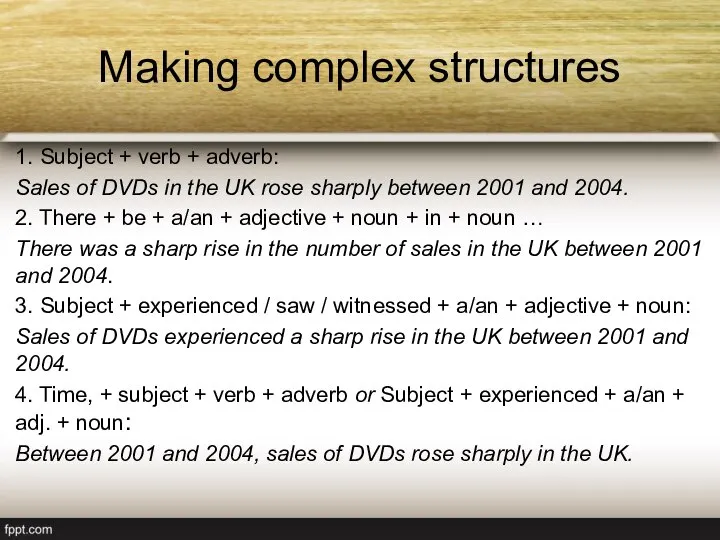
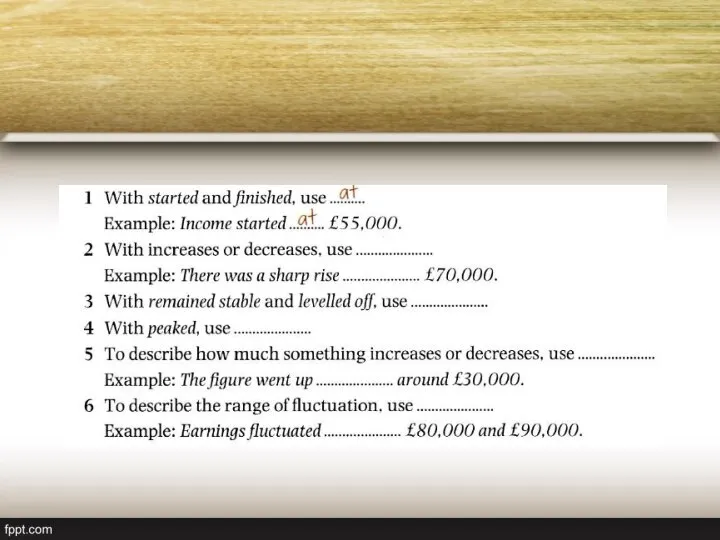
- 4. Making complex structures 1. Subject + verb + adverb: Sales of DVDs in the UK rose
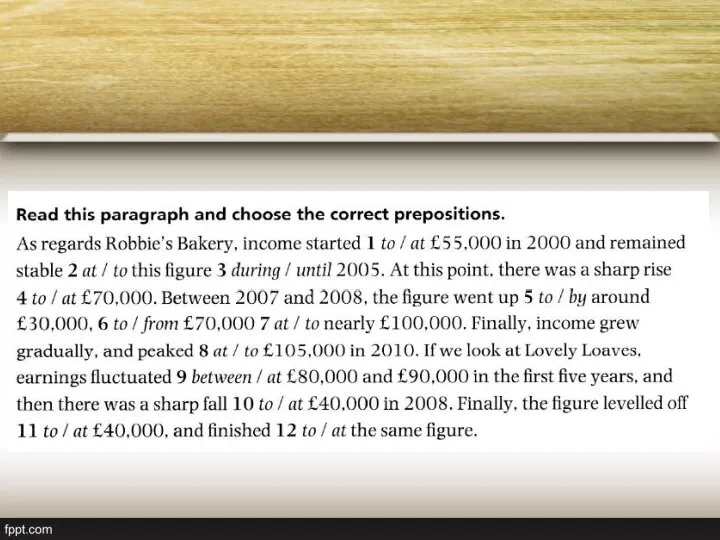
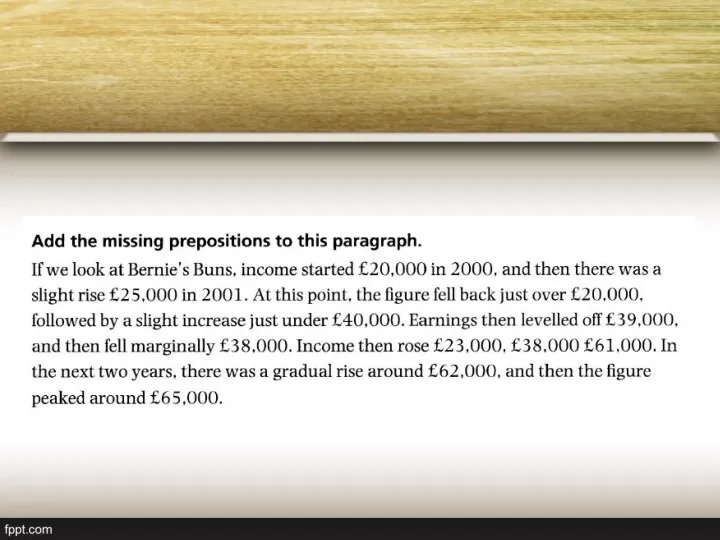
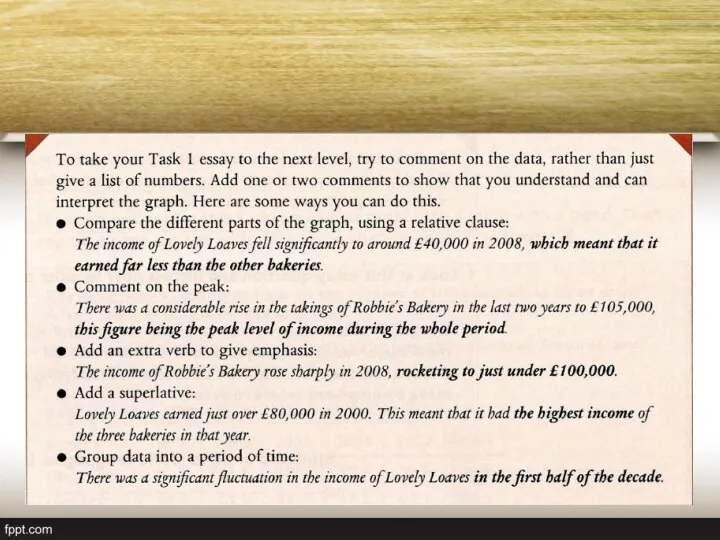
- 5. Practice Average income in Europe grew steadily between 1998 and 2004. The income of Robbie’s Bakery
- 6. The line graph below shows changes in the amount and type of fast food consumed by
- 7. Despite + noun / noun phrase / verb+ing Despite falling sharply to just above £40,000, the
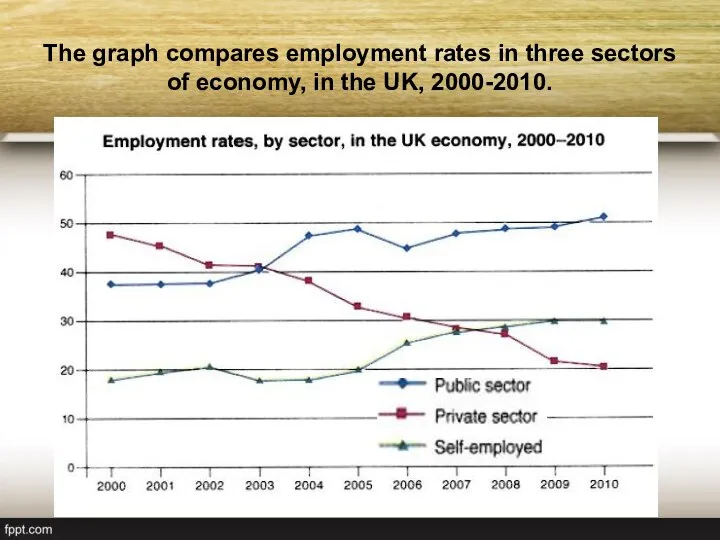
- 14. The graph compares employment rates in three sectors of economy, in the UK, 2000-2010.
- 16. Скачать презентацию
Слайд 3The line graph below shows changes in the amount and type of
The line graph below shows changes in the amount and type of
Слайд 4Making complex structures
1. Subject + verb + adverb:
Sales of DVDs in the
Making complex structures
1. Subject + verb + adverb:
Sales of DVDs in the
Слайд 5Practice
Average income in Europe grew steadily between 1998 and 2004.
The income
Practice
Average income in Europe grew steadily between 1998 and 2004.
The income
Слайд 6The line graph below shows changes in the amount and type of
The line graph below shows changes in the amount and type of

Слайд 7Despite + noun / noun phrase / verb+ing
Despite falling sharply to just
Despite + noun / noun phrase / verb+ing
Despite falling sharply to just

Слайд 14The graph compares employment rates in three sectors of economy, in the
The graph compares employment rates in three sectors of economy, in the
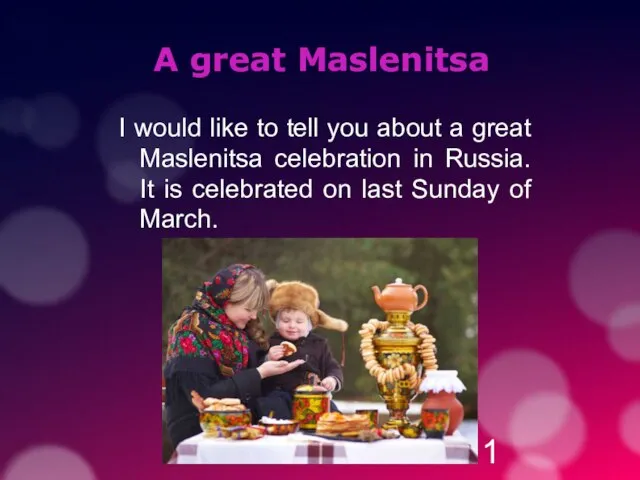 A great Maslenitsa
 Пазлы
Пазлы Письмо. Кулинария
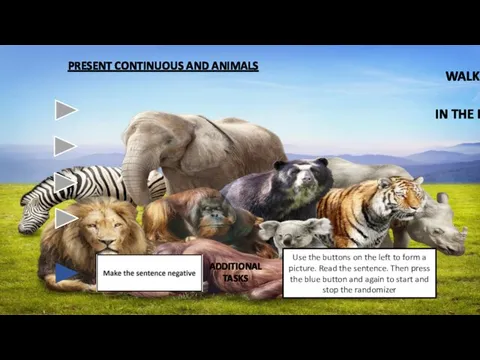 Present Continuous and Animals
 Frasel verbs
 Great Britain
 Видовременные формы английского глагола в действительном залоге
 Animals. What is This
 Dangerous in driving a car
 Whats the time 5
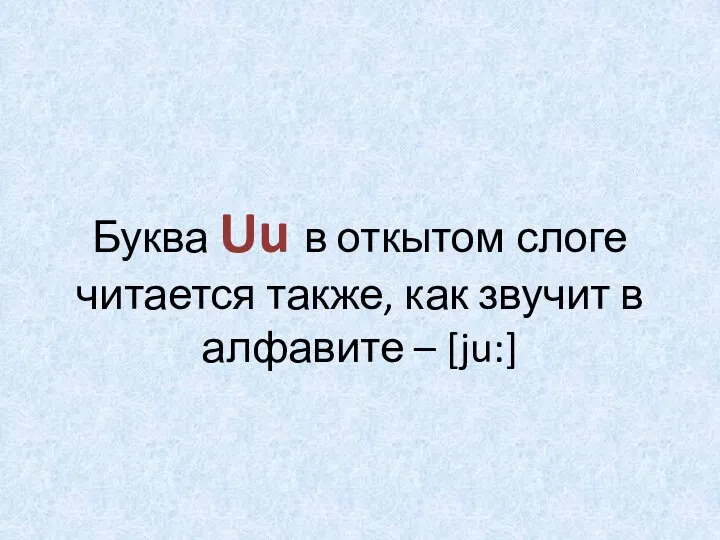 Буква Uu в откытом слоге
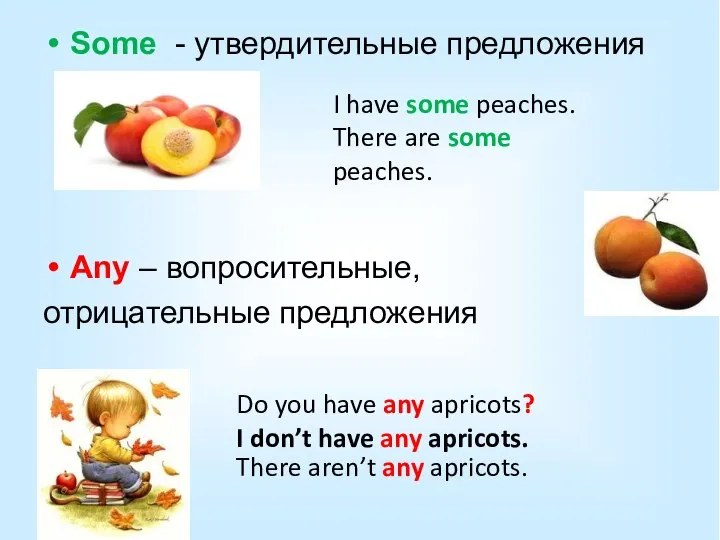 Some - any
 How to make an art portfolio for college or university (the ultimate guide)
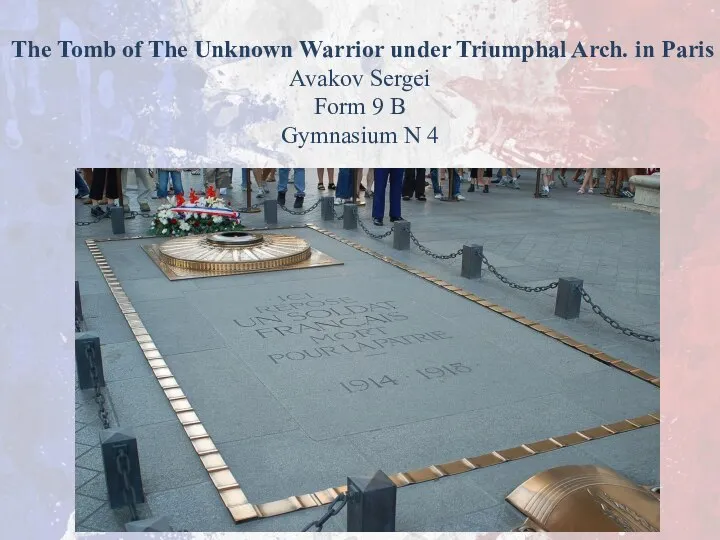 The Tomb of The Unknown Warrior under Triumphal Arch in Paris
 Check yourself
 What Kind of Mammal AM I
 Adjective antonyms
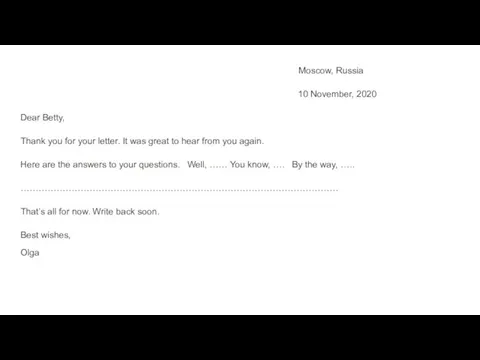 Write a letter
 Oil and gas industry in great Britain
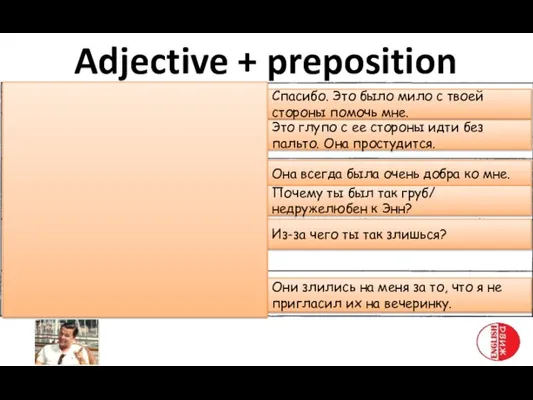 Прилагательное + предлог
 What season is it?
 Good times ahead
 Christmas cards
 My country as I see, I know, I perceive it
 Healthy eating
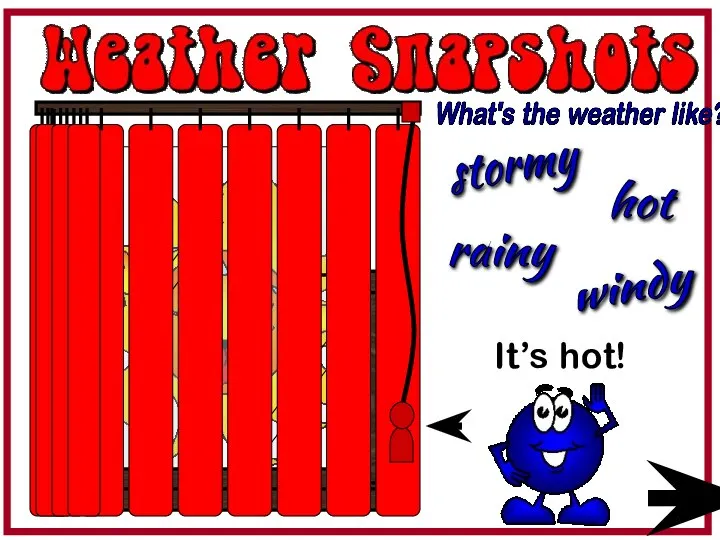 Weather
 Your future university
 The Simple Present and Simple Past Tense