- Computation of Large-Scale Genomic Evaluations

Содержание
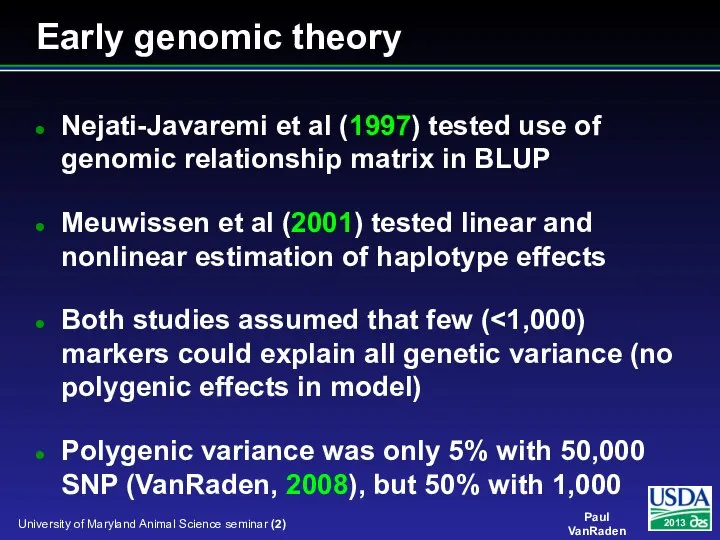
- 2. Early genomic theory Nejati-Javaremi et al (1997) tested use of genomic relationship matrix in BLUP Meuwissen
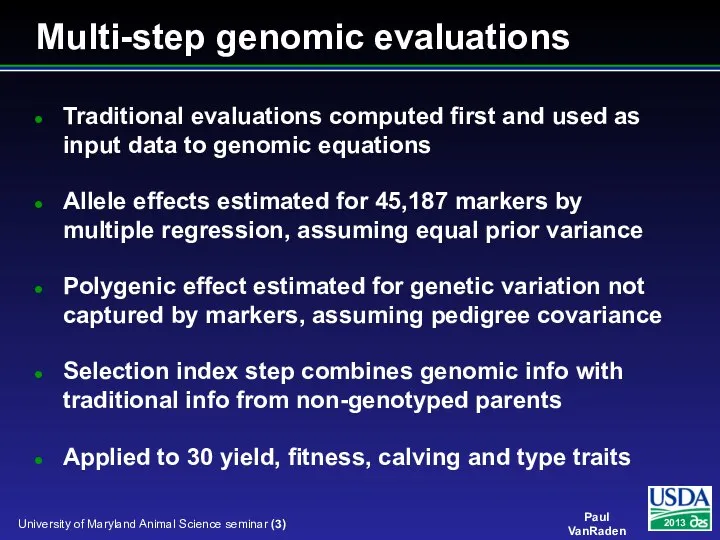
- 3. Multi-step genomic evaluations Traditional evaluations computed first and used as input data to genomic equations Allele
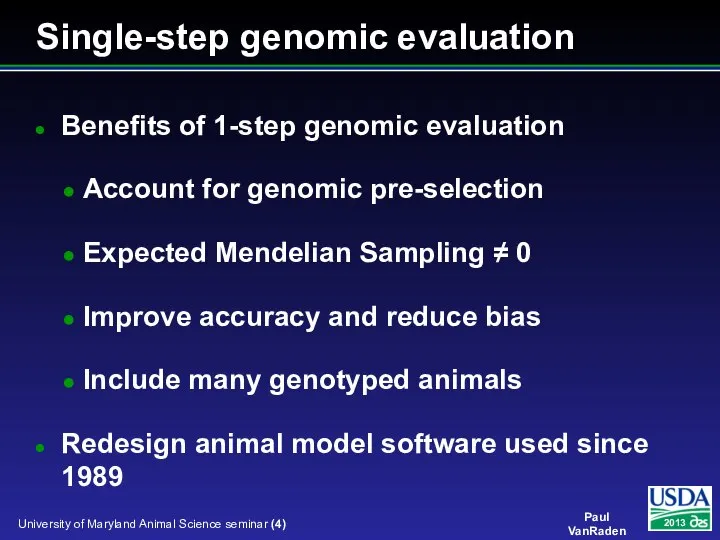
- 4. Benefits of 1-step genomic evaluation Account for genomic pre-selection Expected Mendelian Sampling ≠ 0 Improve accuracy
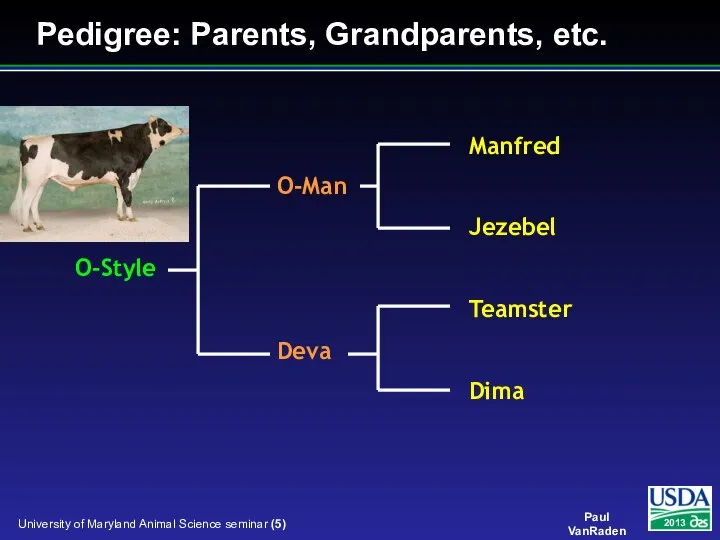
- 5. Pedigree: Parents, Grandparents, etc.
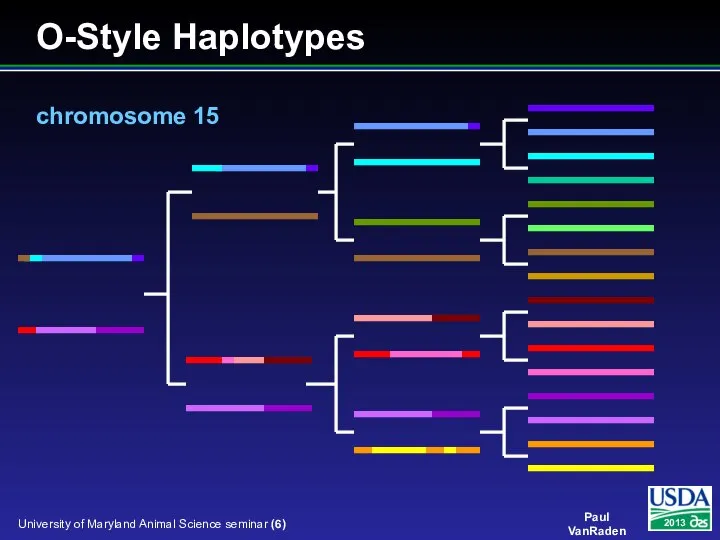
- 6. O-Style Haplotypes chromosome 15
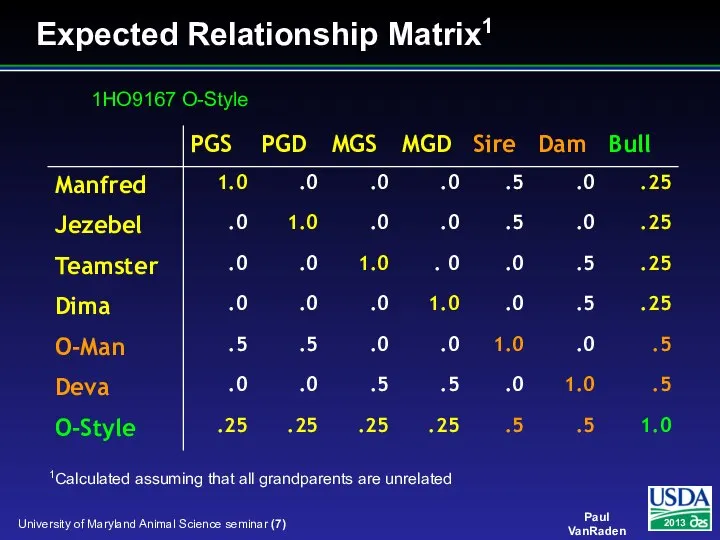
- 7. Expected Relationship Matrix1 1Calculated assuming that all grandparents are unrelated 1HO9167 O-Style
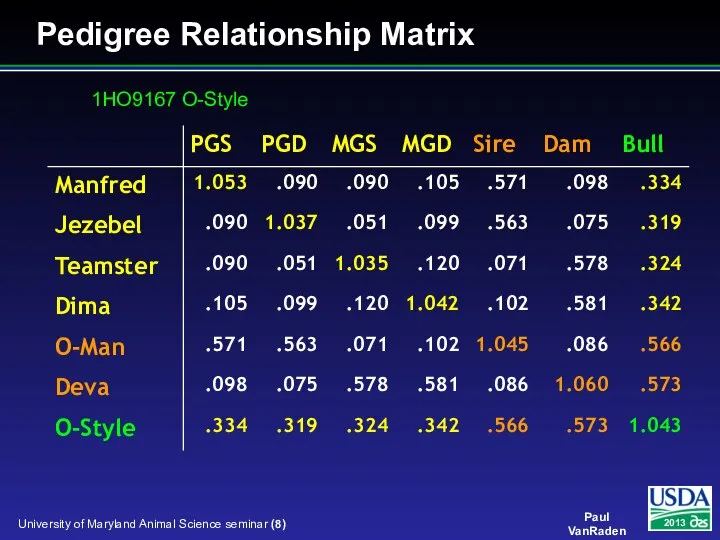
- 8. Pedigree Relationship Matrix 1HO9167 O-Style
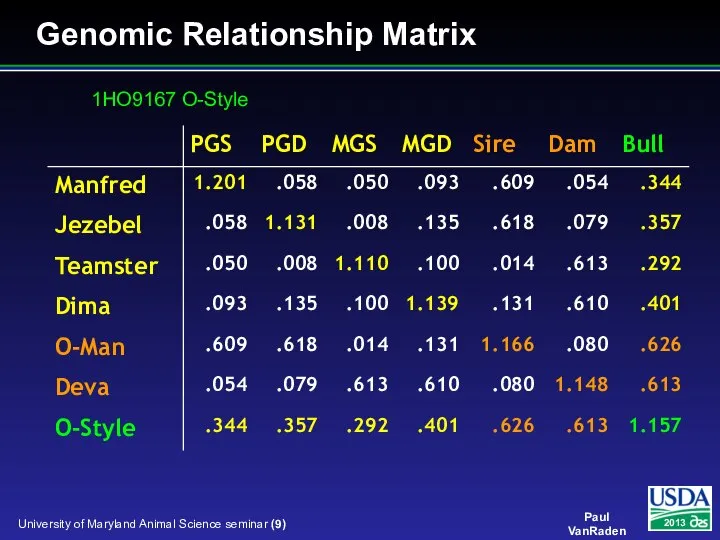
- 9. Genomic Relationship Matrix 1HO9167 O-Style
- 10. Difference (Genomic – Pedigree) 1HO9167 O-Style
- 11. Pseudocolor Plots ― O-Style
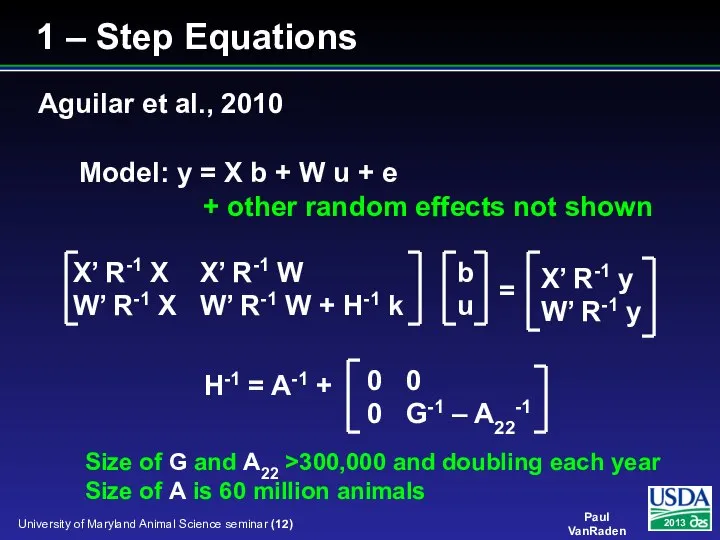
- 12. X’ R-1 X X’ R-1 W W’ R-1 X W’ R-1 W + H-1 k Model:
- 13. X’R-1X X’R-1W 0 0 W’R-1X W’R-1W+A-1k Q Q 0 Q’ -G/k 0 0 Q’ 0 A22/k
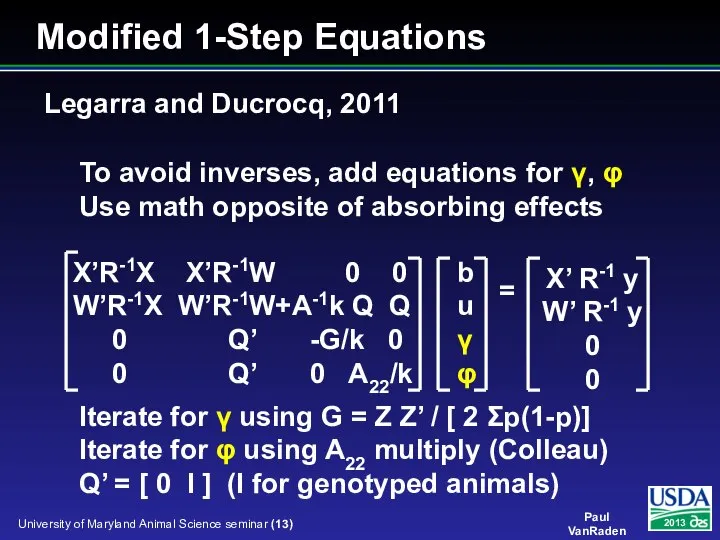
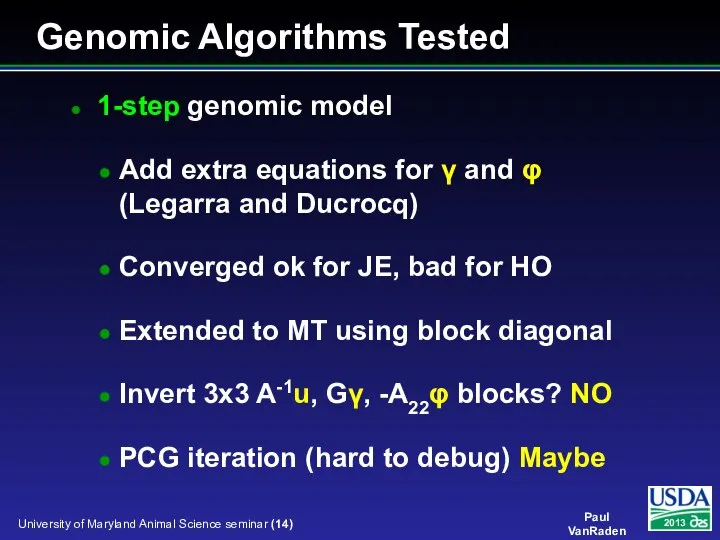
- 14. 1-step genomic model Add extra equations for γ and φ (Legarra and Ducrocq) Converged ok for
- 15. Multi-step insertion of GEBV [W’R-1W + A-1k] u = W’R-1y (without G) Previous studies added genomic
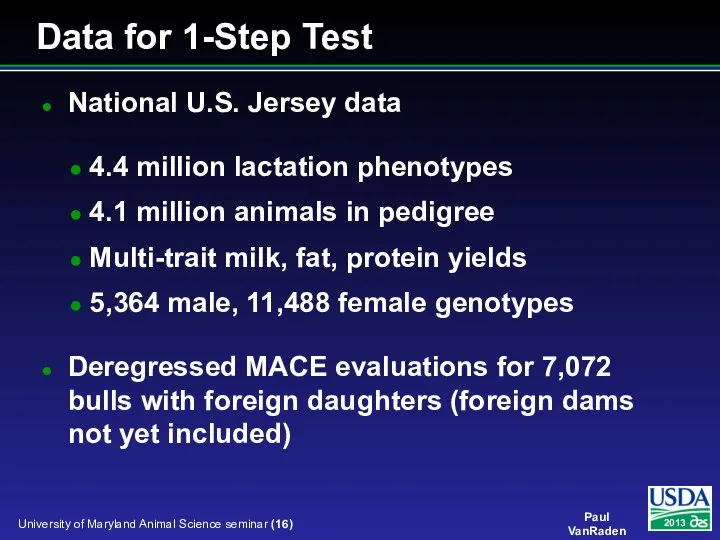
- 16. National U.S. Jersey data 4.4 million lactation phenotypes 4.1 million animals in pedigree Multi-trait milk, fat,
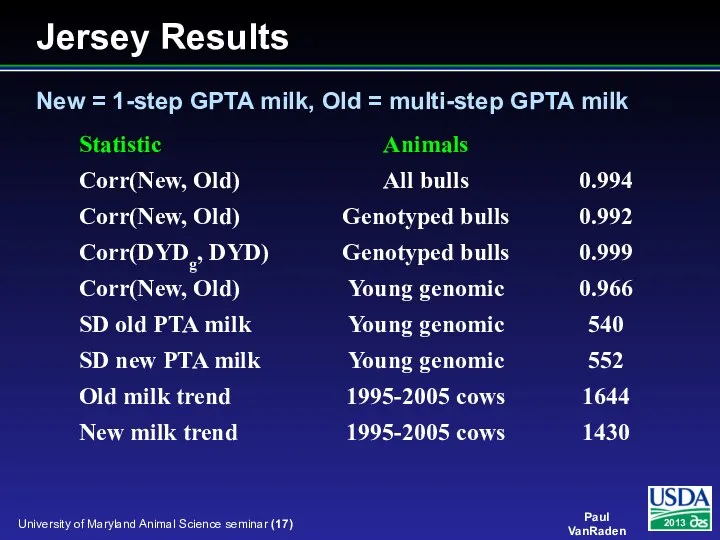
- 17. Jersey Results New = 1-step GPTA milk, Old = multi-step GPTA milk
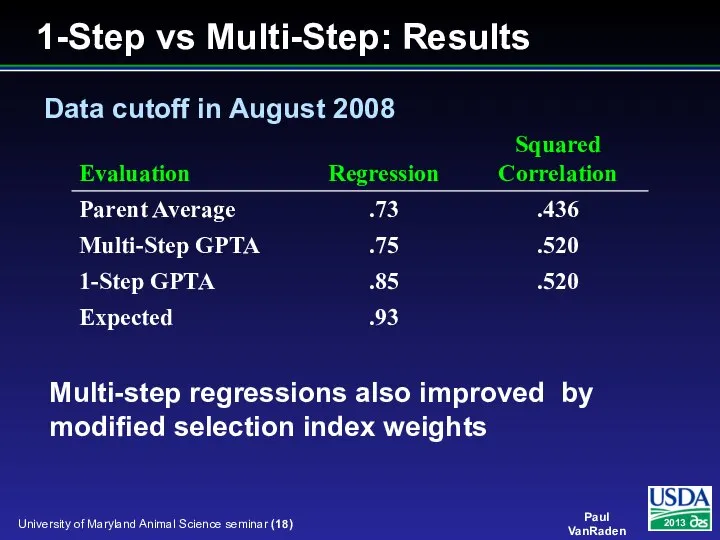
- 18. Multi-step regressions also improved by modified selection index weights Data cutoff in August 2008 1-Step vs
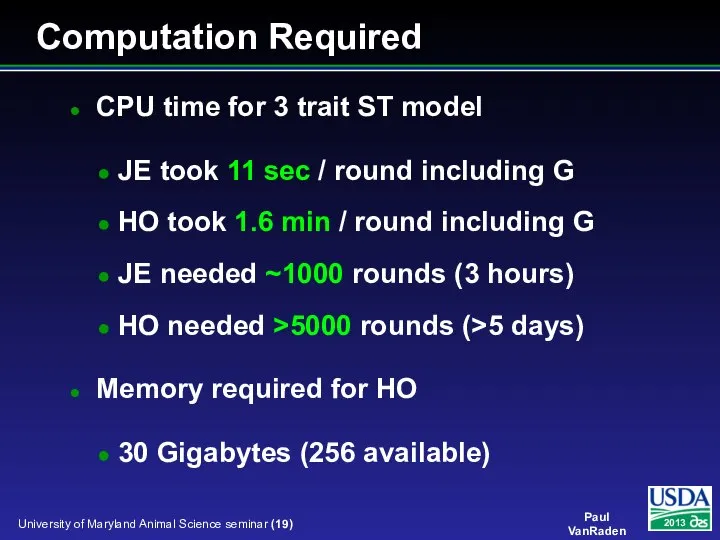
- 19. CPU time for 3 trait ST model JE took 11 sec / round including G HO
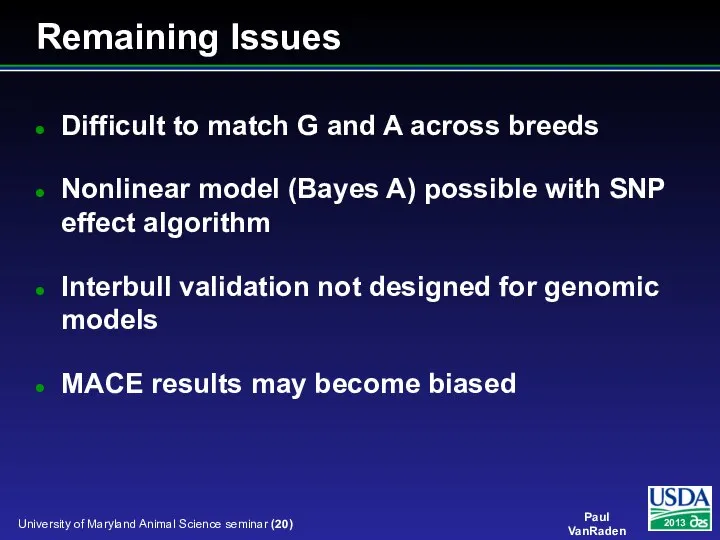
- 20. Difficult to match G and A across breeds Nonlinear model (Bayes A) possible with SNP effect
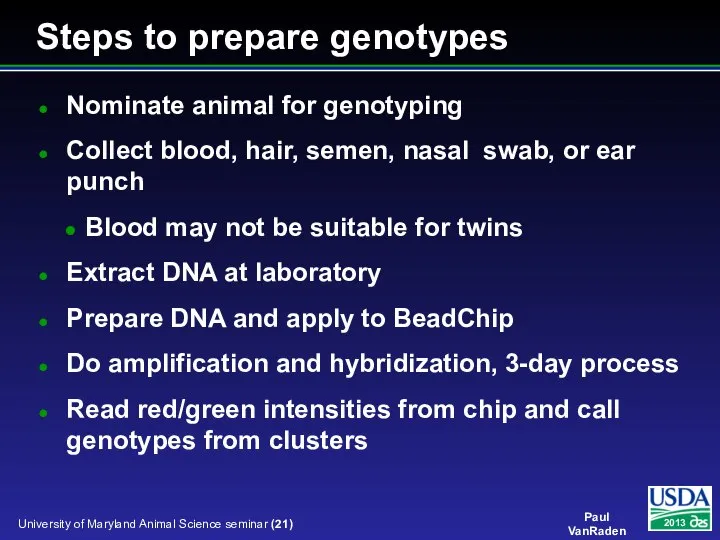
- 21. Steps to prepare genotypes Nominate animal for genotyping Collect blood, hair, semen, nasal swab, or ear
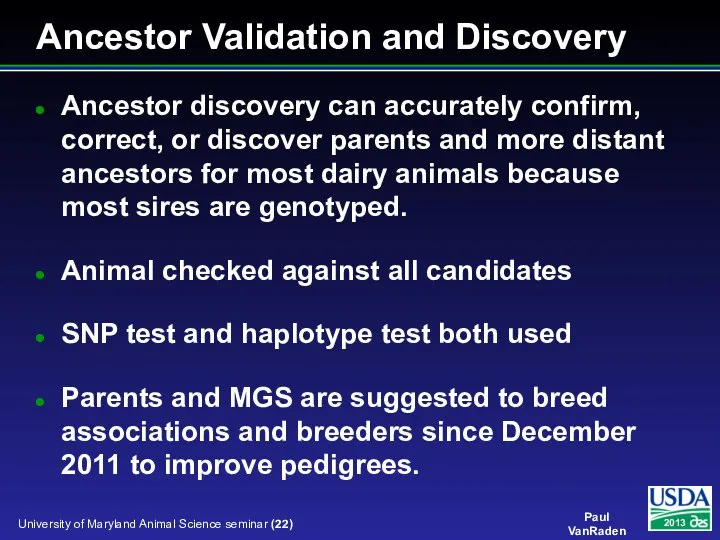
- 22. Ancestor Validation and Discovery Ancestor discovery can accurately confirm, correct, or discover parents and more distant
- 23. Ancestor Discovery Results by Breed *Confirmation = top MGS candidate matched true pedigree MGS. †50K genotyped
- 24. One step model includes: 72 million lactation phenotypes 50 million animals in pedigree 29 million permanent
- 25. Model options now include: Multi-trait models Multiple class and regress variables Suppress some factors / each
- 26. CPU for all-breed model (7 traits) ST: 4 min / round with 7 processors and ~1000
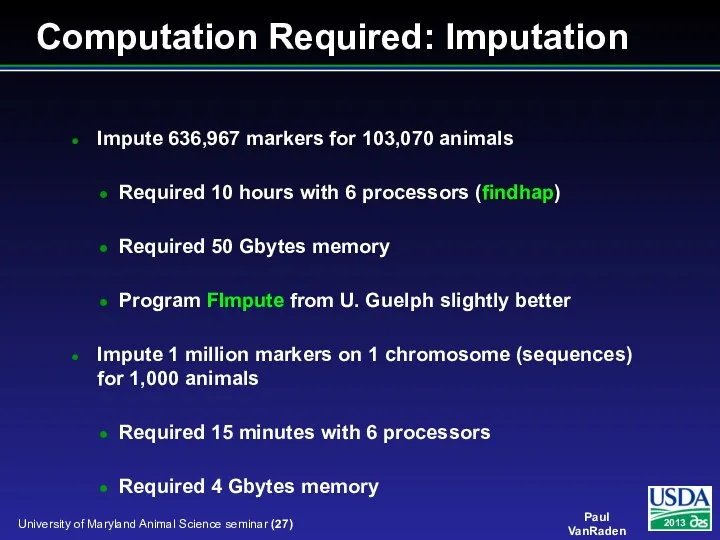
- 27. Impute 636,967 markers for 103,070 animals Required 10 hours with 6 processors (findhap) Required 50 Gbytes
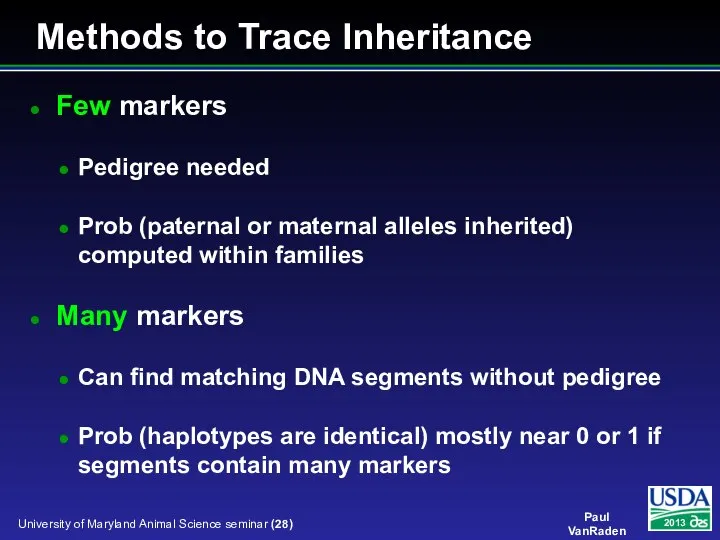
- 28. Methods to Trace Inheritance Few markers Pedigree needed Prob (paternal or maternal alleles inherited) computed within
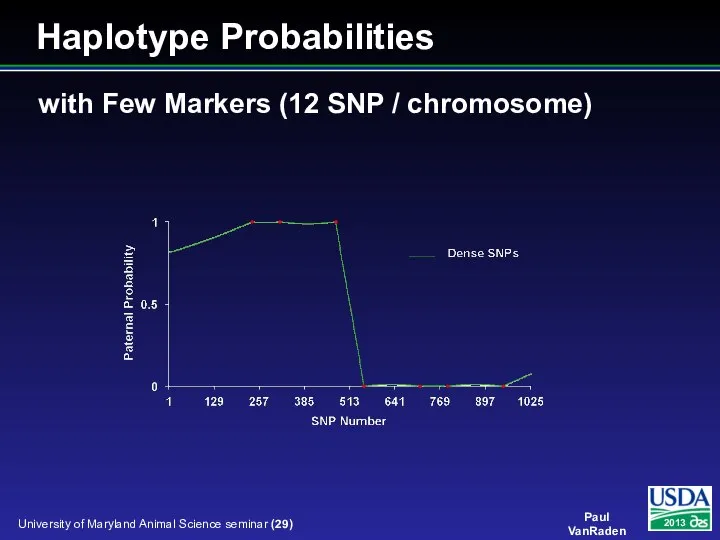
- 29. with Few Markers (12 SNP / chromosome) Haplotype Probabilities
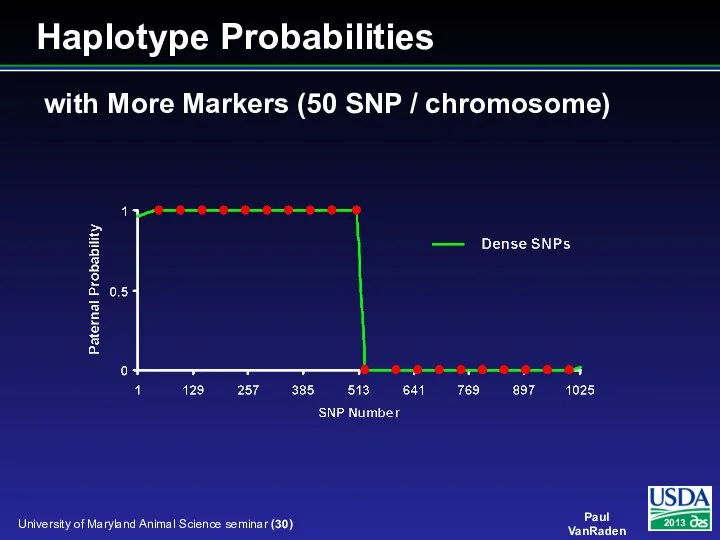
- 30. with More Markers (50 SNP / chromosome) Haplotype Probabilities
- 31. Haplotyping Program: findhap.f90 Population haplotyping Divide chromosomes into segments List haplotypes by genotype match Similar to
- 32. Coding of Alleles and Segments Genotypes 0 = BB, 1 = AB or BA, 2 =
- 33. Population Haplotyping Steps Put first genotype into haplotype list Check next genotype against list Do any
- 34. Check New Genotype Against List 1st segment of chromosome 15 5.16% 022222222020020022002020200020000200202000022022222202220 4.37% 022020220202200020022022200002200200200000200222200002202 4.36% 022020022202200200022020220000220202200002200222200202220
- 35. Net Merit by Chromosome Freddie - highest Net Merit bull
- 36. Net Merit by Chromosome O Man – Sire of Freddie
- 37. Net Merit by Chromosome Die-Hard - maternal grandsire
- 38. Net Merit by Chromosome Planet – high Net Merit bull
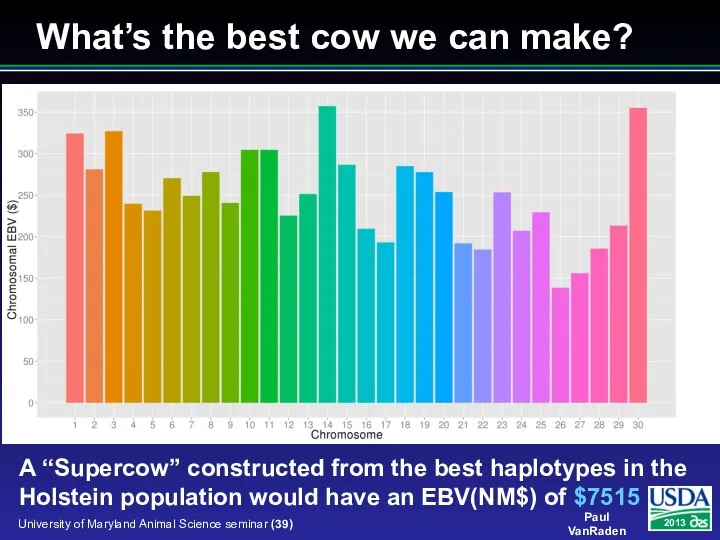
- 39. What’s the best cow we can make? A “Supercow” constructed from the best haplotypes in the
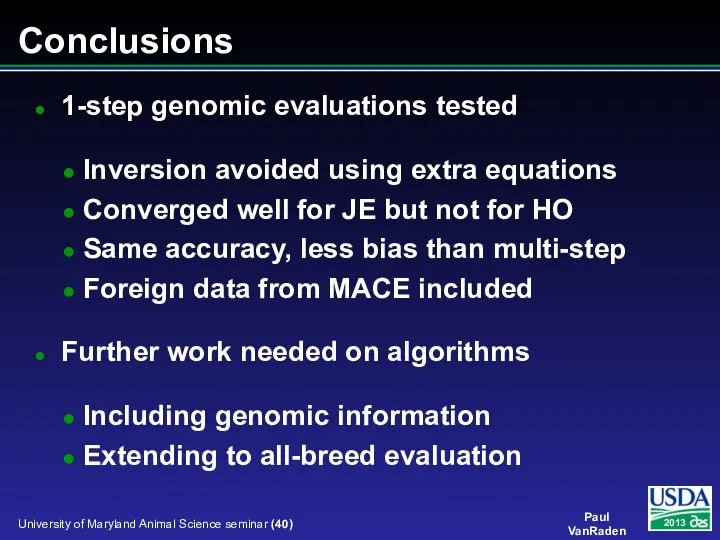
- 40. Conclusions 1-step genomic evaluations tested Inversion avoided using extra equations Converged well for JE but not
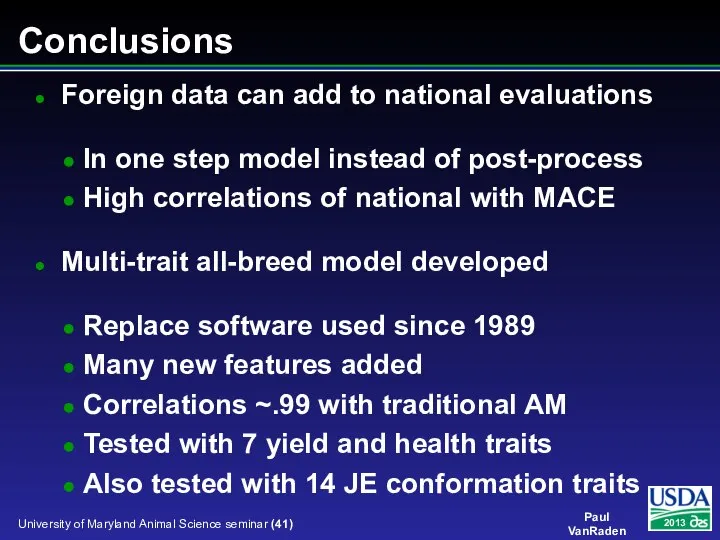
- 41. Conclusions Foreign data can add to national evaluations In one step model instead of post-process High
- 43. Скачать презентацию
Слайд 3Multi-step genomic evaluations
Traditional evaluations computed first and used as input data to
Multi-step genomic evaluations
Traditional evaluations computed first and used as input data to
Слайд 4Benefits of 1-step genomic evaluation
Account for genomic pre-selection
Expected Mendelian Sampling ≠ 0
Improve
Benefits of 1-step genomic evaluation
Account for genomic pre-selection
Expected Mendelian Sampling ≠ 0
Improve
Слайд 5Pedigree: Parents, Grandparents, etc.
Pedigree: Parents, Grandparents, etc.
Слайд 6O-Style Haplotypes
chromosome 15
O-Style Haplotypes
chromosome 15
Слайд 7Expected Relationship Matrix1
1Calculated assuming that all grandparents are unrelated
1HO9167 O-Style
Expected Relationship Matrix1
1Calculated assuming that all grandparents are unrelated
1HO9167 O-Style
Слайд 8Pedigree Relationship Matrix
1HO9167 O-Style
Pedigree Relationship Matrix
1HO9167 O-Style
Слайд 9Genomic Relationship Matrix
1HO9167 O-Style
Genomic Relationship Matrix
1HO9167 O-Style
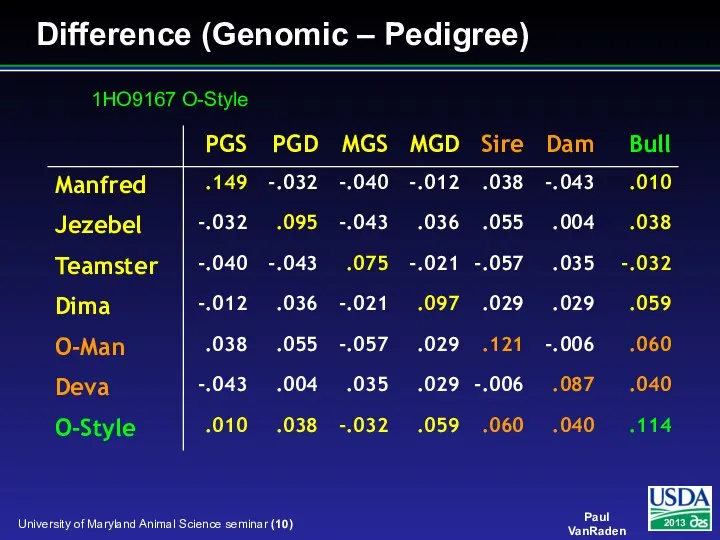
Слайд 10Difference (Genomic – Pedigree)
1HO9167 O-Style
Difference (Genomic – Pedigree)
1HO9167 O-Style
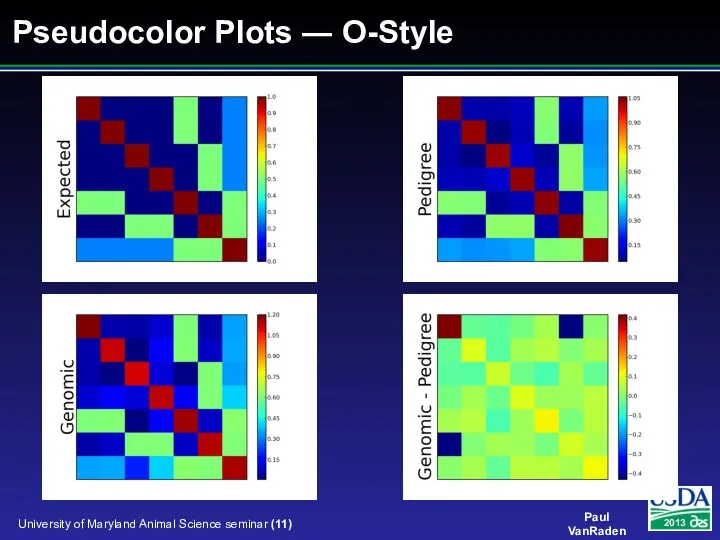
Слайд 11Pseudocolor Plots ― O-Style
Pseudocolor Plots ― O-Style
Слайд 12X’ R-1 X X’ R-1 W
W’ R-1 X W’ R-1 W +
X’ R-1 X X’ R-1 W
W’ R-1 X W’ R-1 W +
Слайд 13X’R-1X X’R-1W 0 0
W’R-1X W’R-1W+A-1k Q Q
0 Q’ -G/k 0
0
X’R-1X X’R-1W 0 0
W’R-1X W’R-1W+A-1k Q Q
0 Q’ -G/k 0
0
Слайд 141-step genomic model
Add extra equations for γ and φ (Legarra and Ducrocq)
1-step genomic model
Add extra equations for γ and φ (Legarra and Ducrocq)
Слайд 15Multi-step insertion of GEBV
[W’R-1W + A-1k] u = W’R-1y (without G)
Previous studies
Multi-step insertion of GEBV
[W’R-1W + A-1k] u = W’R-1y (without G)
Previous studies
![Multi-step insertion of GEBV [W’R-1W + A-1k] u = W’R-1y (without G)](/_ipx/f_webp&q_80&fit_contain&s_1440x1080/imagesDir/jpg/1140365/slide-14.jpg)
Слайд 16National U.S. Jersey data
4.4 million lactation phenotypes
4.1 million animals in pedigree
Multi-trait
National U.S. Jersey data
4.4 million lactation phenotypes
4.1 million animals in pedigree
Multi-trait
Слайд 17Jersey Results
New = 1-step GPTA milk, Old = multi-step GPTA milk
Jersey Results
New = 1-step GPTA milk, Old = multi-step GPTA milk
Слайд 18Multi-step regressions also improved by modified selection index weights
Data cutoff in August
Multi-step regressions also improved by modified selection index weights
Data cutoff in August
Слайд 19CPU time for 3 trait ST model
JE took 11 sec / round
CPU time for 3 trait ST model
JE took 11 sec / round
Слайд 20Difficult to match G and A across breeds
Nonlinear model (Bayes A) possible
Difficult to match G and A across breeds
Nonlinear model (Bayes A) possible
Слайд 21Steps to prepare genotypes
Nominate animal for genotyping
Collect blood, hair, semen, nasal
Steps to prepare genotypes
Nominate animal for genotyping
Collect blood, hair, semen, nasal
Слайд 22Ancestor Validation and Discovery
Ancestor discovery can accurately confirm, correct, or discover parents
Ancestor Validation and Discovery
Ancestor discovery can accurately confirm, correct, or discover parents
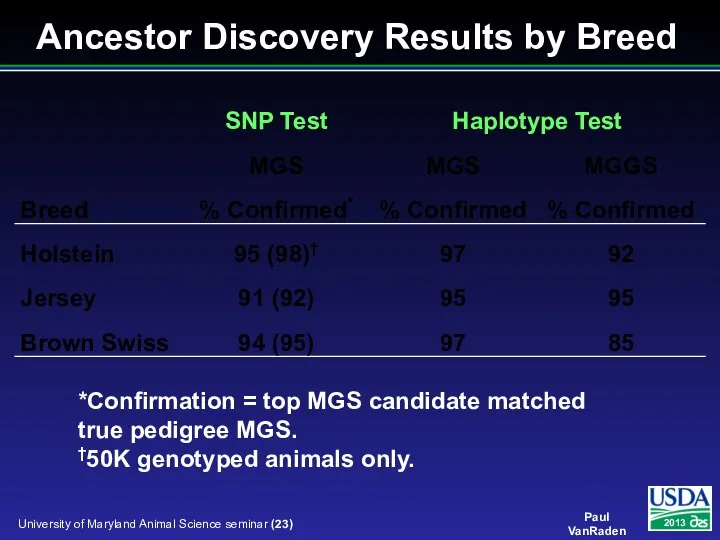
Слайд 23Ancestor Discovery Results by Breed
*Confirmation = top MGS candidate matched true pedigree
Ancestor Discovery Results by Breed
*Confirmation = top MGS candidate matched true pedigree
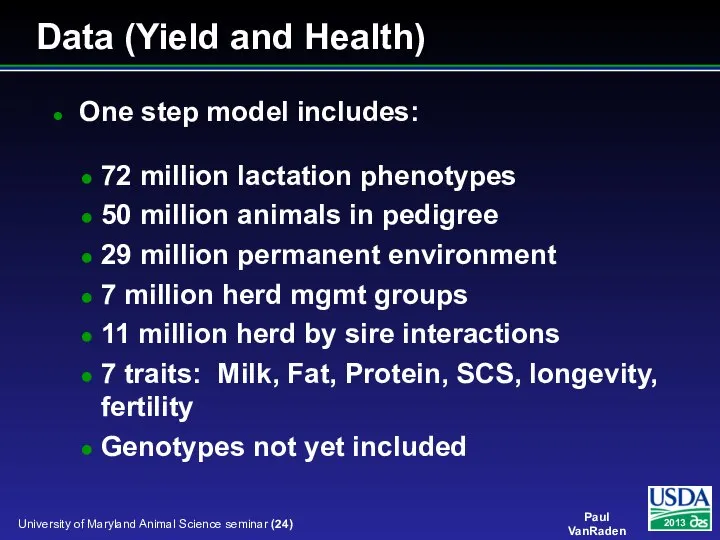
Слайд 24One step model includes:
72 million lactation phenotypes
50 million animals in pedigree
29 million
One step model includes:
72 million lactation phenotypes
50 million animals in pedigree
29 million
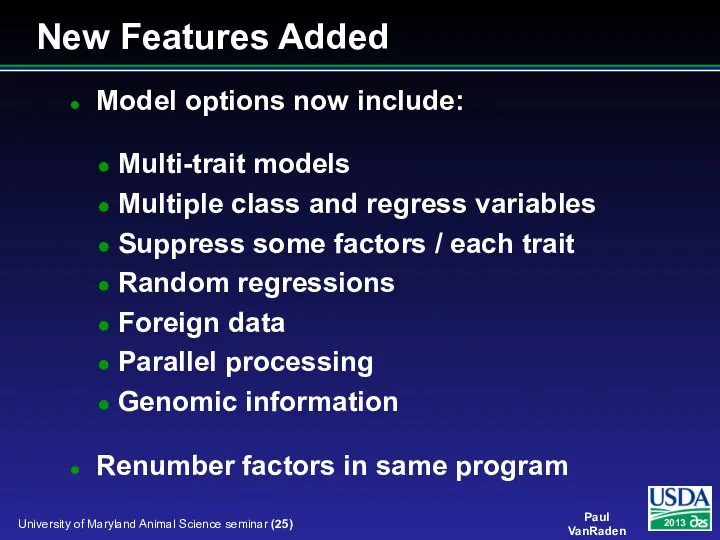
Слайд 25Model options now include:
Multi-trait models
Multiple class and regress variables
Suppress some factors /
Model options now include:
Multi-trait models
Multiple class and regress variables
Suppress some factors /
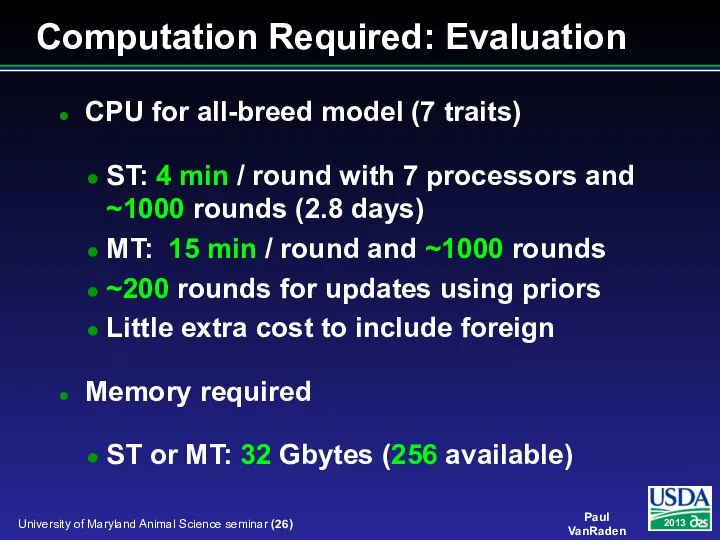
Слайд 26CPU for all-breed model (7 traits)
ST: 4 min / round with 7
CPU for all-breed model (7 traits)
ST: 4 min / round with 7
Слайд 27Impute 636,967 markers for 103,070 animals
Required 10 hours with 6 processors (findhap)
Required
Impute 636,967 markers for 103,070 animals
Required 10 hours with 6 processors (findhap)
Required
Слайд 28Methods to Trace Inheritance
Few markers
Pedigree needed
Prob (paternal or maternal alleles inherited) computed
Methods to Trace Inheritance
Few markers
Pedigree needed
Prob (paternal or maternal alleles inherited) computed
Слайд 29with Few Markers (12 SNP / chromosome)
Haplotype Probabilities
with Few Markers (12 SNP / chromosome)
Haplotype Probabilities
Слайд 30with More Markers (50 SNP / chromosome)
Haplotype Probabilities
with More Markers (50 SNP / chromosome)
Haplotype Probabilities
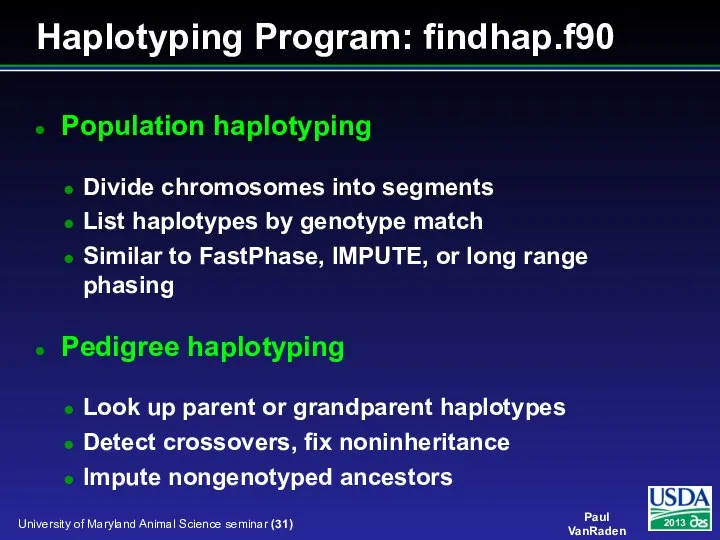
Слайд 31Haplotyping Program: findhap.f90
Population haplotyping
Divide chromosomes into segments
List haplotypes by genotype match
Similar to
Haplotyping Program: findhap.f90
Population haplotyping
Divide chromosomes into segments
List haplotypes by genotype match
Similar to
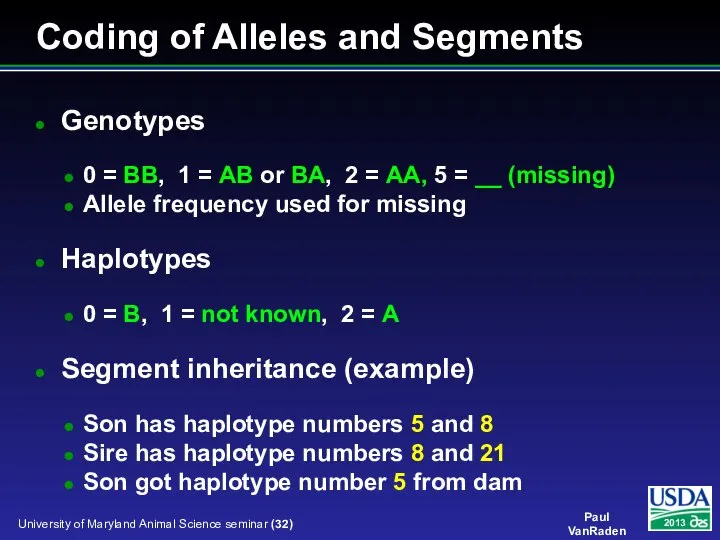
Слайд 32Coding of Alleles and Segments
Genotypes
0 = BB, 1 = AB or BA,
Coding of Alleles and Segments
Genotypes
0 = BB, 1 = AB or BA,
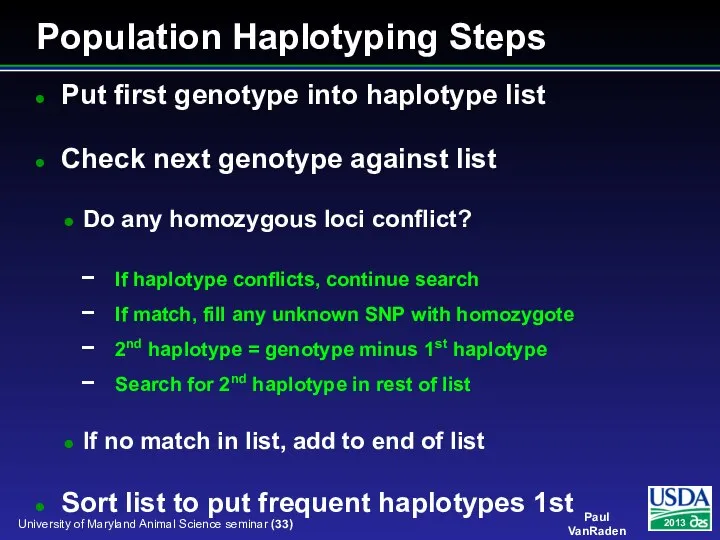
Слайд 33Population Haplotyping Steps
Put first genotype into haplotype list
Check next genotype against list
Do
Population Haplotyping Steps
Put first genotype into haplotype list
Check next genotype against list
Do
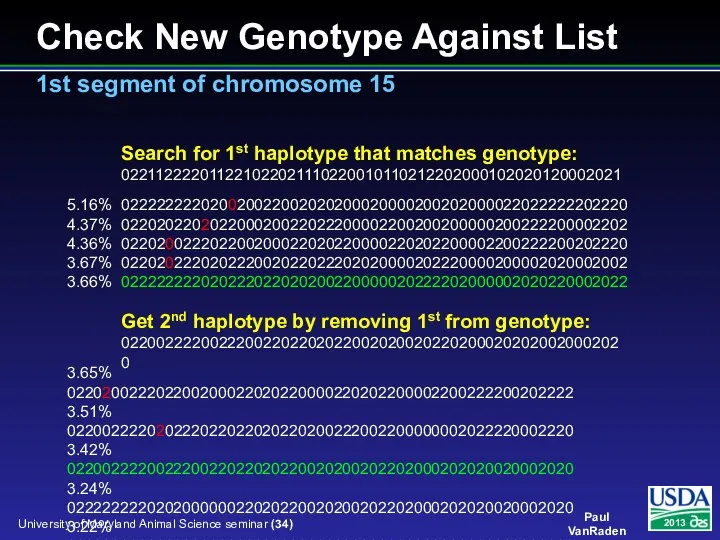
Слайд 34Check New Genotype Against List
1st segment of chromosome 15
5.16% 022222222020020022002020200020000200202000022022222202220
4.37% 022020220202200020022022200002200200200000200222200002202
4.36%
Check New Genotype Against List
1st segment of chromosome 15
5.16% 022222222020020022002020200020000200202000022022222202220
4.37% 022020220202200020022022200002200200200000200222200002202
4.36%
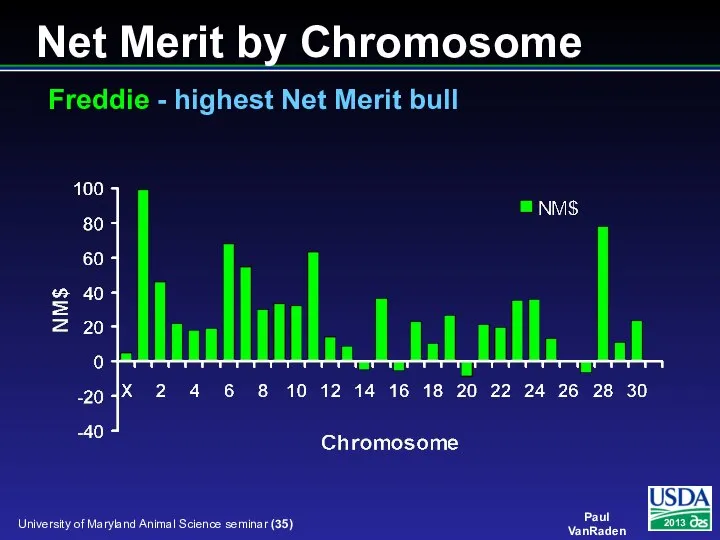
Слайд 35Net Merit by Chromosome
Freddie - highest Net Merit bull
Net Merit by Chromosome
Freddie - highest Net Merit bull
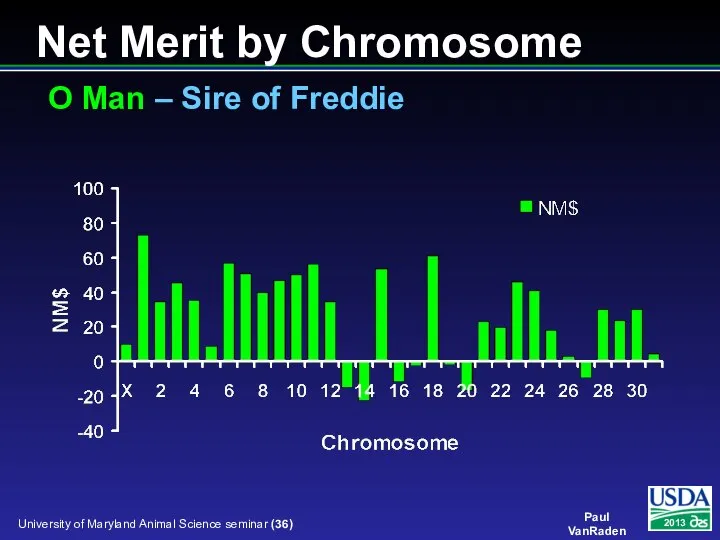
Слайд 36Net Merit by Chromosome
O Man – Sire of Freddie
Net Merit by Chromosome
O Man – Sire of Freddie
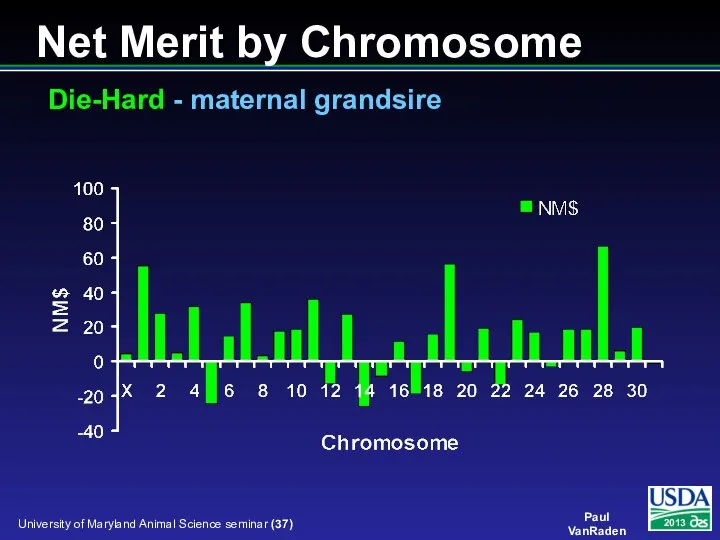
Слайд 37Net Merit by Chromosome
Die-Hard - maternal grandsire
Net Merit by Chromosome
Die-Hard - maternal grandsire
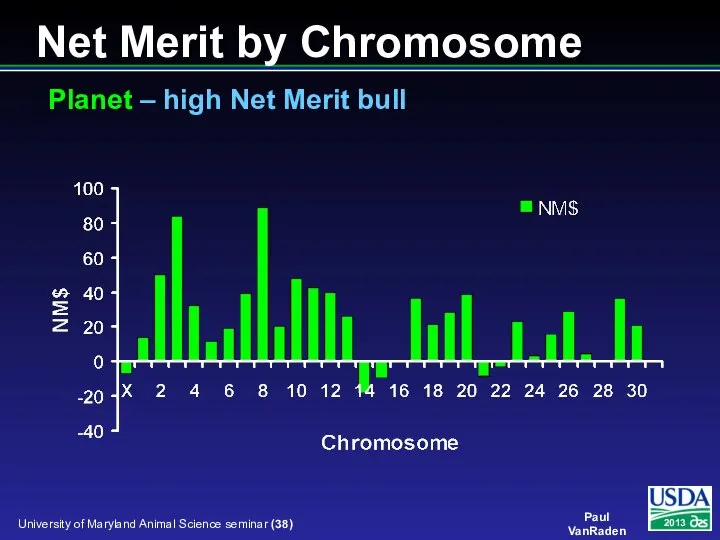
Слайд 38Net Merit by Chromosome
Planet – high Net Merit bull
Net Merit by Chromosome
Planet – high Net Merit bull
Слайд 39What’s the best cow we can make?
A “Supercow” constructed from the best
What’s the best cow we can make?
A “Supercow” constructed from the best
Слайд 40Conclusions
1-step genomic evaluations tested
Inversion avoided using extra equations
Converged well for JE but
Conclusions
1-step genomic evaluations tested
Inversion avoided using extra equations
Converged well for JE but
Слайд 41Conclusions
Foreign data can add to national evaluations
In one step model instead of
Conclusions
Foreign data can add to national evaluations
In one step model instead of
 Пернатые друзья
 Типы питания живых организмов. 6 класс
 Вегетативная нервная система
 Размножение и развитие организмов
 Сцепленное наследование генов. ЕГЭ по биологии, 28 задача
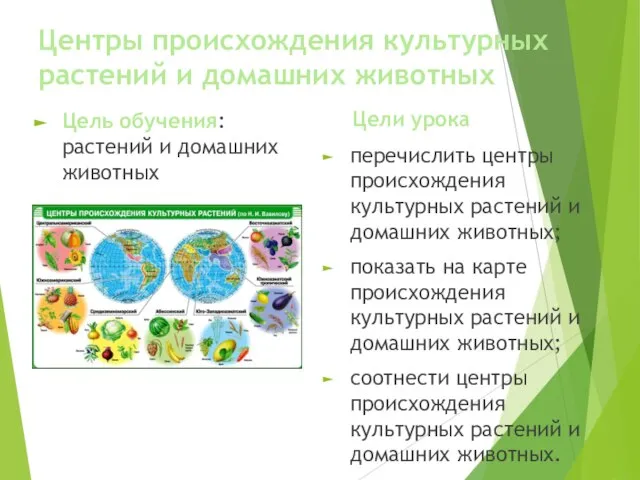 Центры происхождения культурных растений и домашних животных
 Размножение. Уровни размножения
 Как зимой помочь птицам
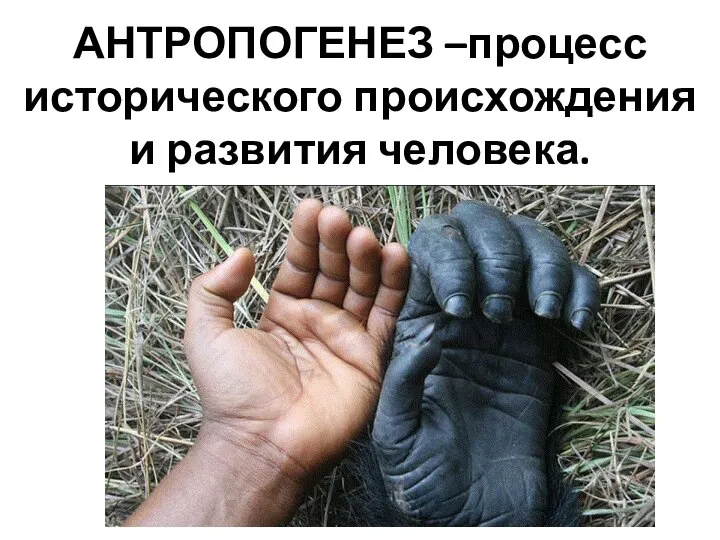 Происхождение человека, антропогенез
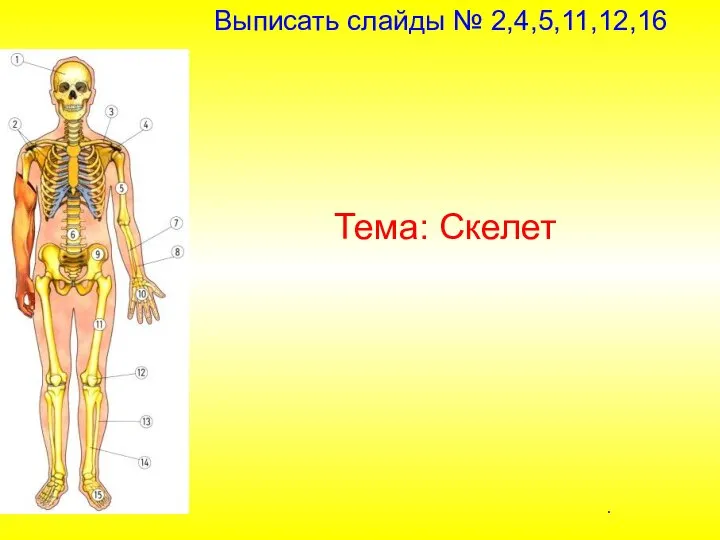 Скелет
 состав и строение белков
 Птицы. Специализация
 Презентация на тему СИМБИОЗ
  Строение тела человека
 Отбор и его значение в селекции и семеноводстве
 Самый-самый
 Гидропоника в мире
 Презентация на тему Размножение земноводных
  Возрастная физиология
 Только самое главное и важное для подготовке к ЕГЭ по биологии
 Самые необычные животные планеты: ангорский кролик
 Опорно-двигательная система. Скелет человека
 Картирование хромосом
 Заповідники. Ботанічні сади
 Мариукультура. Культивирование тихоокеанских устриц
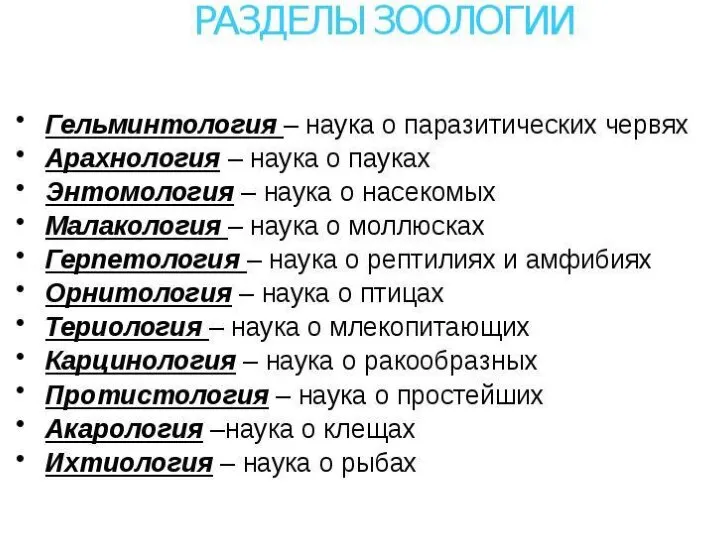 Разделы зоологии
 Физиология спорта. Особенности физиологии младших школьников
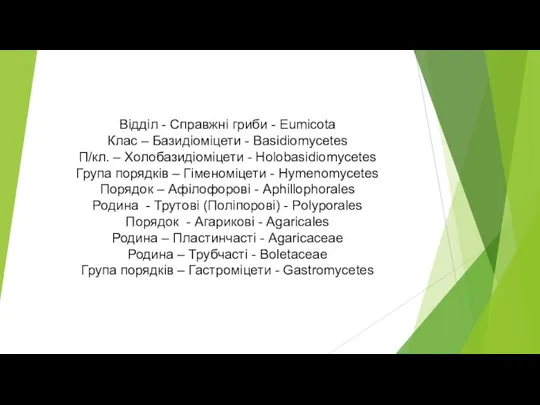 пр. р. 6 базид