- Представление числовой информации и графиков

Содержание
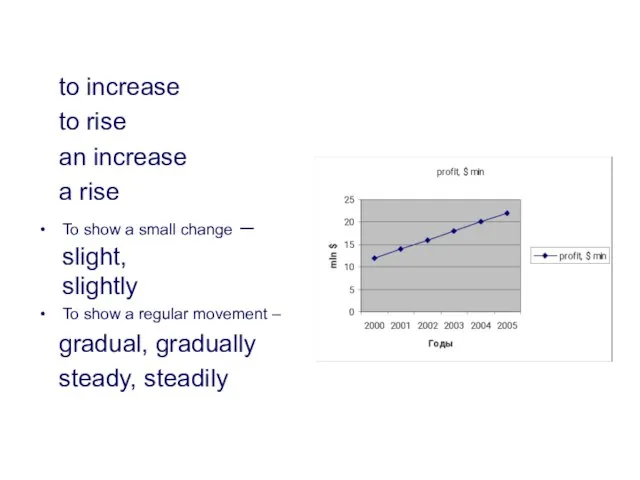
- 2. to increase to rise an increase a rise To show a small change – slight, slightly
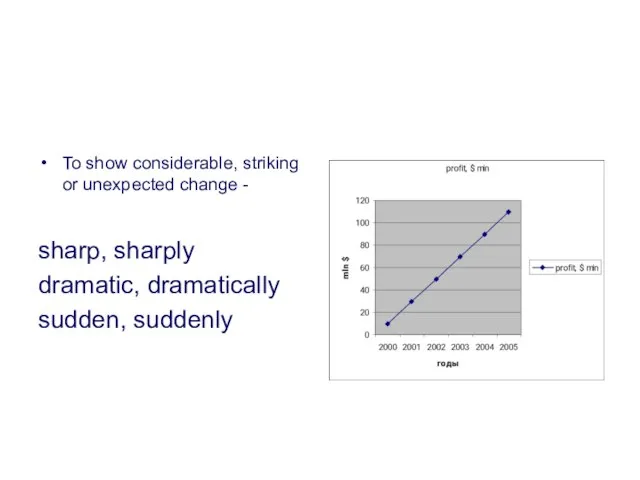
- 3. To show considerable, striking or unexpected change - sharp, sharply dramatic, dramatically sudden, suddenly
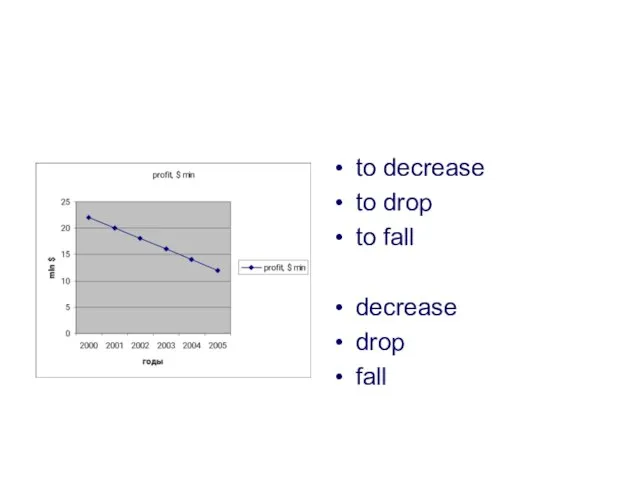
- 4. to decrease to drop to fall decrease drop fall
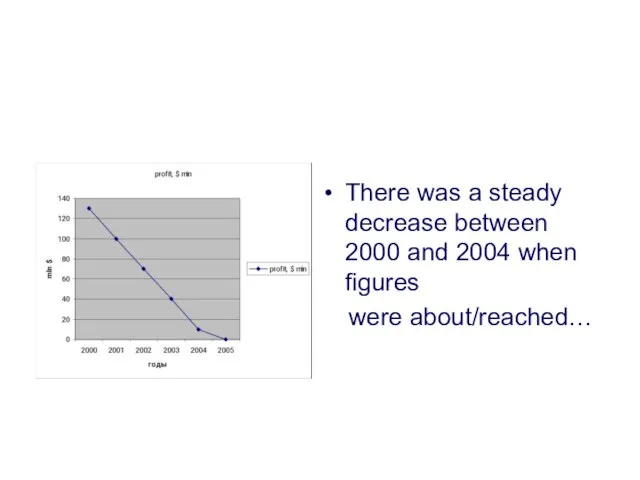
- 5. There was a steady decrease between 2000 and 2004 when figures were about/reached…
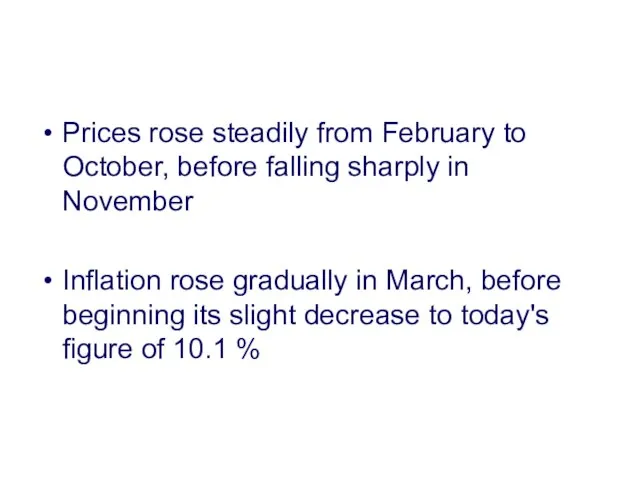
- 6. Prices rose steadily from February to October, before falling sharply in November Inflation rose gradually in
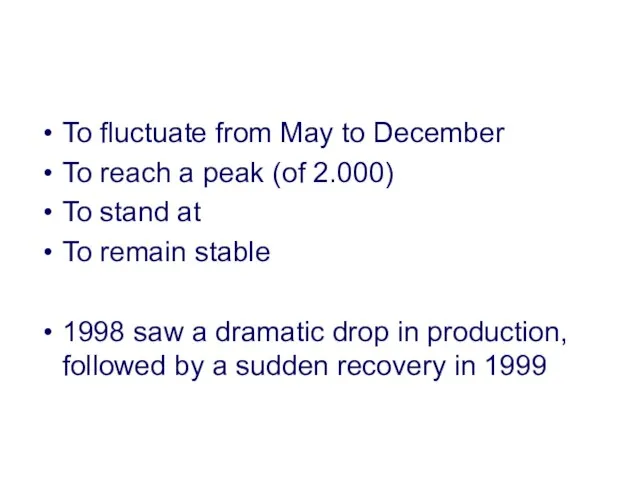
- 7. To fluctuate from May to December To reach a peak (of 2.000) To stand at To
- 9. Скачать презентацию
Слайд 3To show considerable, striking or unexpected change -
sharp, sharply
dramatic, dramatically
sudden, suddenly
To show considerable, striking or unexpected change -
sharp, sharply
dramatic, dramatically
sudden, suddenly
Слайд 4to decrease
to drop
to fall
decrease
drop
fall
to decrease
to drop
to fall
decrease
drop
fall
Слайд 5There was a steady decrease between 2000 and 2004 when figures
There was a steady decrease between 2000 and 2004 when figures
Слайд 6Prices rose steadily from February to October, before falling sharply in November
Inflation
Prices rose steadily from February to October, before falling sharply in November
Inflation
Слайд 7To fluctuate from May to December
To reach a peak (of 2.000)
To stand
To fluctuate from May to December
To reach a peak (of 2.000)
To stand
 Путевой лист. Роль документа, образец заполнения
 Домашнее насилие над детьми
 Правила поведения в школе
 Содержаниеи классификация затрат. Тема 2
 Инжиниринг для сотрудников
 Создание сложной формы предмета с последующим декорированием Печатный пряник, Жаворонок
 Пакетные предложения воркшоп
 «Детям это интересно»
 Устройство и установка иглы
 Презентация на тему Ушибы головы, сотрясения головного мозга, травматический шок, сердечная недостаточность
 Презентация на тему Техника безопасности на уроках физкультуры
 Українські, російські, білоруські, грузинські народні костюми
 Современные оздоровительные системы физической культуры
 Формы государства
 Презентация на тему История географической карты
 Телевидения в современной жизни
 Цель конференции Поиск одаренных обучающихся, развитие творческих способностей и познавательного интереса, расширение кругозора
 Русская народная вышивка
 Презентация на тему Экология села
 Методические указания составлены в соответствии с государственным образовательным стандартом высшего профессионального образо
 Презентация на тему Факторы определяющие климат России
 Использование системы Avalanche LITE для ведения новостного раздела сайта Trubka.ru
 Паустовский «Корзина с еловыми шишками» 4 класс
 Kunst in meinem Leben
 Что такое эмблемы?
 Презентация на тему Сталинградская битва (4 класса)
 Презентация на тему Заповедные места Республики Башкортостан
 проект