- IELTS Writing. Task 1. Overview

Содержание
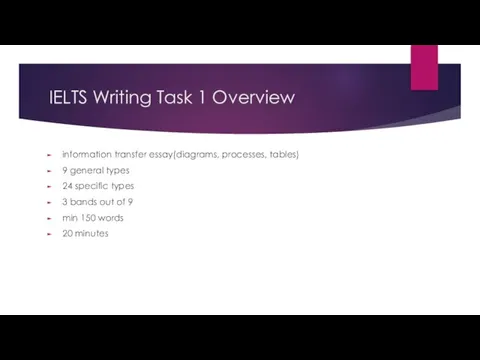
- 2. IELTS Writing Task 1 Overview information transfer essay(diagrams, processes, tables) 9 general types 24 specific types
- 3. Common structure for Task 1 Introduction Overview Body 1 Body 2
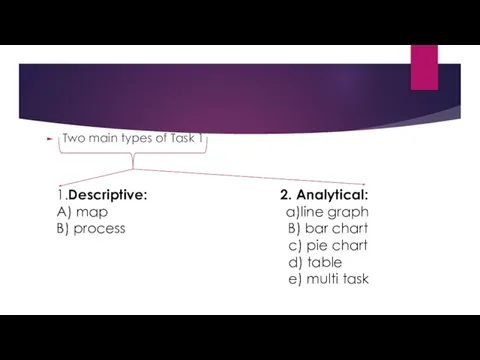
- 4. Two main types of Task 1 1.Descriptive: 2. Analytical: A) map a)line graph B) process B)
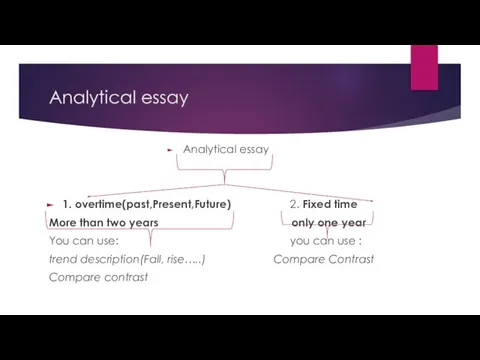
- 5. Analytical essay Analytical essay 1. overtime(past,Present,Future) 2. Fixed time More than two years only one year
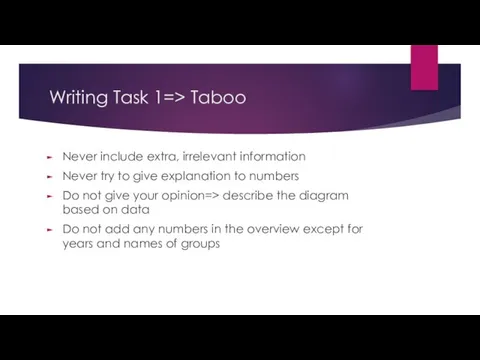
- 6. Writing Task 1=> Taboo Never include extra, irrelevant information Never try to give explanation to numbers
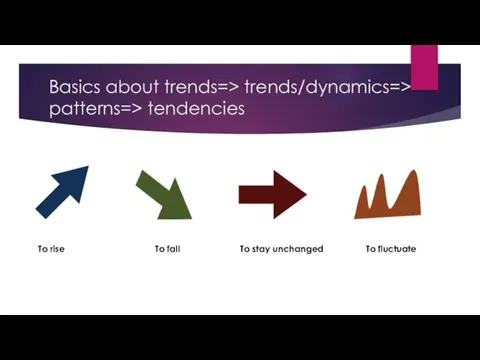
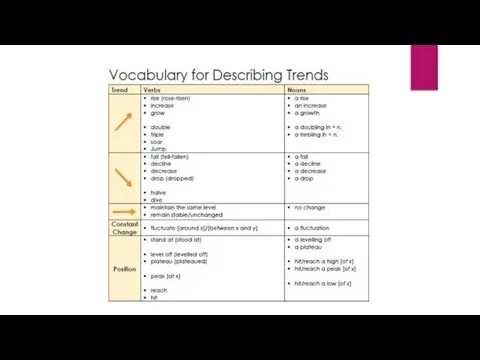
- 7. Basics about trends=> trends/dynamics=> patterns=> tendencies To rise To fall To stay unchanged To fluctuate
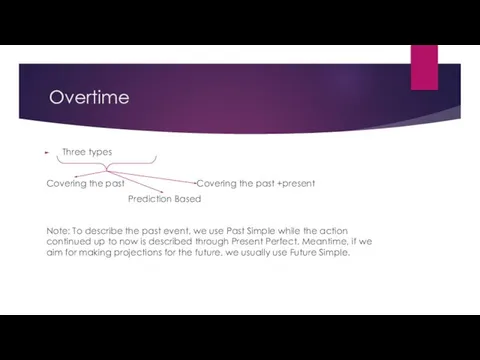
- 8. Overtime Three types Covering the past Covering the past +present Prediction Based Note: To describe the
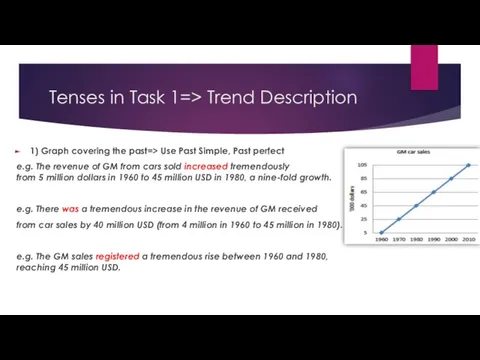
- 9. Tenses in Task 1=> Trend Description 1) Graph covering the past=> Use Past Simple, Past perfect
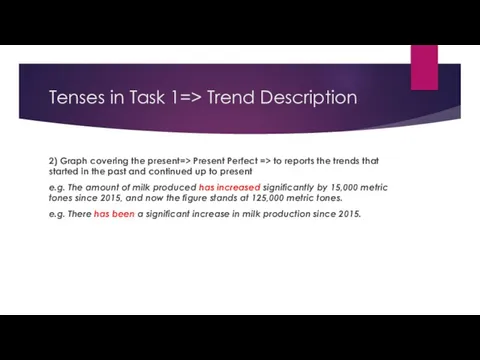
- 10. Tenses in Task 1=> Trend Description 2) Graph covering the present=> Present Perfect => to reports
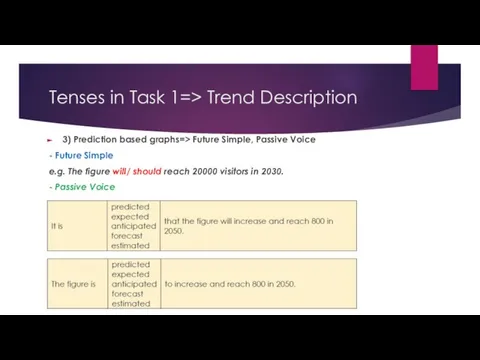
- 11. Tenses in Task 1=> Trend Description 3) Prediction based graphs=> Future Simple, Passive Voice - Future
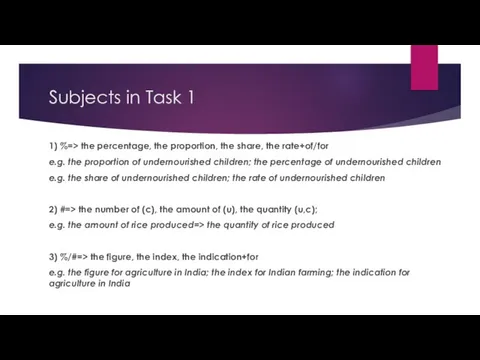
- 12. Subjects in Task 1 1) %=> the percentage, the proportion, the share, the rate+of/for e.g. the
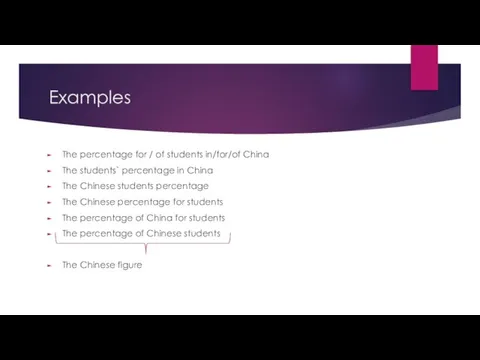
- 13. Examples The percentage for / of students in/for/of China The students` percentage in China The Chinese
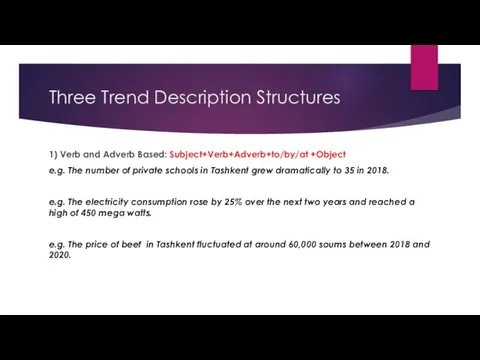
- 14. Three Trend Description Structures 1) Verb and Adverb Based: Subject+Verb+Adverb+to/by/at +Object e.g. The number of private
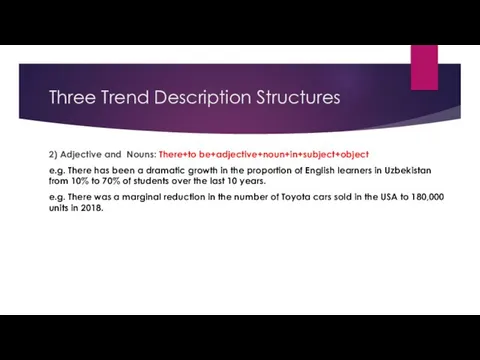
- 15. Three Trend Description Structures 2) Adjective and Nouns: There+to be+adjective+noun+in+subject+object e.g. There has been a dramatic
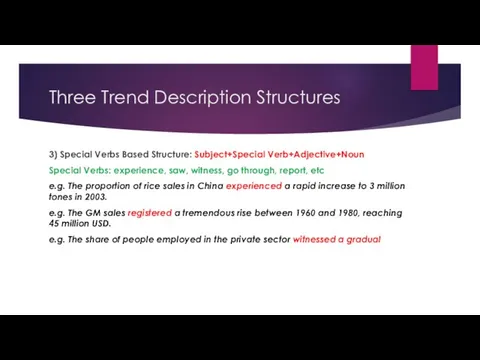
- 16. Three Trend Description Structures 3) Special Verbs Based Structure: Subject+Special Verb+Adjective+Noun Special Verbs: experience, saw, witness,
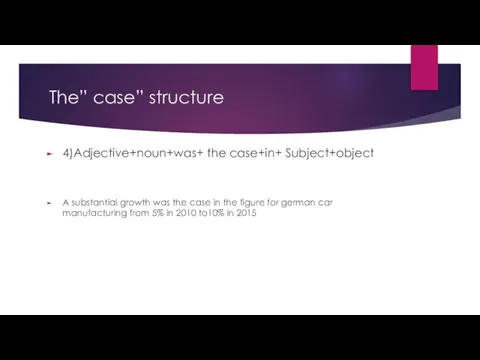
- 17. The” case” structure 4)Adjective+noun+was+ the case+in+ Subject+object A substantial growth was the case in the figure
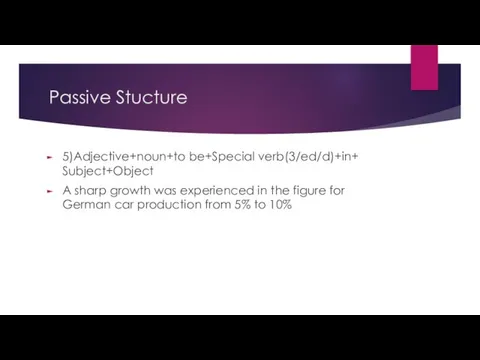
- 18. Passive Stucture 5)Adjective+noun+to be+Special verb(3/ed/d)+in+ Subject+Object A sharp growth was experienced in the figure for German
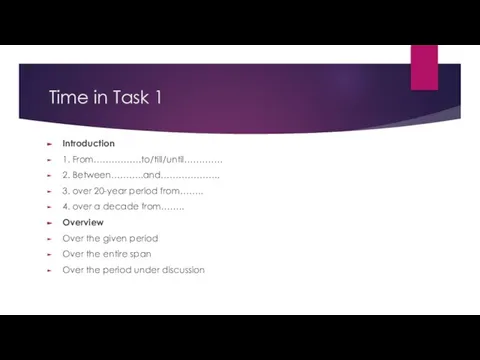
- 21. Time in Task 1 Introduction 1. From…………….to/till/until…………. 2. Between………..and……………….. 3. over 20-year period from…….. 4. over
- 22. Linking devices in IELTS Writing Task 1 First event: At first,/Initially/In the first year,/In 1999/ Middle
- 23. Approximation 1) roughly/[just] about/approximately/around+ 90%=>88%/89%/91%/92% 2) almost/nearly 90%=>88%/89% 3) [just] below/under 4) [just] above/over
- 24. Using the right prepositions It is important to use the right preposition when you are reporting
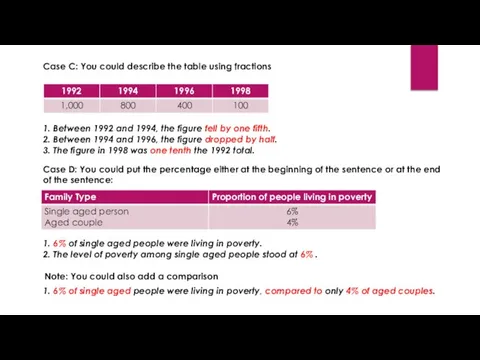
- 25. Describing numbers, percentages & fractions (Referencing Part 1) Referencing means adding numbers, percentages and fractions to
- 26. Case B: You could describe the table using the words double, treble, quadruple, -fold and times:
- 27. Case C: You could describe the table using fractions 1. Between 1992 and 1994, the figure
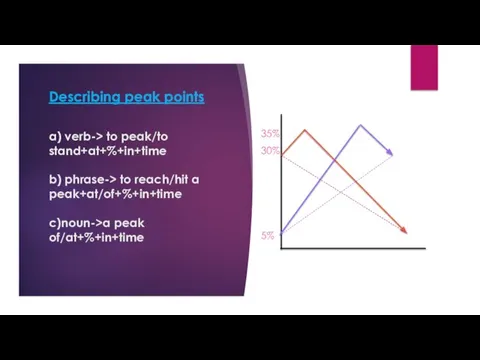
- 28. Describing peak points a) verb-> to peak/to stand+at+%+in+time b) phrase-> to reach/hit a peak+at/of+%+in+time c)noun->a peak
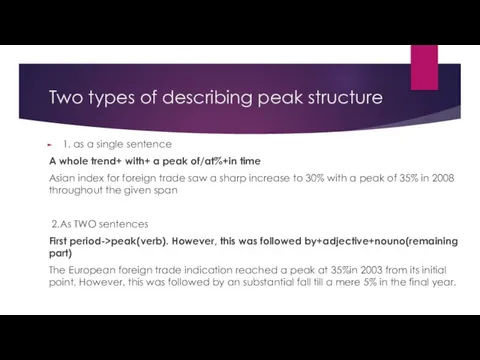
- 29. Two types of describing peak structure 1. as a single sentence A whole trend+ with+ a
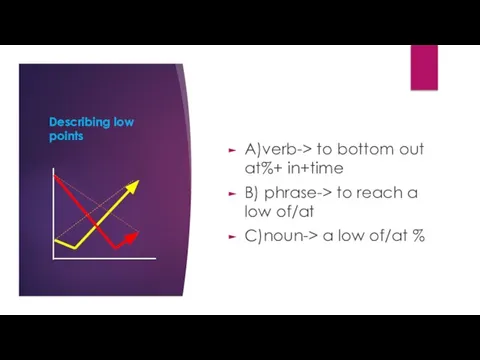
- 30. Describing low points A)verb-> to bottom out at%+ in+time B) phrase-> to reach a low of/at
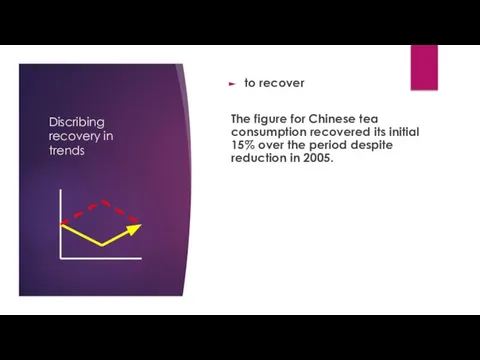
- 31. Discribing recovery in trends to recover The figure for Chinese tea consumption recovered its initial 15%
- 33. Скачать презентацию
Слайд 2IELTS Writing Task 1 Overview
information transfer essay(diagrams, processes, tables)
9 general types
24
IELTS Writing Task 1 Overview
information transfer essay(diagrams, processes, tables)
9 general types
24
Слайд 3Common structure for Task 1
Introduction
Overview
Body 1
Body 2
Common structure for Task 1
Introduction
Overview
Body 1
Body 2
Слайд 4Two main types of Task 1
1.Descriptive: 2. Analytical:
A) map a)line graph
B) process
Two main types of Task 1
1.Descriptive: 2. Analytical: A) map a)line graph B) process
Слайд 5Analytical essay
Analytical essay
1. overtime(past,Present,Future) 2. Fixed time
More than two years only one
Analytical essay
Analytical essay
1. overtime(past,Present,Future) 2. Fixed time
More than two years only one
Слайд 6Writing Task 1=> Taboo
Never include extra, irrelevant information
Never try to give explanation
Writing Task 1=> Taboo
Never include extra, irrelevant information
Never try to give explanation
Слайд 7Basics about trends=> trends/dynamics=> patterns=> tendencies
To rise To fall To stay unchanged
Basics about trends=> trends/dynamics=> patterns=> tendencies
To rise To fall To stay unchanged
Слайд 8Overtime
Three types
Covering the past Covering the past +present
Prediction Based
Note: To
Overtime
Three types
Covering the past Covering the past +present
Prediction Based
Note: To
Слайд 9Tenses in Task 1=> Trend Description
1) Graph covering the past=> Use
Tenses in Task 1=> Trend Description
1) Graph covering the past=> Use
Слайд 10Tenses in Task 1=> Trend Description
2) Graph covering the present=> Present
Tenses in Task 1=> Trend Description
2) Graph covering the present=> Present
Слайд 11Tenses in Task 1=> Trend Description
3) Prediction based graphs=> Future Simple,
Tenses in Task 1=> Trend Description
3) Prediction based graphs=> Future Simple,
Слайд 12Subjects in Task 1
1) %=> the percentage, the proportion, the share, the
Subjects in Task 1
1) %=> the percentage, the proportion, the share, the
Слайд 13Examples
The percentage for / of students in/for/of China
The students` percentage in
Examples
The percentage for / of students in/for/of China
The students` percentage in
Слайд 14Three Trend Description Structures
1) Verb and Adverb Based: Subject+Verb+Adverb+to/by/at +Object
e.g. The
Three Trend Description Structures
1) Verb and Adverb Based: Subject+Verb+Adverb+to/by/at +Object
e.g. The
Слайд 15Three Trend Description Structures
2) Adjective and Nouns: There+to be+adjective+noun+in+subject+object
e.g. There
Three Trend Description Structures
2) Adjective and Nouns: There+to be+adjective+noun+in+subject+object
e.g. There
Слайд 16Three Trend Description Structures
3) Special Verbs Based Structure: Subject+Special Verb+Adjective+Noun
Special Verbs:
Three Trend Description Structures
3) Special Verbs Based Structure: Subject+Special Verb+Adjective+Noun
Special Verbs:
Слайд 17The” case” structure
4)Adjective+noun+was+ the case+in+ Subject+object
A substantial growth was the case in
The” case” structure
4)Adjective+noun+was+ the case+in+ Subject+object
A substantial growth was the case in
Слайд 18Passive Stucture
5)Adjective+noun+to be+Special verb(3/ed/d)+in+ Subject+Object
A sharp growth was experienced in the figure
Passive Stucture
5)Adjective+noun+to be+Special verb(3/ed/d)+in+ Subject+Object
A sharp growth was experienced in the figure
Слайд 21Time in Task 1
Introduction
1. From…………….to/till/until………….
2. Between………..and………………..
3. over 20-year period from……..
4. over a
Time in Task 1
Introduction
1. From…………….to/till/until………….
2. Between………..and………………..
3. over 20-year period from……..
4. over a
Слайд 22
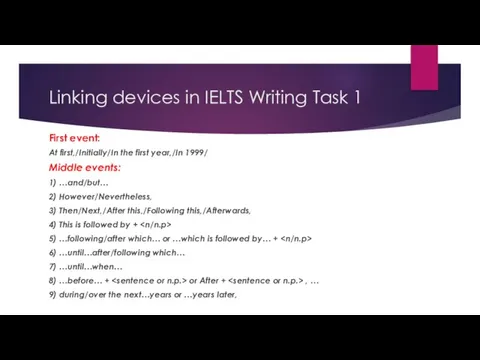
Linking devices in IELTS Writing Task 1
First event:
At first,/Initially/In the first
Linking devices in IELTS Writing Task 1
First event:
At first,/Initially/In the first
Слайд 23Approximation
1) roughly/[just] about/approximately/around+ 90%=>88%/89%/91%/92%
2) almost/nearly 90%=>88%/89%
3) [just] below/under
4) [just] above/over
Approximation
1) roughly/[just] about/approximately/around+ 90%=>88%/89%/91%/92%
2) almost/nearly 90%=>88%/89%
3) [just] below/under
4) [just] above/over
![Approximation 1) roughly/[just] about/approximately/around+ 90%=>88%/89%/91%/92% 2) almost/nearly 90%=>88%/89% 3) [just] below/under 4) [just] above/over](/_ipx/f_webp&q_80&fit_contain&s_1440x1080/imagesDir/jpg/867962/slide-22.jpg)
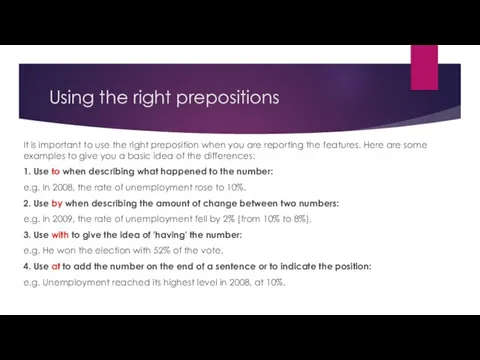
Слайд 24Using the right prepositions
It is important to use the right preposition when
Using the right prepositions
It is important to use the right preposition when
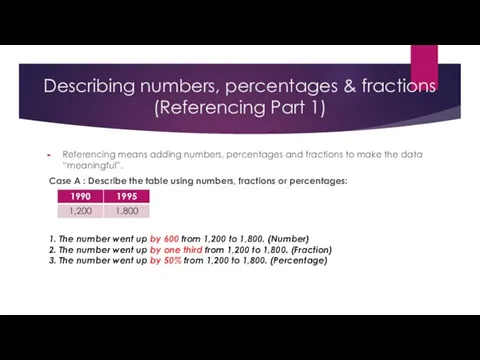
Слайд 25Describing numbers, percentages & fractions (Referencing Part 1)
Referencing means adding numbers,
Describing numbers, percentages & fractions (Referencing Part 1)
Referencing means adding numbers,
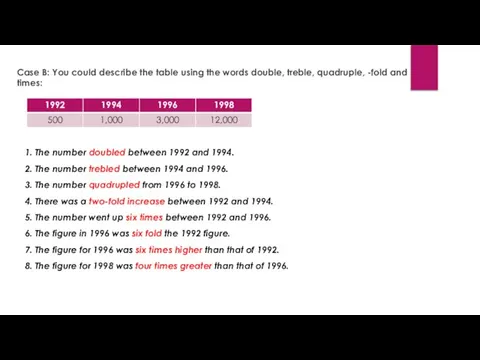
Слайд 26Case B: You could describe the table using the words double, treble,
Case B: You could describe the table using the words double, treble,
Слайд 27Case C: You could describe the table using fractions
1. Between 1992 and
Case C: You could describe the table using fractions
1. Between 1992 and
Слайд 28
Describing peak points
a) verb-> to peak/to stand+at+%+in+time
b) phrase-> to reach/hit a peak+at/of+%+in+time
c)noun->a
Describing peak points a) verb-> to peak/to stand+at+%+in+time b) phrase-> to reach/hit a peak+at/of+%+in+time c)noun->a
Слайд 29Two types of describing peak structure
1. as a single sentence
A whole trend+
Two types of describing peak structure
1. as a single sentence
A whole trend+
Слайд 30
Describing low points
A)verb-> to bottom out at%+ in+time
B) phrase-> to reach a
Describing low points
A)verb-> to bottom out at%+ in+time
B) phrase-> to reach a
Слайд 31Discribing recovery in trends
to recover
The figure for Chinese tea consumption recovered its
Discribing recovery in trends
to recover
The figure for Chinese tea consumption recovered its
 Over The Moon!
 The Houses of Parliament
 Презентация на тему Buenos Aires
  Презентация на тему Простое прошедшее время
  Simply Speaking 2
 Individual project
 Marine articles. Game
 Школьные принадлежности
 Ich will
 Презентация на тему Present Simple or Present Continuous (Настоящее длительное или простое)
  Learn and practice
 Christmas is Christmas is a wonderful holiday!
 Has got
 Reported speech, adverbs
 Урок английского языка
 Презентация к уроку английского языка "It`s fun!" -
  About my family
 Trinity College Cambridge
 Wheels on the bus
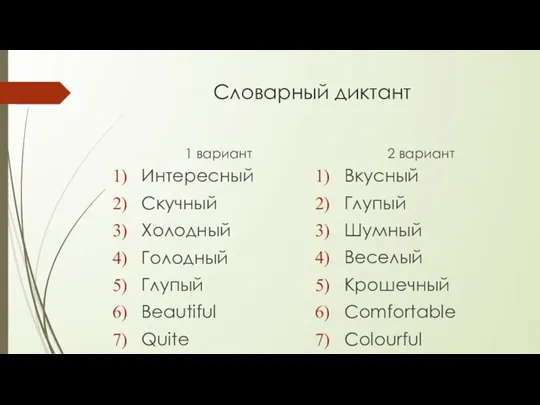 Словарный диктант. Vocabulary dictation
 The town of my dream
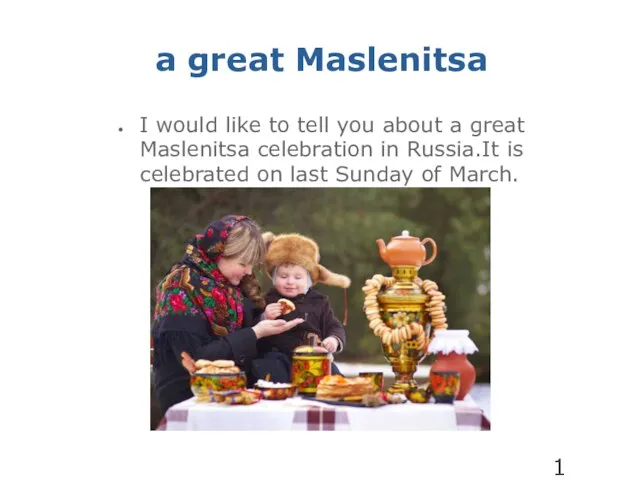 A great Maslenitsa
 Helen’s story
 Reading is Fun
 May Day,
 Do you often go shopping?
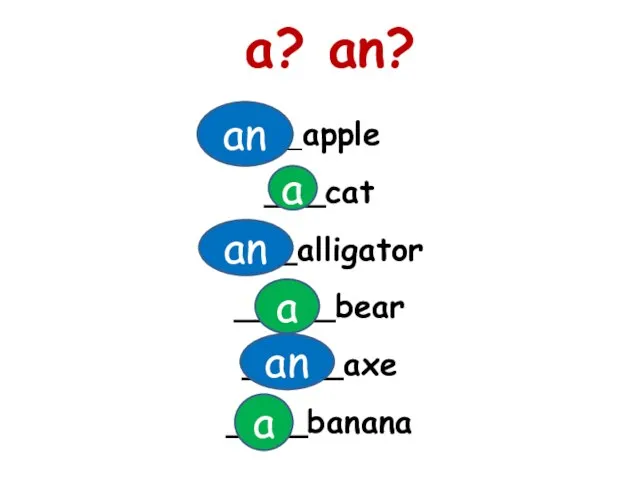 A? an?
 Lesson nineteen - 19