- Metrics to Evaluate Systems

Содержание
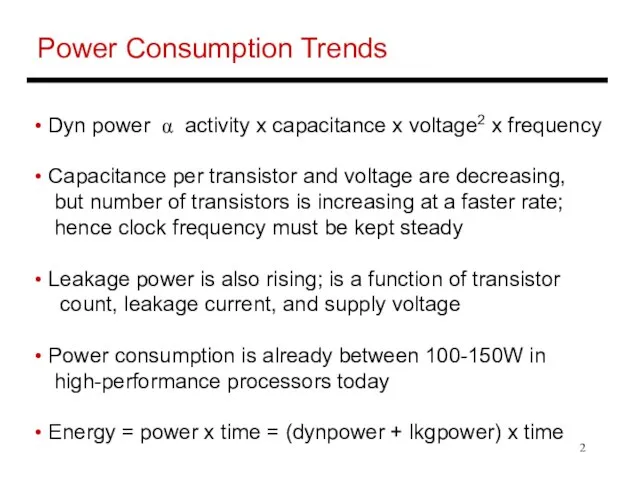
- 2. Power Consumption Trends Dyn power α activity x capacitance x voltage2 x frequency Capacitance per transistor
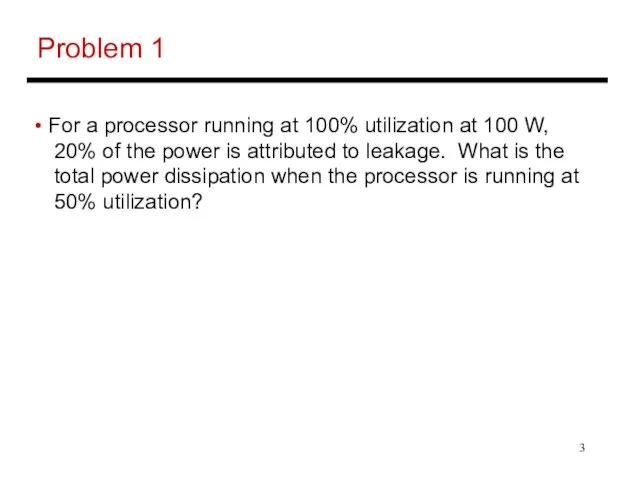
- 3. Problem 1 For a processor running at 100% utilization at 100 W, 20% of the power
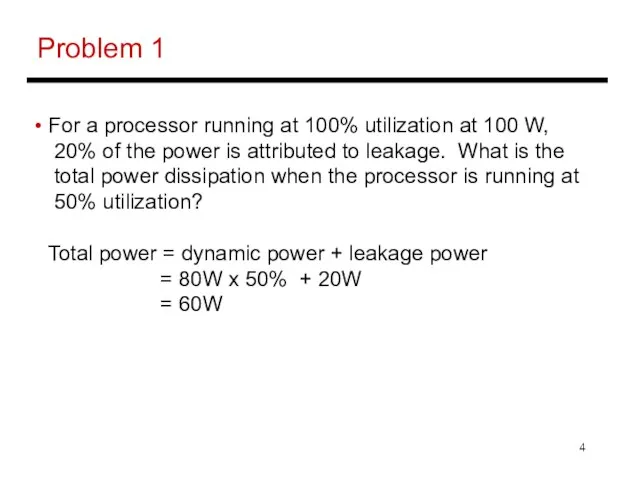
- 4. Problem 1 For a processor running at 100% utilization at 100 W, 20% of the power
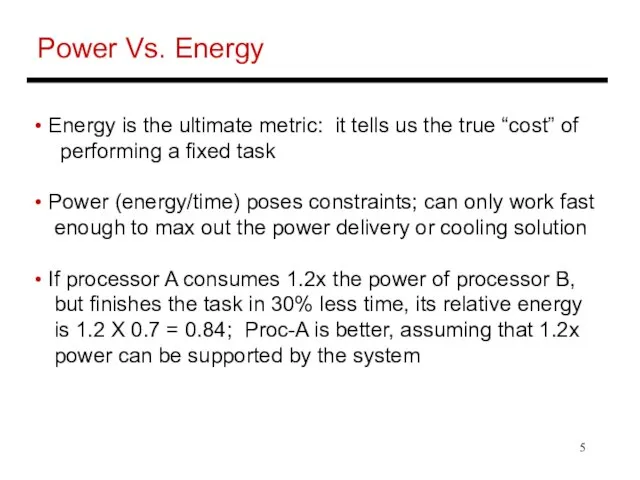
- 5. Power Vs. Energy Energy is the ultimate metric: it tells us the true “cost” of performing
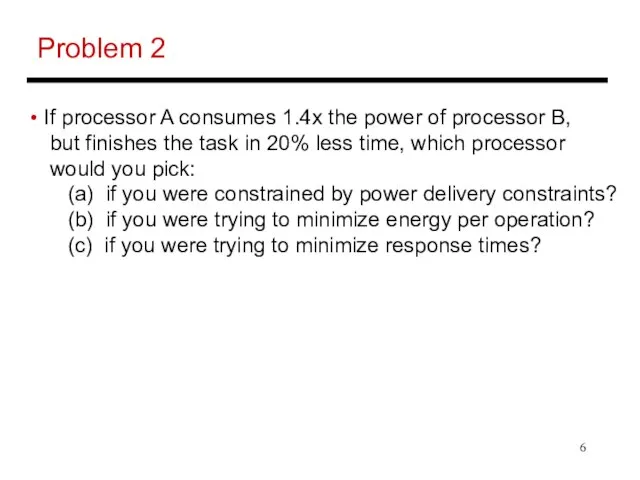
- 6. Problem 2 If processor A consumes 1.4x the power of processor B, but finishes the task
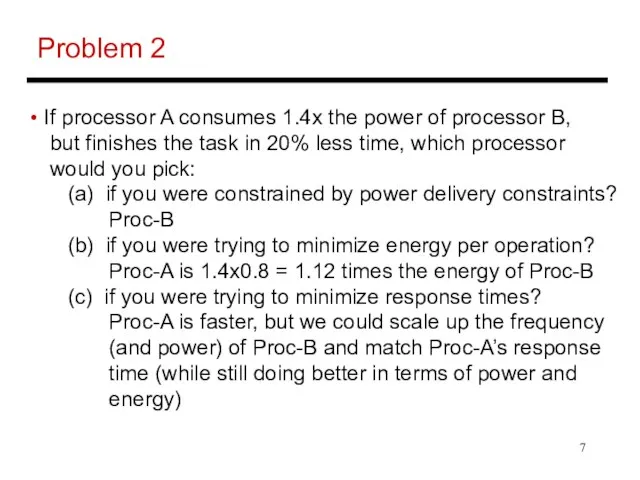
- 7. Problem 2 If processor A consumes 1.4x the power of processor B, but finishes the task
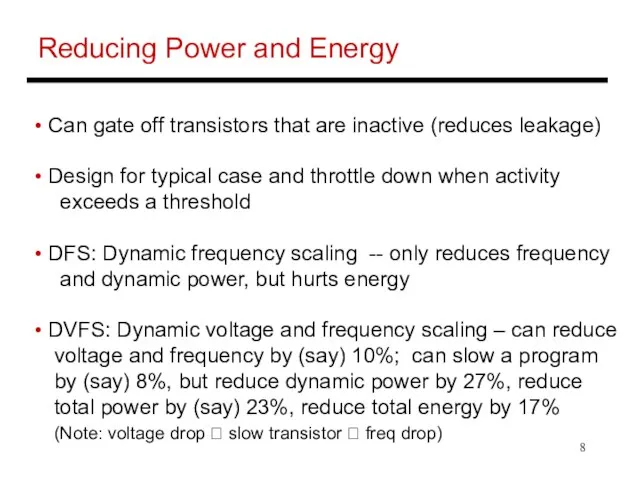
- 8. Reducing Power and Energy Can gate off transistors that are inactive (reduces leakage) Design for typical
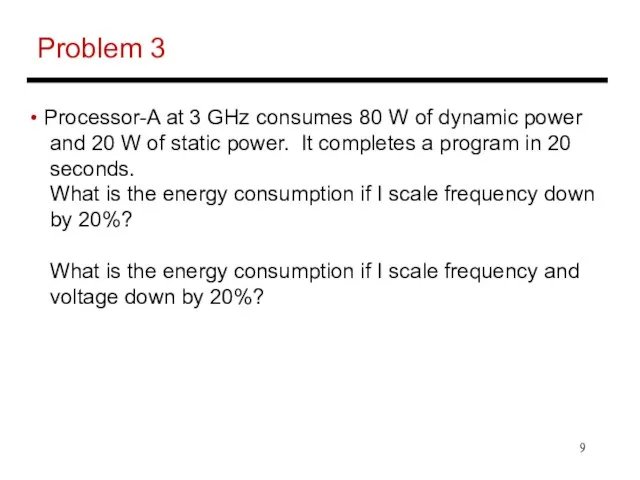
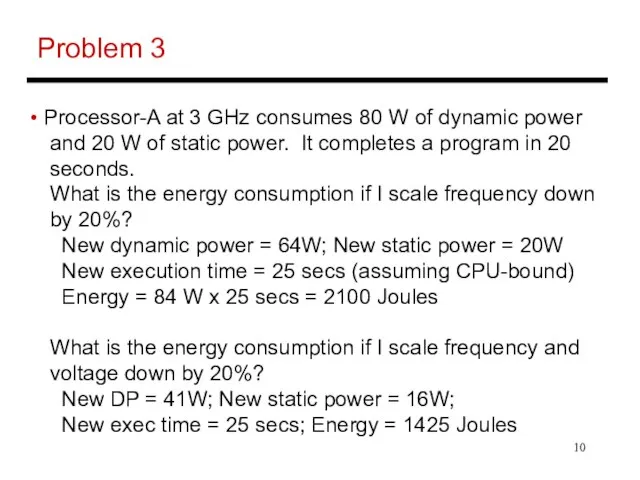
- 9. Problem 3 Processor-A at 3 GHz consumes 80 W of dynamic power and 20 W of
- 10. Problem 3 Processor-A at 3 GHz consumes 80 W of dynamic power and 20 W of
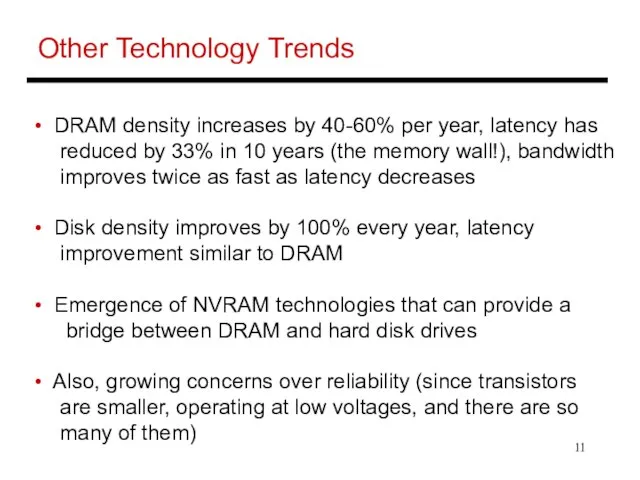
- 11. Other Technology Trends DRAM density increases by 40-60% per year, latency has reduced by 33% in
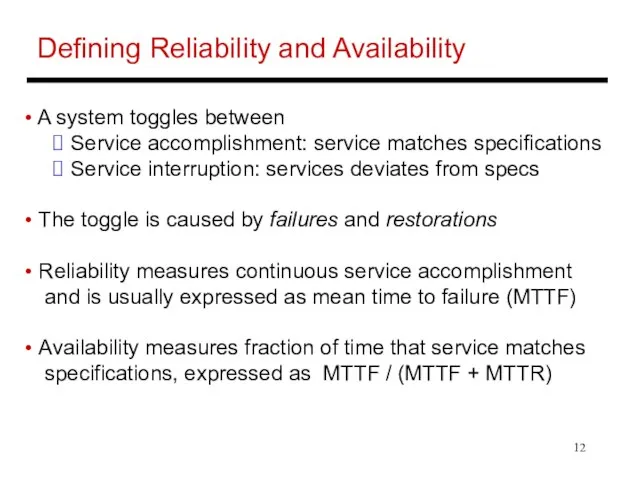
- 12. Defining Reliability and Availability A system toggles between Service accomplishment: service matches specifications Service interruption: services
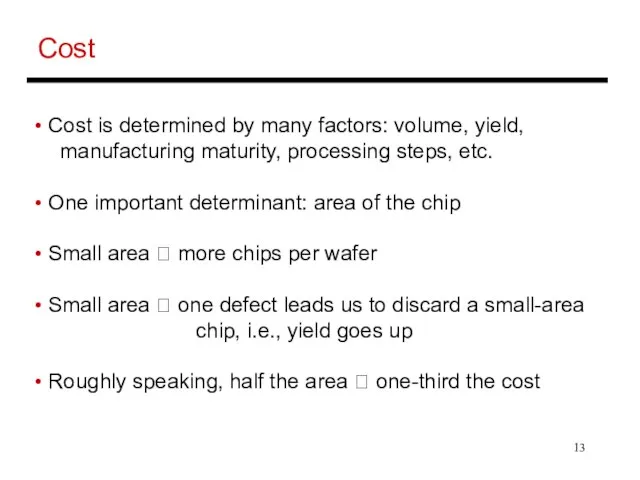
- 13. Cost Cost is determined by many factors: volume, yield, manufacturing maturity, processing steps, etc. One important
- 14. Measuring Performance Two primary metrics: wall clock time (response time for a program) and throughput (jobs
- 15. Benchmark Suites Performance is measured with benchmark suites: a collection of programs that are likely relevant
- 16. Summarizing Performance Consider 25 programs from a benchmark set – how do we capture the behavior
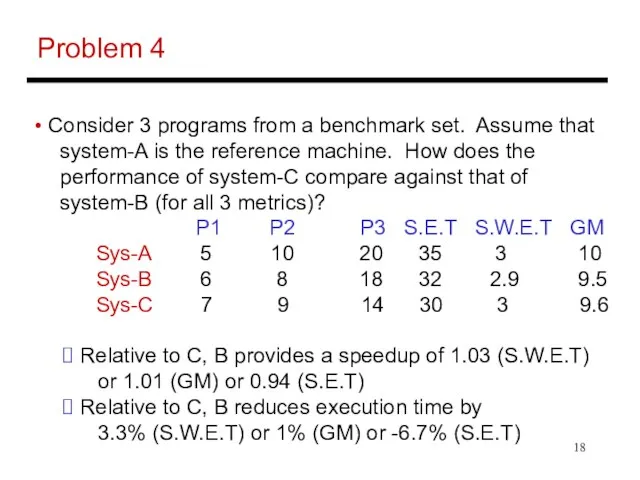
- 17. Problem 4 Consider 3 programs from a benchmark set. Assume that system-A is the reference machine.
- 18. Problem 4 Consider 3 programs from a benchmark set. Assume that system-A is the reference machine.
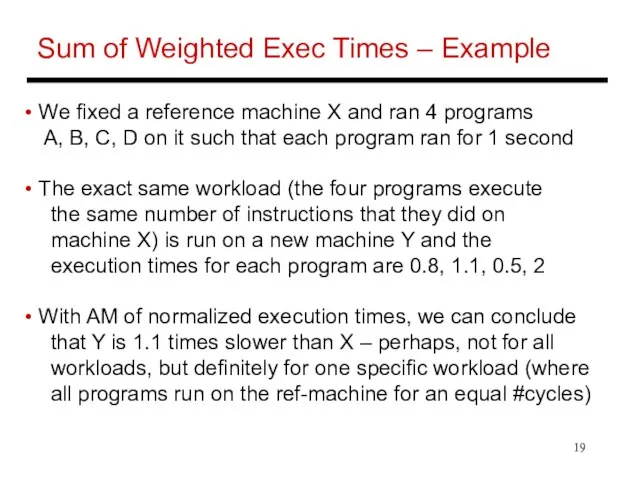
- 19. Sum of Weighted Exec Times – Example We fixed a reference machine X and ran 4
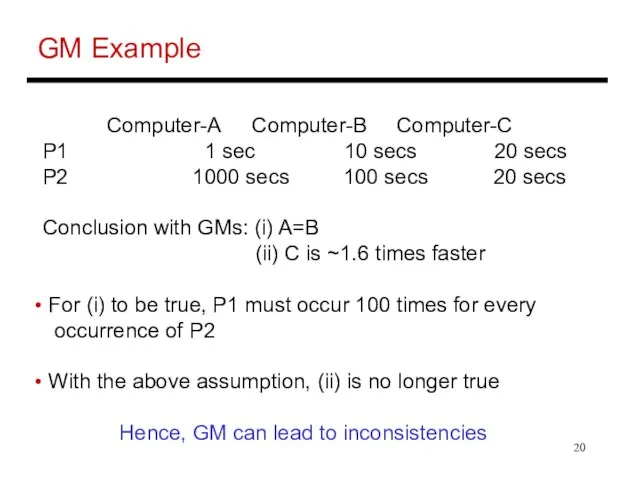
- 20. GM Example Computer-A Computer-B Computer-C P1 1 sec 10 secs 20 secs P2 1000 secs 100
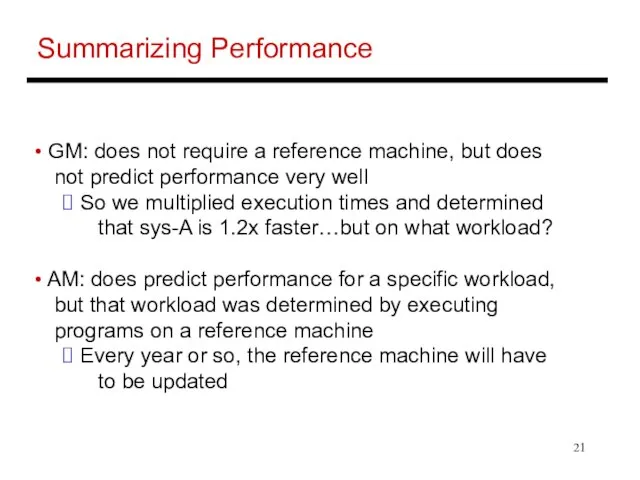
- 21. Summarizing Performance GM: does not require a reference machine, but does not predict performance very well
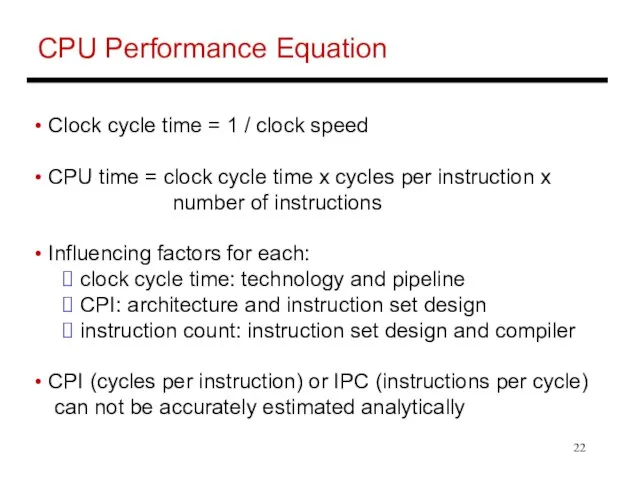
- 22. CPU Performance Equation Clock cycle time = 1 / clock speed CPU time = clock cycle
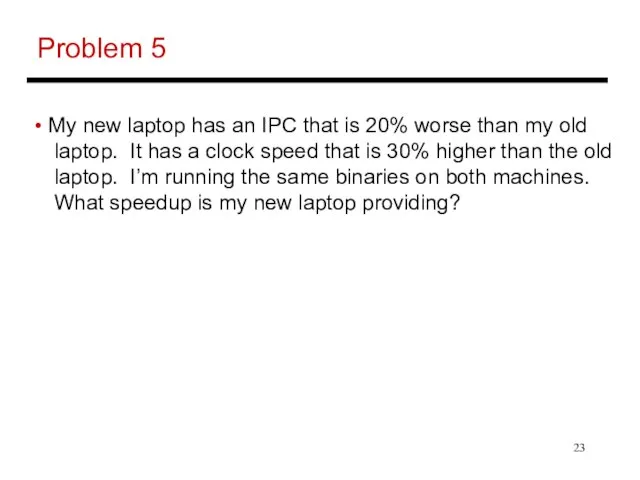
- 23. Problem 5 My new laptop has an IPC that is 20% worse than my old laptop.
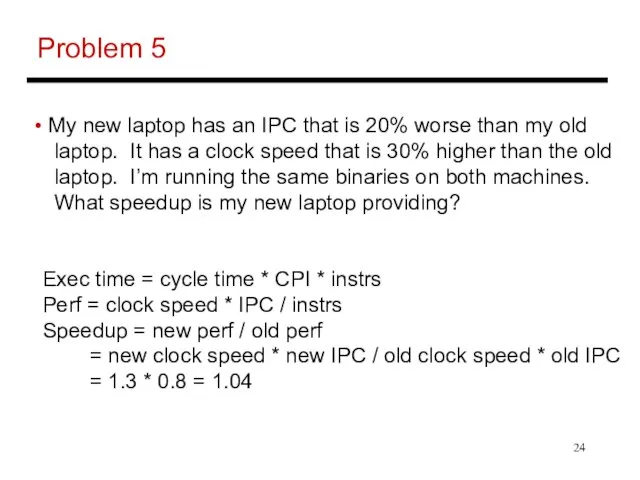
- 24. Problem 5 My new laptop has an IPC that is 20% worse than my old laptop.
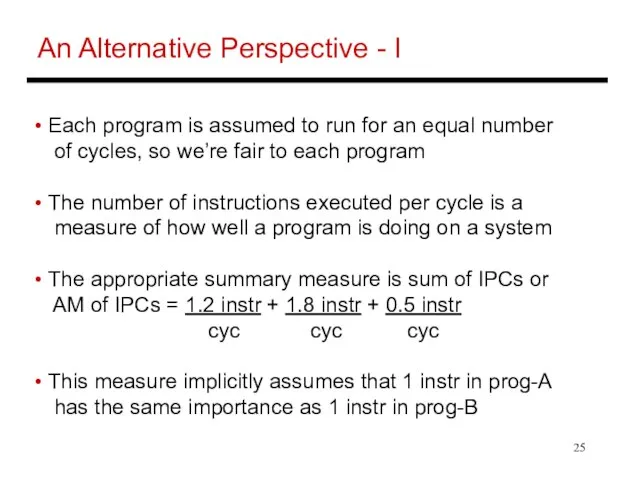
- 25. An Alternative Perspective - I Each program is assumed to run for an equal number of
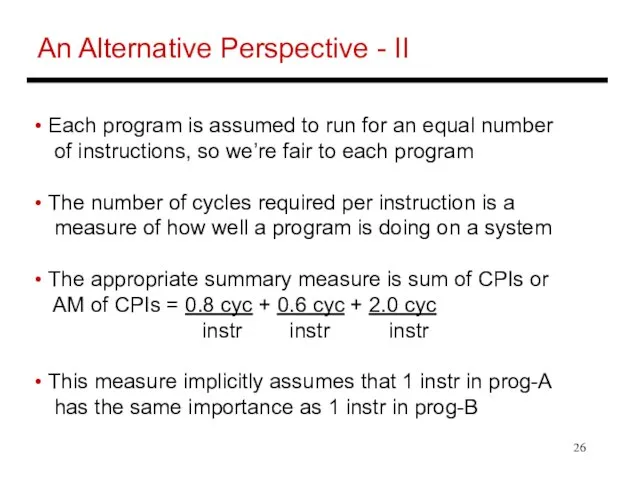
- 26. An Alternative Perspective - II Each program is assumed to run for an equal number of
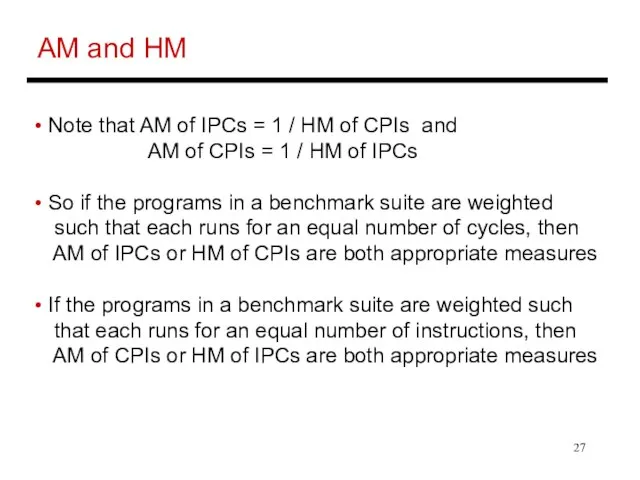
- 27. AM and HM Note that AM of IPCs = 1 / HM of CPIs and AM
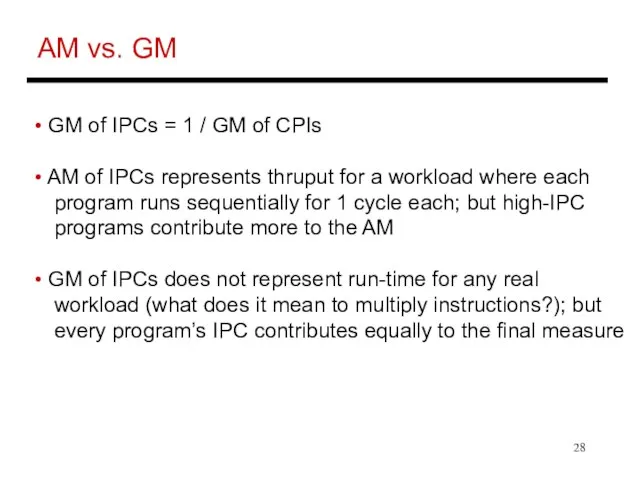
- 28. AM vs. GM GM of IPCs = 1 / GM of CPIs AM of IPCs represents
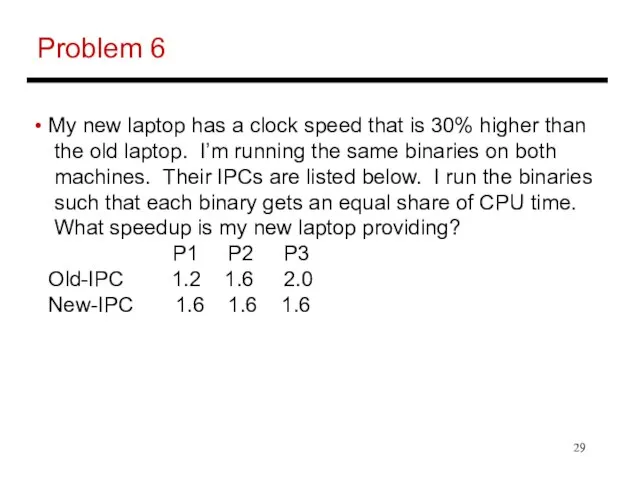
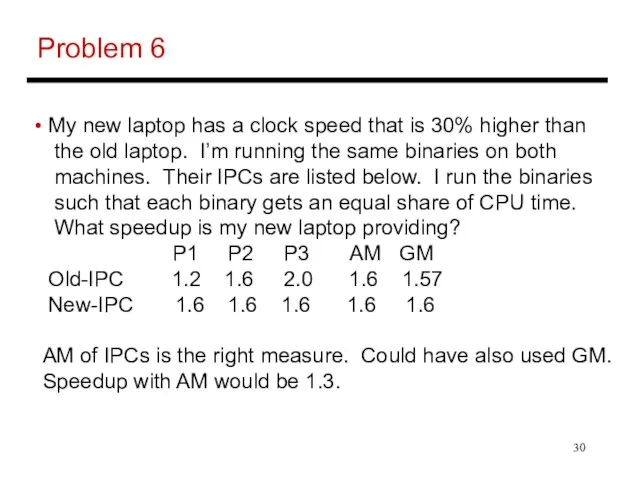
- 29. Problem 6 My new laptop has a clock speed that is 30% higher than the old
- 30. Problem 6 My new laptop has a clock speed that is 30% higher than the old
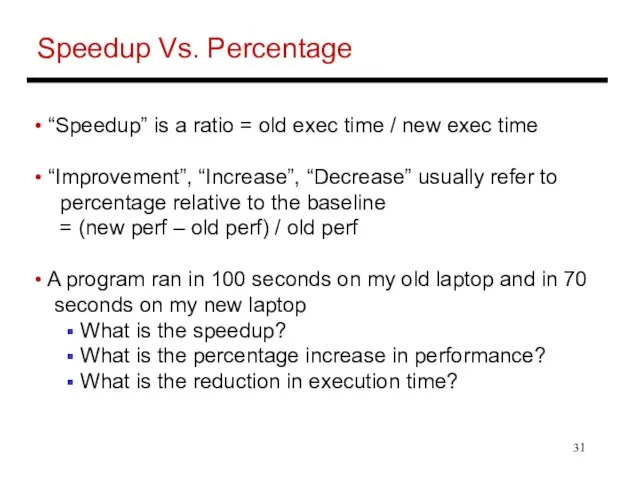
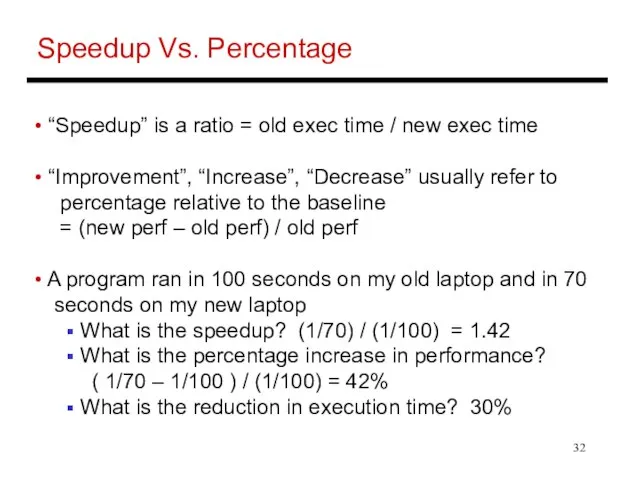
- 31. Speedup Vs. Percentage “Speedup” is a ratio = old exec time / new exec time “Improvement”,
- 32. Speedup Vs. Percentage “Speedup” is a ratio = old exec time / new exec time “Improvement”,
- 34. Скачать презентацию
Слайд 3Problem 1
For a processor running at 100% utilization at 100 W,
Problem 1
For a processor running at 100% utilization at 100 W,
Слайд 4Problem 1
For a processor running at 100% utilization at 100 W,
Problem 1
For a processor running at 100% utilization at 100 W,
Слайд 5Power Vs. Energy
Energy is the ultimate metric: it tells us the
Power Vs. Energy
Energy is the ultimate metric: it tells us the
Слайд 6Problem 2
If processor A consumes 1.4x the power of processor B,
Problem 2
If processor A consumes 1.4x the power of processor B,
Слайд 7Problem 2
If processor A consumes 1.4x the power of processor B,
Problem 2
If processor A consumes 1.4x the power of processor B,
Слайд 8Reducing Power and Energy
Can gate off transistors that are inactive (reduces
Reducing Power and Energy
Can gate off transistors that are inactive (reduces
Слайд 9Problem 3
Processor-A at 3 GHz consumes 80 W of dynamic power
Problem 3
Processor-A at 3 GHz consumes 80 W of dynamic power
Слайд 10Problem 3
Processor-A at 3 GHz consumes 80 W of dynamic power
Problem 3
Processor-A at 3 GHz consumes 80 W of dynamic power
Слайд 11Other Technology Trends
DRAM density increases by 40-60% per year, latency has
Other Technology Trends
DRAM density increases by 40-60% per year, latency has
Слайд 12Defining Reliability and Availability
A system toggles between
Service accomplishment: service matches
Defining Reliability and Availability
A system toggles between
Service accomplishment: service matches
Слайд 13Cost
Cost is determined by many factors: volume, yield,
manufacturing maturity, processing
Cost
Cost is determined by many factors: volume, yield,
manufacturing maturity, processing
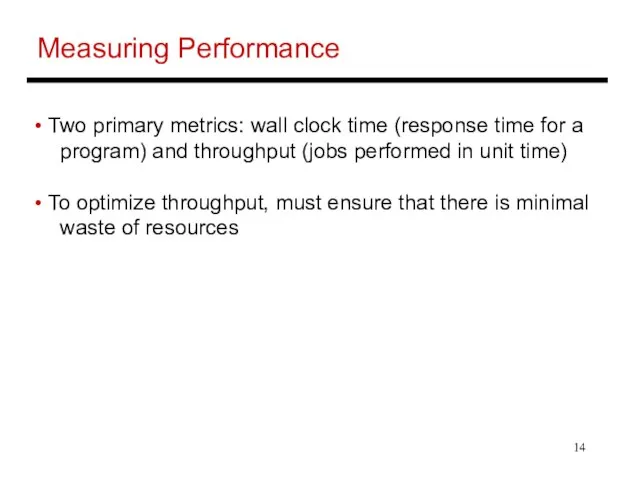
Слайд 14Measuring Performance
Two primary metrics: wall clock time (response time for a
Measuring Performance
Two primary metrics: wall clock time (response time for a
Слайд 15Benchmark Suites
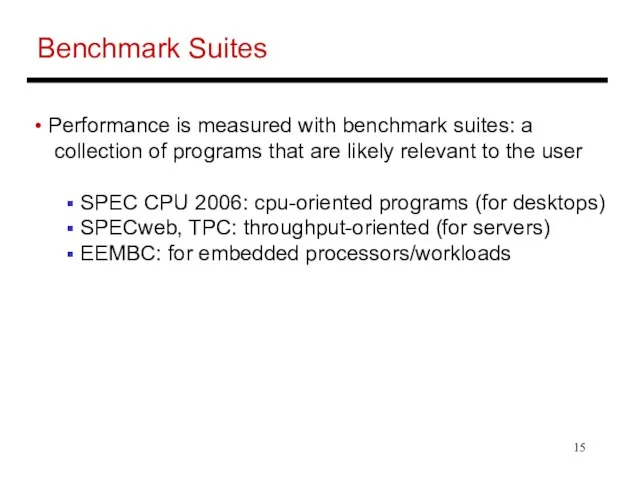
Performance is measured with benchmark suites: a
collection of programs
Benchmark Suites
Performance is measured with benchmark suites: a
collection of programs
Слайд 16Summarizing Performance
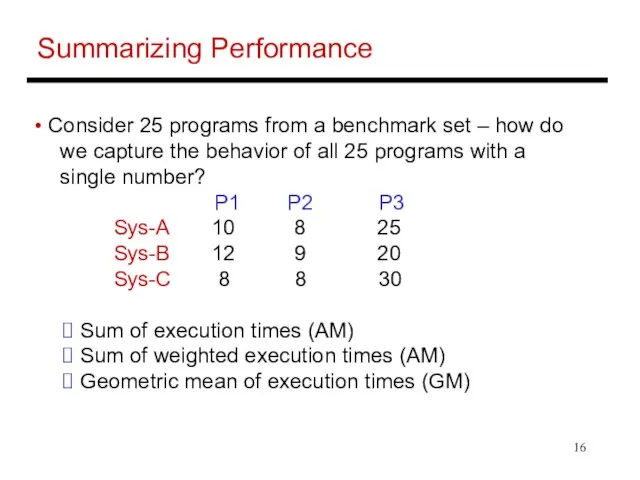
Consider 25 programs from a benchmark set – how do
Summarizing Performance
Consider 25 programs from a benchmark set – how do
Слайд 17Problem 4
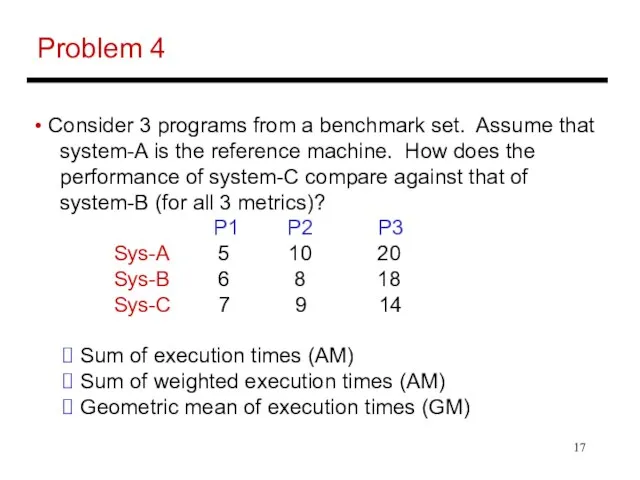
Consider 3 programs from a benchmark set. Assume that
system-A
Problem 4
Consider 3 programs from a benchmark set. Assume that
system-A
Слайд 18Problem 4
Consider 3 programs from a benchmark set. Assume that
system-A
Problem 4
Consider 3 programs from a benchmark set. Assume that
system-A
Слайд 19Sum of Weighted Exec Times – Example
We fixed a reference
Sum of Weighted Exec Times – Example
We fixed a reference
Слайд 20GM Example
Computer-A Computer-B Computer-C
P1 1 sec 10 secs 20 secs
P2 1000 secs
GM Example
Computer-A Computer-B Computer-C
P1 1 sec 10 secs 20 secs
P2 1000 secs
Слайд 21Summarizing Performance
GM: does not require a reference machine, but does
not
Summarizing Performance
GM: does not require a reference machine, but does
not
Слайд 22CPU Performance Equation
Clock cycle time = 1 / clock speed
CPU
CPU Performance Equation
Clock cycle time = 1 / clock speed
CPU
Слайд 23Problem 5
My new laptop has an IPC that is 20% worse
Problem 5
My new laptop has an IPC that is 20% worse
Слайд 24Problem 5
My new laptop has an IPC that is 20% worse
Problem 5
My new laptop has an IPC that is 20% worse
Слайд 25An Alternative Perspective - I
Each program is assumed to run for
An Alternative Perspective - I
Each program is assumed to run for
Слайд 26An Alternative Perspective - II
Each program is assumed to run for
An Alternative Perspective - II
Each program is assumed to run for
Слайд 27AM and HM
Note that AM of IPCs = 1 / HM
AM and HM
Note that AM of IPCs = 1 / HM
Слайд 28AM vs. GM
GM of IPCs = 1 / GM of CPIs
AM vs. GM
GM of IPCs = 1 / GM of CPIs
Слайд 29Problem 6
My new laptop has a clock speed that is 30%
Problem 6
My new laptop has a clock speed that is 30%
Слайд 30Problem 6
My new laptop has a clock speed that is 30%
Problem 6
My new laptop has a clock speed that is 30%
Слайд 31Speedup Vs. Percentage
“Speedup” is a ratio = old exec time /
Speedup Vs. Percentage
“Speedup” is a ratio = old exec time /
Слайд 32Speedup Vs. Percentage
“Speedup” is a ratio = old exec time /
Speedup Vs. Percentage
“Speedup” is a ratio = old exec time /
 The Palestinian attacker has been shot and wounded
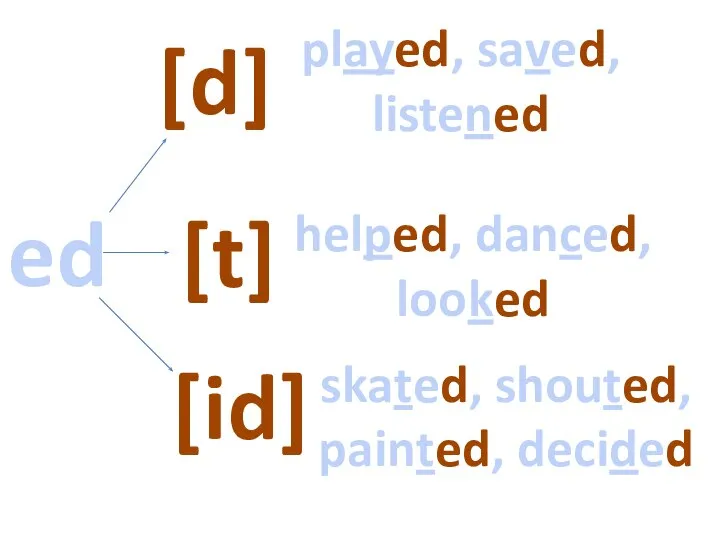 Past Simple regular verbs
 What’s the weather?
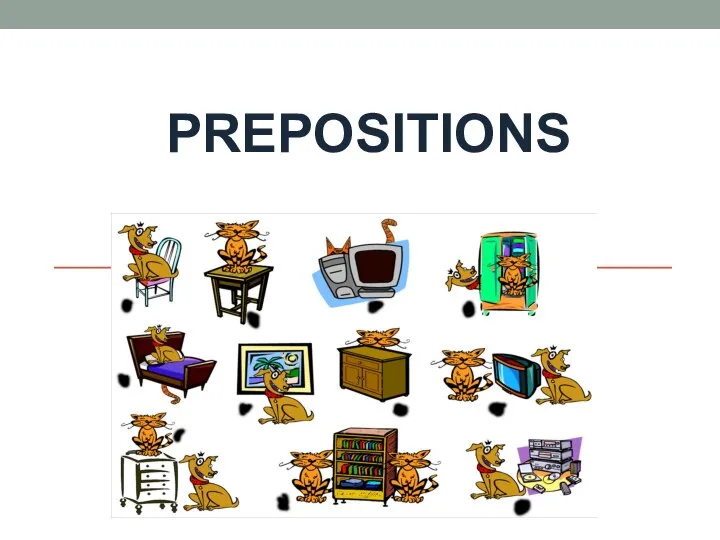 Prepositions
 Междометие. Значение Meaning
 Easter traditions
 Valentine's Day
 Godenkova_i_Evgodikova_Po_angliyskomu
 Spider web. Sample by helgabel
 The Boston Tea Party
 Fish. Cat. Dog
 Parts of the body
 All About shapes
 Summer. What can you see
 Education. Разбор заданий
 Lake Baikal
 Here is my head
 Shortbread
 Выполнили: Болотина Елена Александровна МОУ СОШ 72 г.Хабаровск 2.Помогайбина Людмила Васильевна МОУ СОШ 72 г.Хабаровск
 Creating molecules from scratch
 A shopping mall of my dream
 Phrasal verbs
 Numbers 1-10. Game fun activities
 What’s the plural?
 Zoo, zoo, who’s in the zoo?
 Презентация к уроку английского языка "Sightseeings of wales" -
 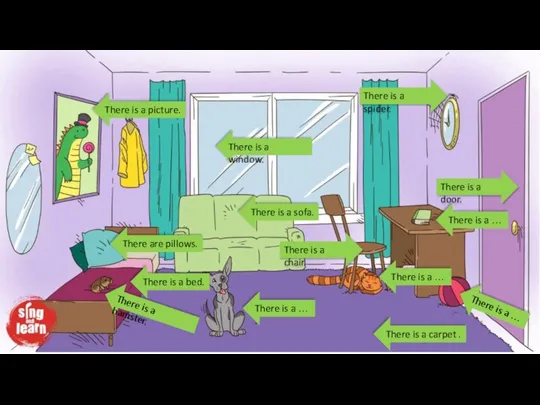 There is, there are
 Mary`s Dog