- Describing graphs

Содержание
- 2. What is a chart? A chart is a diagram that makes information easier to understand by
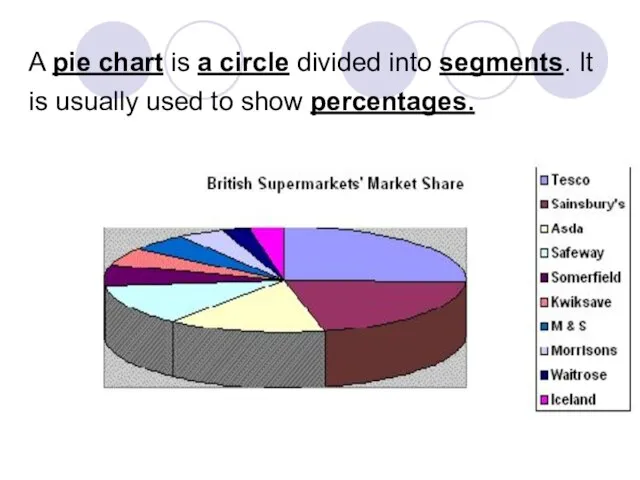
- 3. A pie chart is a circle divided into segments. It is usually used to show percentages.
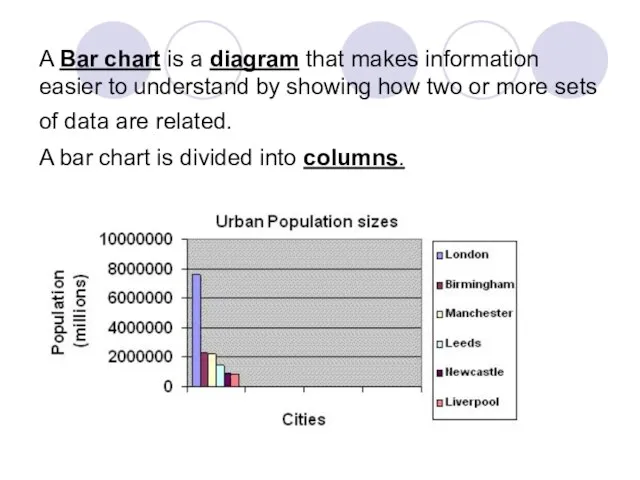
- 4. A Bar chart is a diagram that makes information easier to understand by showing how two
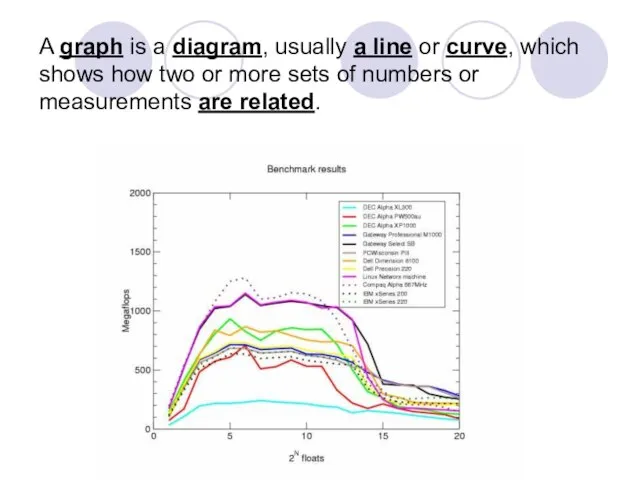
- 5. A graph is a diagram, usually a line or curve, which shows how two or more
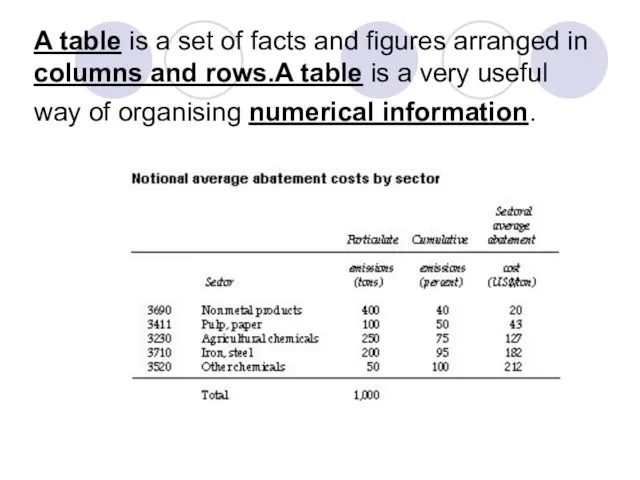
- 6. A table is a set of facts and figures arranged in columns and rows.A table is
- 7. What is a trend? Trends are the changes or movements in facts and figures over a
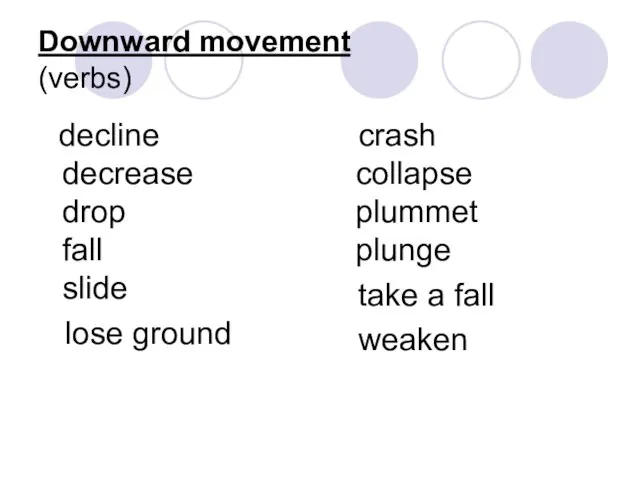
- 8. Downward movement (verbs) decline decrease drop fall slide lose ground crash collapse plummet plunge take a
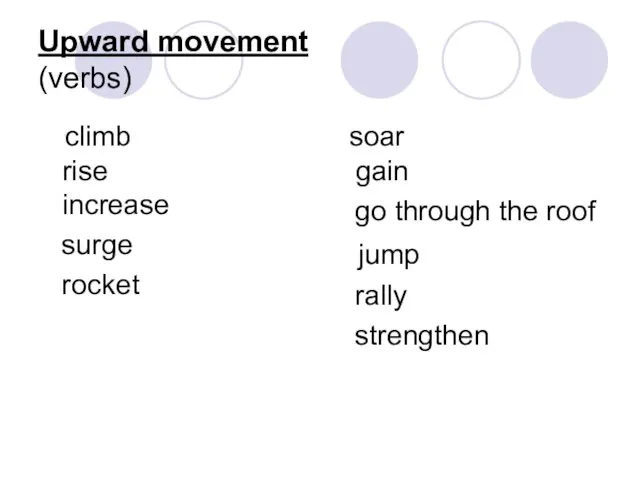
- 9. Upward movement (verbs) climb rise increase surge rocket soar gain go through the roof jump rally
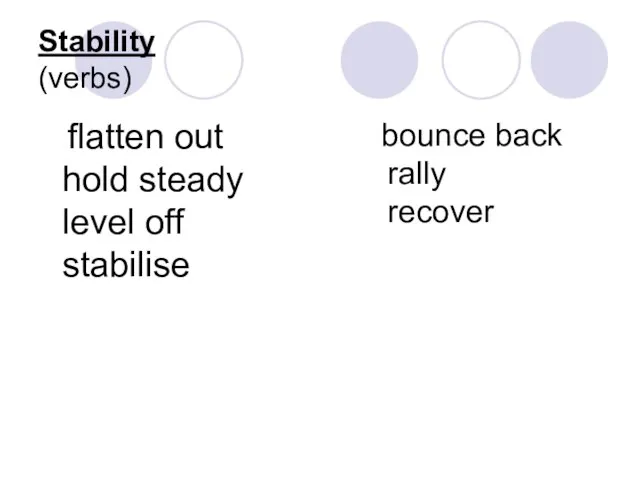
- 10. Stability (verbs) flatten out hold steady level off stabilise bounce back rally recover
- 12. Скачать презентацию
Слайд 3A pie chart is a circle divided into segments. It is usually
A pie chart is a circle divided into segments. It is usually
Слайд 4A Bar chart is a diagram that makes information easier to understand
A Bar chart is a diagram that makes information easier to understand
Слайд 5A graph is a diagram, usually a line or curve, which shows
A graph is a diagram, usually a line or curve, which shows
Слайд 6A table is a set of facts and figures arranged in columns
A table is a set of facts and figures arranged in columns
Слайд 7What is a trend?
Trends are the changes or movements in facts and
What is a trend?
Trends are the changes or movements in facts and
Слайд 8Downward movement
(verbs)
decline
decrease
drop
fall
slide
lose ground
crash
collapse
plummet
plunge
take a fall
weaken
Downward movement
(verbs)
decline
decrease
drop
fall
slide
lose ground
crash
collapse
plummet
plunge
take a fall
weaken
Слайд 9Upward movement
(verbs)
climb
rise
increase
surge
rocket
soar
gain
go through the roof
jump
Upward movement
(verbs)
climb
rise
increase
surge
rocket
soar
gain
go through the roof
jump
Слайд 10Stability
(verbs)
flatten out
hold steady
level off
stabilise
bounce back
rally
recover
Stability
(verbs)
flatten out
hold steady
level off
stabilise
bounce back
rally
recover
 Культура и образование
 Научно-исследовательская деятельность. Оформление исследовательской работы
 Основные положения молекулярно-кинетической теории. Размеры молекул
 ОТЧЕТ «Результаты проведенного опроса действительных и потенциальных участников НИС». Период проведения: с 22 мая 2012 г. по 15 июня 2
 Культура, здоровье, красота
 Бета, релиз, Post Productionс точки зрения QA.
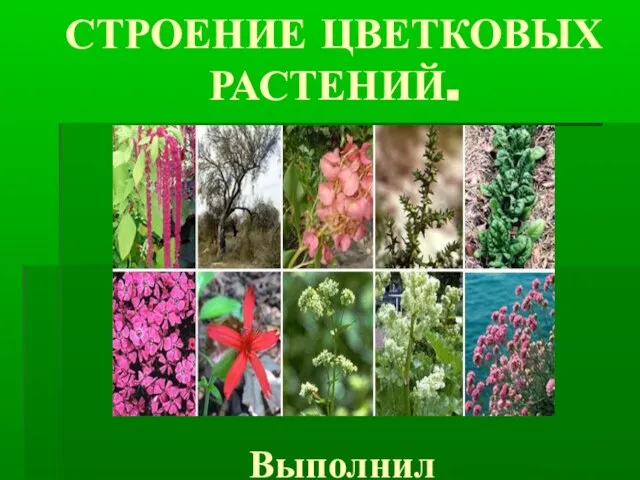 Презентация на тему Строение цветковых растений
 Презентация для годового собрания товарищества собственников ТС Новая Боровая
 Презентация на тему Права и обязанности родителей и законных представителей по воспитанию и образованию детей
 Относительные и абсолютные показатели
 Организация аукционов на право аренды под размещение объектов средней и крупной розничной торговли.
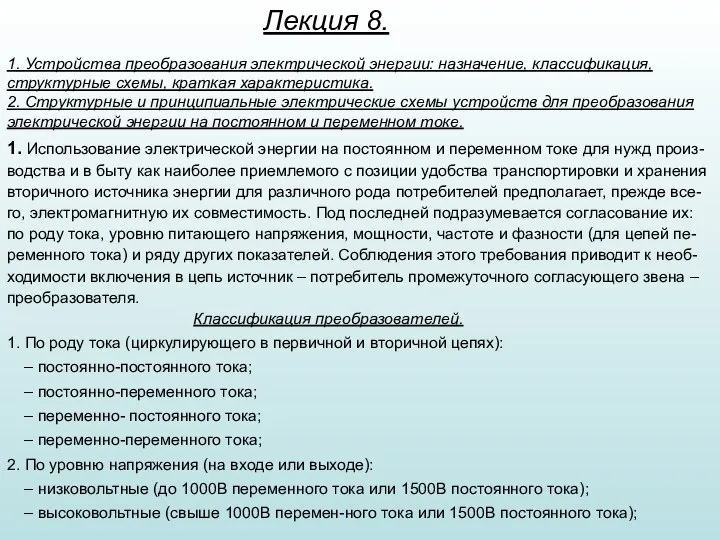 Устройства преобразования электрической энергии: назначение, классификация, структурные схемы. (Лекция 8)
 Овощи в диетическом питании
 Анализ наружной рекламы немецких автомобилей
  Презентация на тему ТРАНСФОРМАЦИОННЫЙ СПАД И ЭКОНОМИЧЕСКИЙ КРИЗИС: ОБЩЕЕ И РАЗЛИЧИя
 «Пираты физического моря»
 ГОУ СПОКолледжтуризма и гостиничного сервиса Санкт-Петербурга
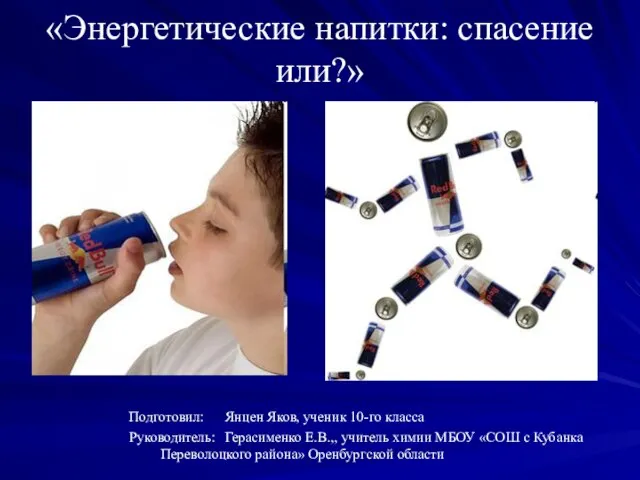 Энергетические напитки: спасение или?
 Фонетик күнегеү
 Упражнения на закрепление знаний о наречии
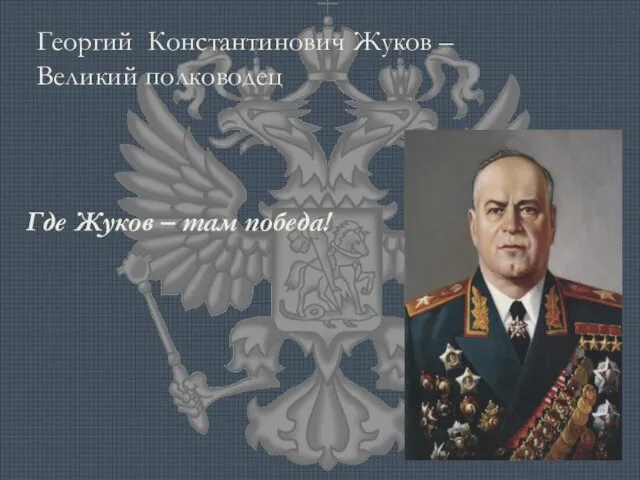 Георгий Константинович Жуков – Великий полководец
 Нормативно-документальное обеспечение сетевого взаимодействия в МАДОУ № 83
 Программные средства для управления жизненным циклом приложений (Application lifecycle management -ALM)
 Важнейшие географические открытия. Марко Поло и его путешествия.
 Краткая энциклопедия от А до Z.
 Административная этика
 Масленица. История масленицы
 SHORT-RUN ECONOMIC FLUCTUATIONS