- Introduction to Statistics

Содержание
- 2. seminars: Wednesday – face-to-face seminars at FEM Thursday 12:15 – online in MS Teams link: seminar
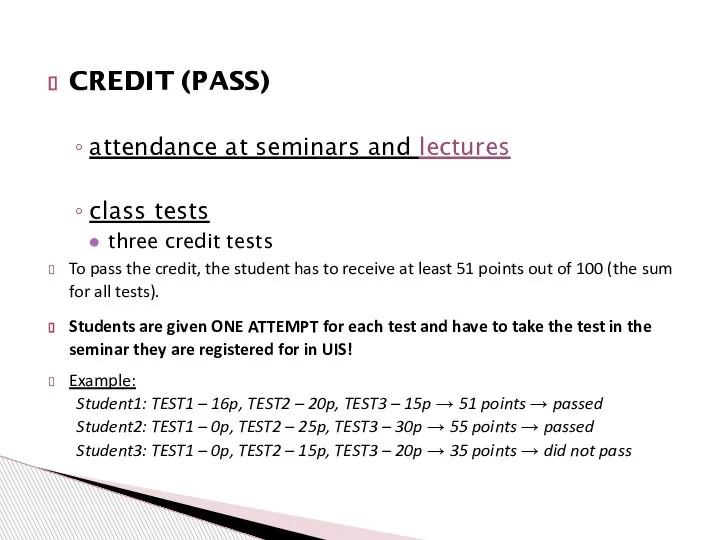
- 3. CREDIT (PASS) attendance at seminars and lectures class tests three credit tests To pass the credit,
- 4. EXAMINATION oral – project defence
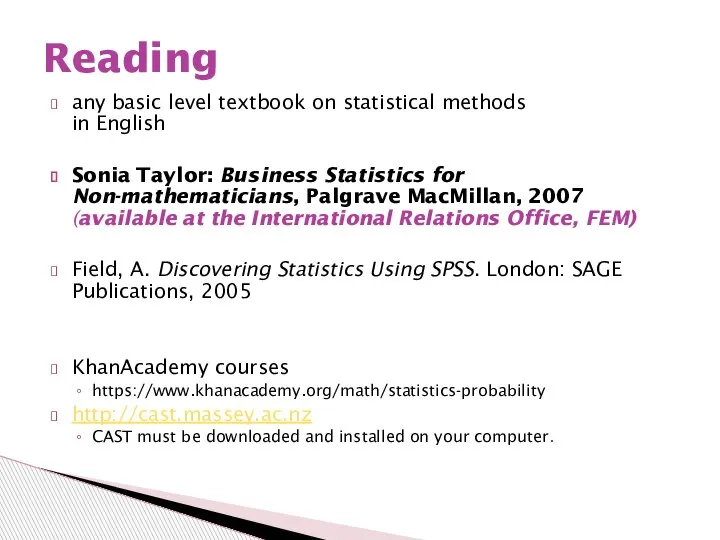
- 5. any basic level textbook on statistical methods in English Sonia Taylor: Business Statistics for Non-mathematicians, Palgrave
- 6. https://moodle.czu.cz/ IBM SPSS Statistics
- 7. Introduction to Statistics
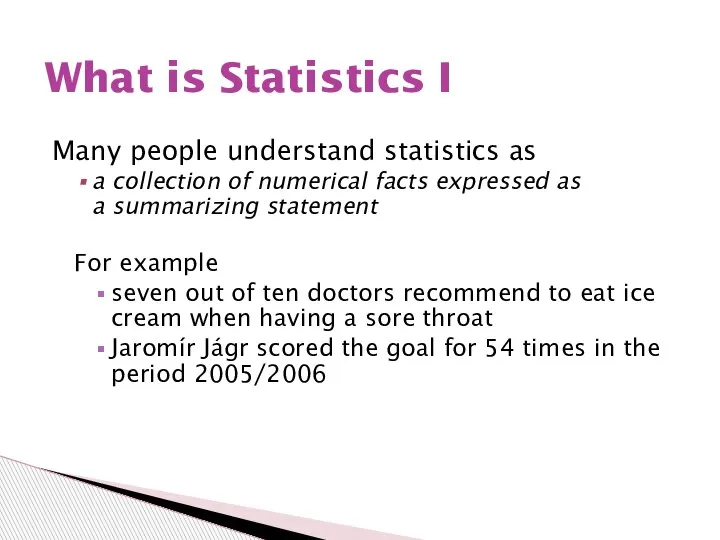
- 8. Many people understand statistics as a collection of numerical facts expressed as a summarizing statement For
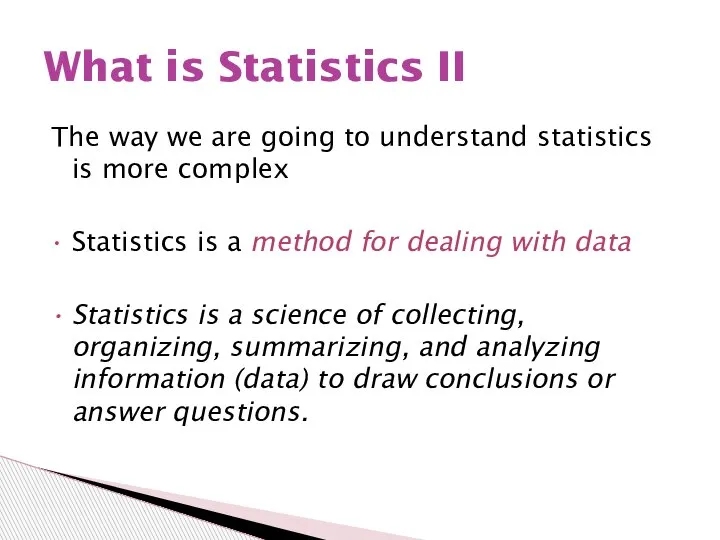
- 9. The way we are going to understand statistics is more complex Statistics is a method for
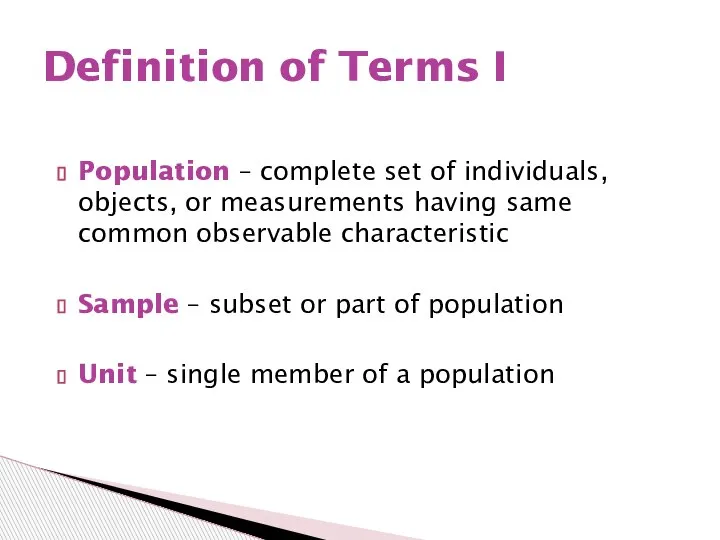
- 10. Population – complete set of individuals, objects, or measurements having same common observable characteristic Sample –
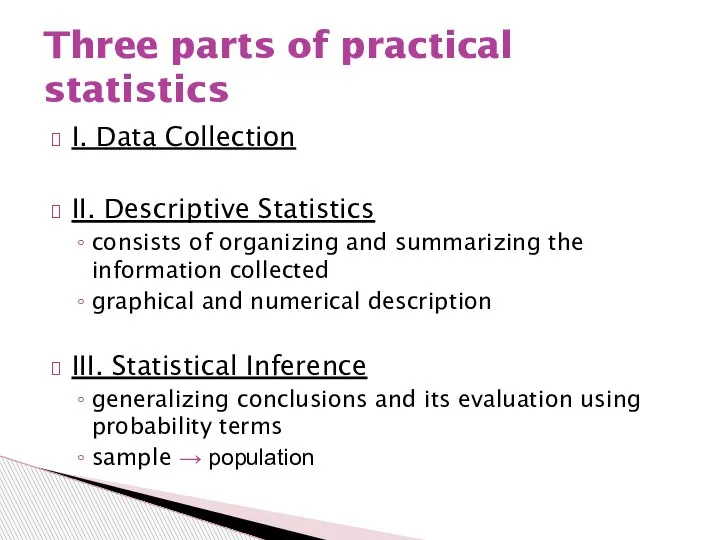
- 11. I. Data Collection II. Descriptive Statistics consists of organizing and summarizing the information collected graphical and
- 12. a census survey samples designed experiments existing data sources 1. Data Collection
- 13. simple random sample stratified sample systematic sample cluster sample Sampling
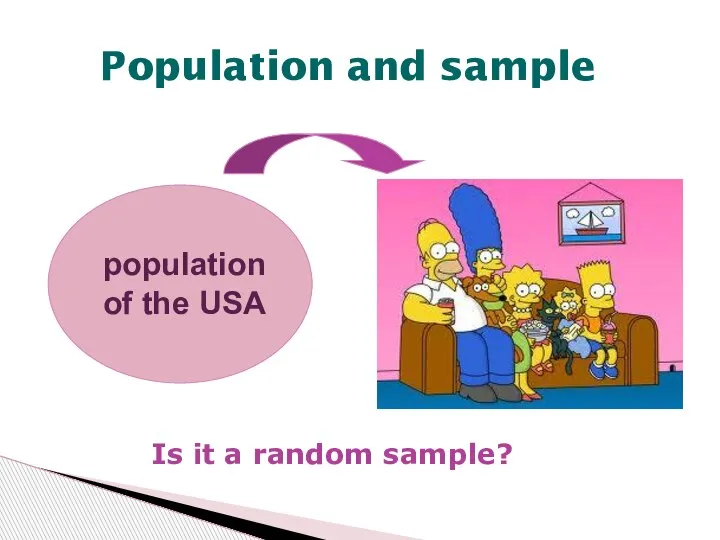
- 14. Population and sample population of the USA Is it a random sample?
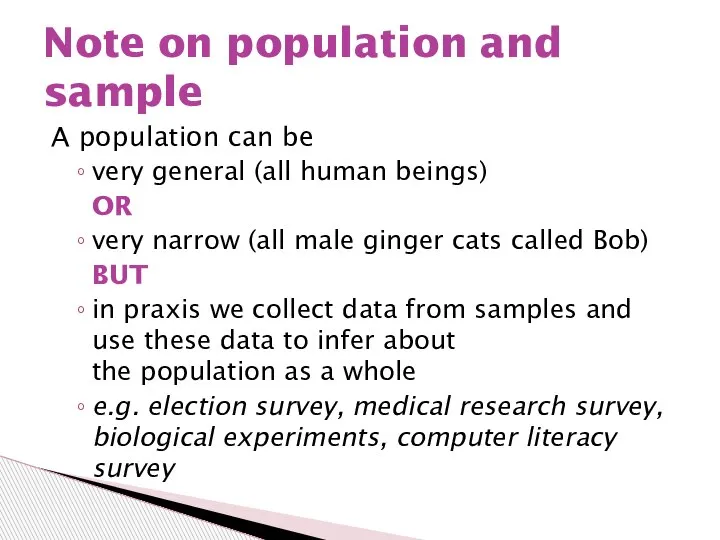
- 15. A population can be very general (all human beings) OR very narrow (all male ginger cats
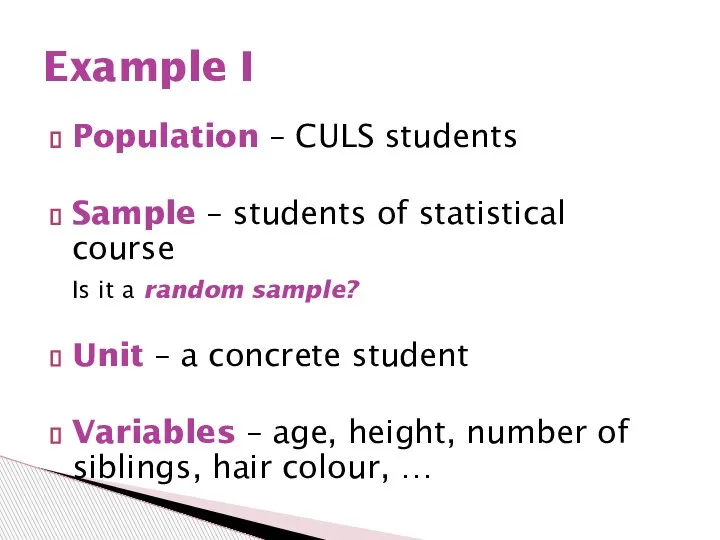
- 16. Population – CULS students Sample – students of statistical course Is it a random sample? Unit
- 17. methods used to describe and graph the data depend on the type of a variable 1.
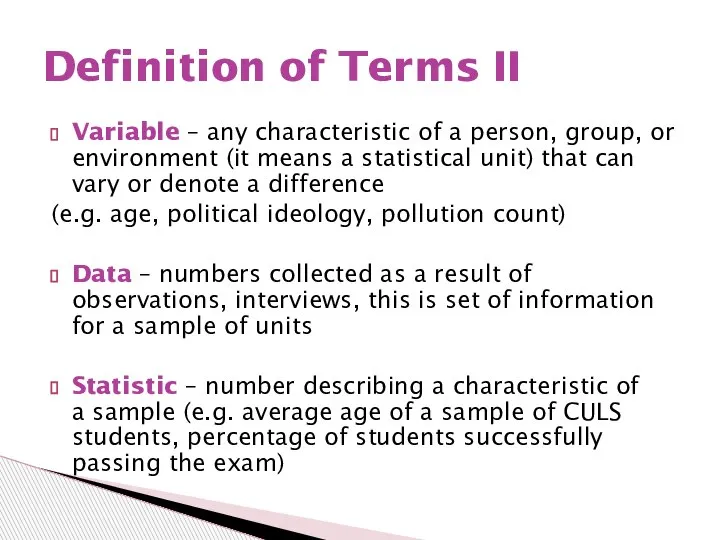
- 18. Variable – any characteristic of a person, group, or environment (it means a statistical unit) that
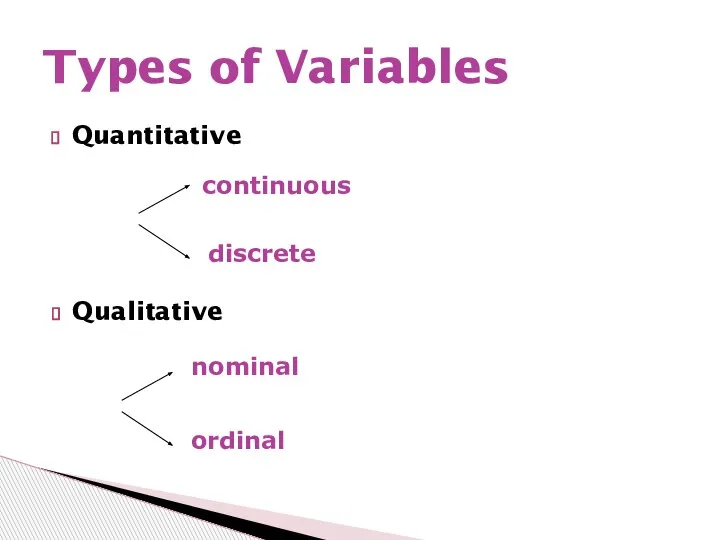
- 19. Quantitative Types of Variables Qualitative continuous discrete nominal ordinal
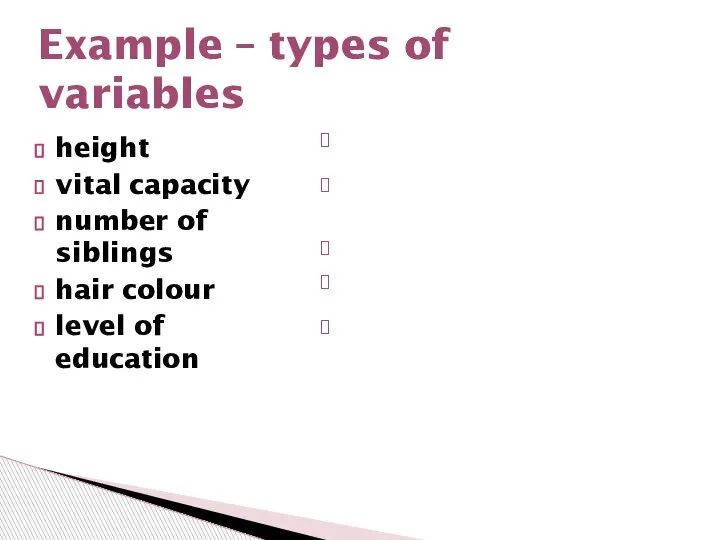
- 20. height vital capacity number of siblings hair colour level of education Example – types of variables
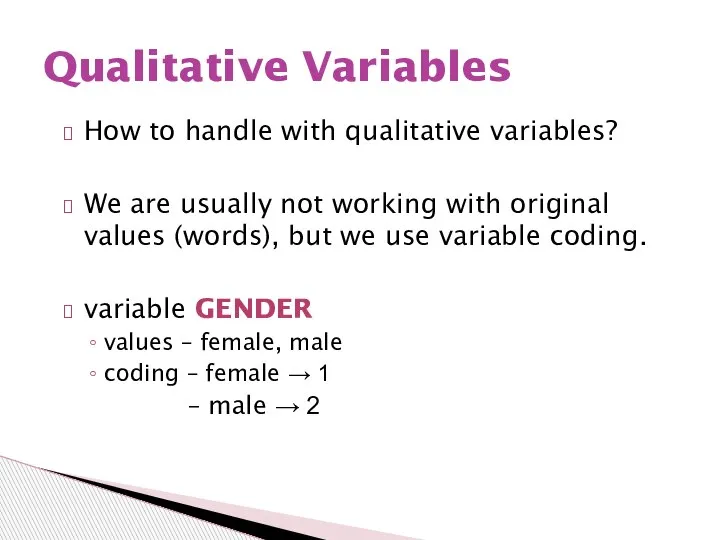
- 21. How to handle with qualitative variables? We are usually not working with original values (words), but
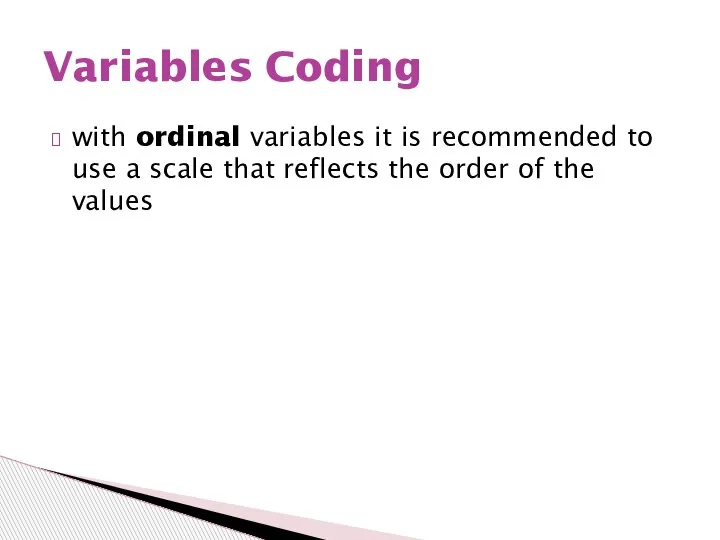
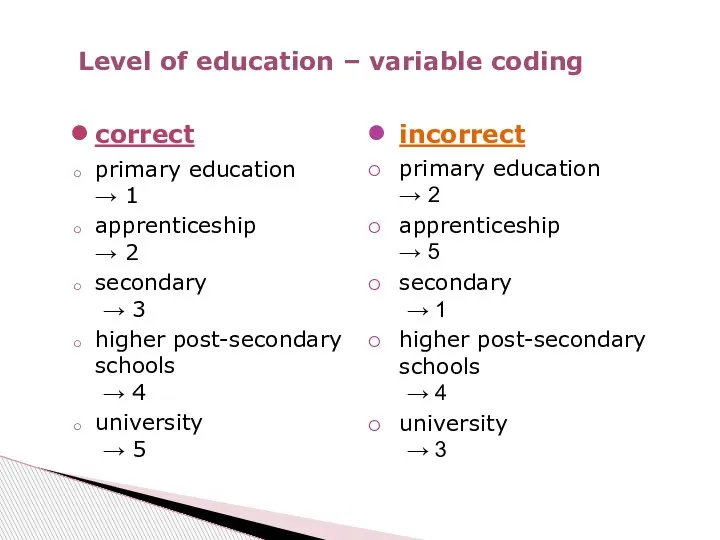
- 22. with ordinal variables it is recommended to use a scale that reflects the order of the
- 23. correct primary education → 1 apprenticeship → 2 secondary → 3 higher post-secondary schools → 4
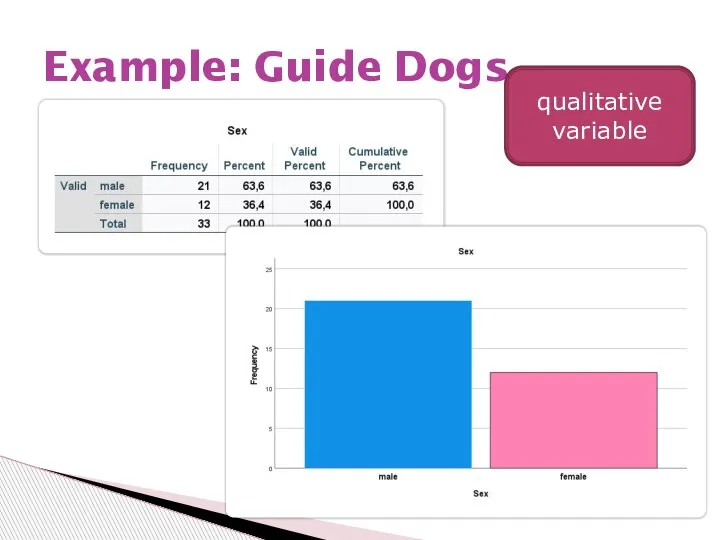
- 24. Example: Guide Dogs qualitative variable
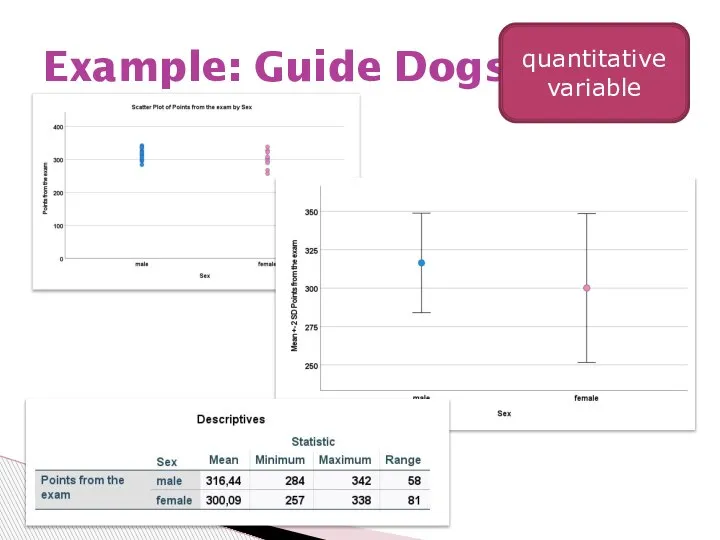
- 25. Example: Guide Dogs quantitative variable
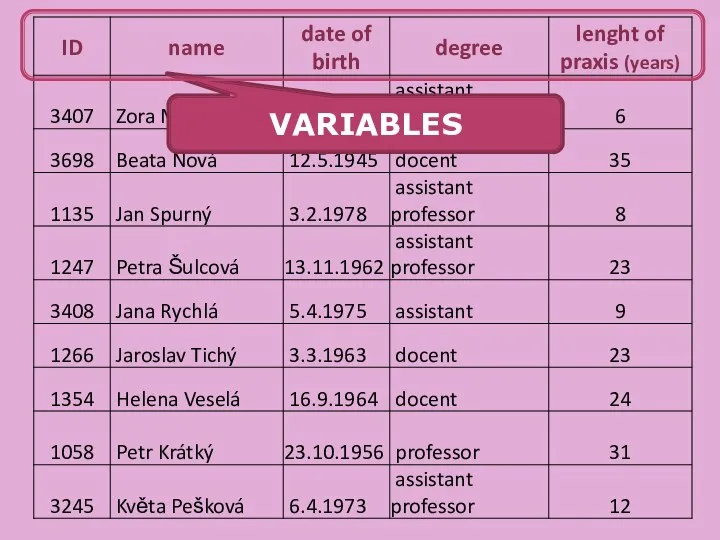
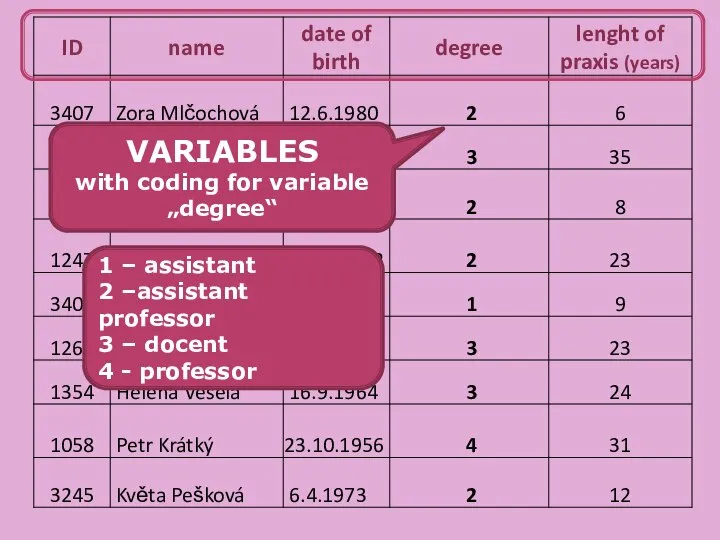
- 26. VARIABLES
- 27. VARIABLES with coding for variable „degree“ 1 – assistant 2 –assistant professor 3 – docent 4
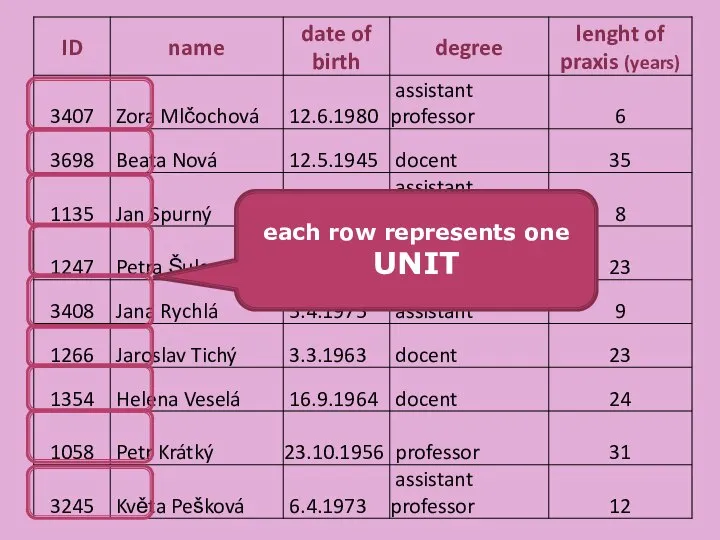
- 28. each row represents one UNIT
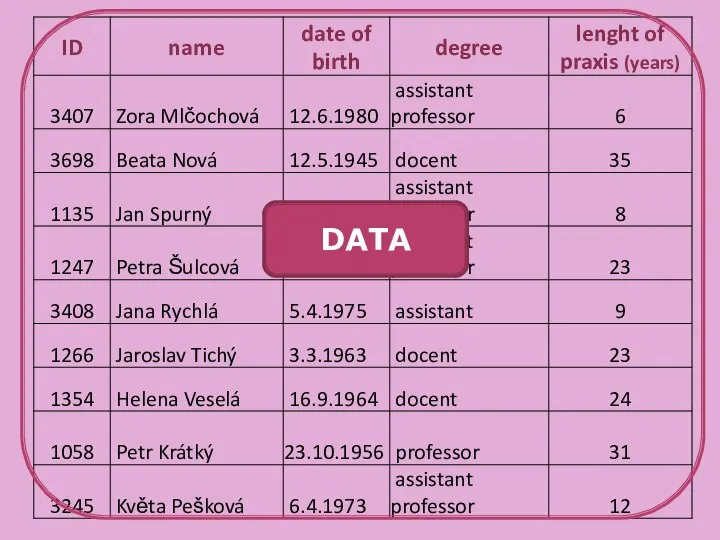
- 29. DATA
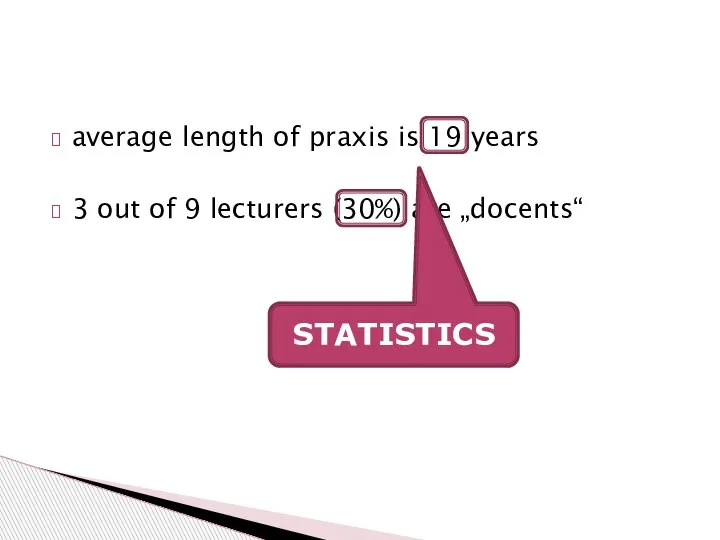
- 30. average length of praxis is 19 years 3 out of 9 lecturers (30%) are „docents“ STATISTICS
- 31. Inferential statistics uses methods that take the results obtained from a sample, extend them to the
- 33. Скачать презентацию
Слайд 3CREDIT (PASS)
attendance at seminars and lectures
class tests
three credit tests
To pass the credit,
CREDIT (PASS)
attendance at seminars and lectures
class tests
three credit tests
To pass the credit,
Слайд 4EXAMINATION
oral – project defence
EXAMINATION
oral – project defence

Слайд 5any basic level textbook on statistical methods
in English
Sonia Taylor: Business Statistics
any basic level textbook on statistical methods
in English
Sonia Taylor: Business Statistics
Слайд 6https://moodle.czu.cz/
IBM SPSS Statistics
https://moodle.czu.cz/
IBM SPSS Statistics
Слайд 7Introduction to Statistics
Introduction to Statistics
Слайд 8Many people understand statistics as
a collection of numerical facts expressed as
a
Many people understand statistics as
a collection of numerical facts expressed as
a
Слайд 9The way we are going to understand statistics is more complex
Statistics is
The way we are going to understand statistics is more complex
Statistics is
Слайд 10Population – complete set of individuals, objects, or measurements having same common
Слайд 11I. Data Collection
II. Descriptive Statistics
consists of organizing and summarizing the information collected
graphical
I. Data Collection
II. Descriptive Statistics
consists of organizing and summarizing the information collected
graphical
Слайд 12a census
survey samples
designed experiments
existing data sources
1. Data Collection
a census
survey samples
designed experiments
existing data sources
1. Data Collection
Слайд 13simple random sample
stratified sample
systematic sample
cluster sample
Sampling
simple random sample
stratified sample
systematic sample
cluster sample
Sampling
Слайд 14Population and sample
population
of the USA
Is it a random sample?
Population and sample
population
of the USA
Is it a random sample?
Слайд 15A population can be
very general (all human beings)
OR
very narrow (all male ginger
A population can be
very general (all human beings)
OR
very narrow (all male ginger
Слайд 16Population – CULS students
Sample – students of statistical course
Is it a
Population – CULS students
Sample – students of statistical course
Is it a
Слайд 17methods used to describe and graph the data depend on the type
methods used to describe and graph the data depend on the type
Слайд 18Variable – any characteristic of a person, group, or environment (it means
Variable – any characteristic of a person, group, or environment (it means
Слайд 19Quantitative
Types of Variables
Qualitative
continuous
discrete
nominal
ordinal
Quantitative
Types of Variables
Qualitative
continuous
discrete
nominal
ordinal
Слайд 20height
vital capacity
number of siblings
hair colour
level of education
Example – types of variables
height
vital capacity
number of siblings
hair colour
level of education
Example – types of variables
Слайд 21How to handle with qualitative variables?
We are usually not working with original
How to handle with qualitative variables?
We are usually not working with original
Слайд 22with ordinal variables it is recommended to use a scale that reflects
with ordinal variables it is recommended to use a scale that reflects
Слайд 23correct
primary education
→ 1
apprenticeship
→ 2
secondary
→ 3
higher post-secondary schools
→ 4
university
correct
primary education
→ 1
apprenticeship
→ 2
secondary
→ 3
higher post-secondary schools
→ 4
university
Слайд 24Example: Guide Dogs
qualitative variable
Example: Guide Dogs
qualitative variable
Слайд 25Example: Guide Dogs
quantitative variable
Example: Guide Dogs
quantitative variable
Слайд 26VARIABLES
VARIABLES
Слайд 27VARIABLES
with coding for variable „degree“
1 – assistant
2 –assistant professor
3 – docent
4 -
VARIABLES
with coding for variable „degree“
1 – assistant
2 –assistant professor
3 – docent
4 -
Слайд 28each row represents one UNIT
each row represents one UNIT
Слайд 29DATA
DATA
Слайд 30average length of praxis is 19 years
3 out of 9 lecturers (30%)
average length of praxis is 19 years
3 out of 9 lecturers (30%)
Слайд 31Inferential statistics uses methods that take the results obtained from a sample,
Inferential statistics uses methods that take the results obtained from a sample,
 Christmas what are they doing fun
 Чарльз Лэндри, автор книги «Креативный город»: «В ближайшие десятилетия сохранится лишь один из трех городов». 22 марта 2011, Цент
 Научный образовательный центр «Модернизация многомерного социально-политического пространства современной России» Руководит
 Совместная жизнь видов в биогеоценозе
 Задачи на движение
 ПРЕДУПРЕДИТЬ – ЗНАЧИТ СПАСТИ
 Автономная нервная система
  Палагайская школа вчера, сегодня, завтра
 Виды треугольников 3 класс
 Мировой кризис и нефтяной рынок
 10 заблуждений относительно цены
 ФГБУ Минмелиоводхоз РД. Министерство мелиорации земель и сельскохозяйственного водоснабжения Республики Дагестан
 Вложенные циклы
 ПРОЕКТ
 Отчёт по книге Искусство быть собой В.Л. Леви
 Сложные придаточные предложения (турецкий язык, урок №28)
 Организация обслуживания в общественном питании. Состояние потребительского рынка и перспективы развития индустрии питания
 Изменение архитектуры сибирских городов
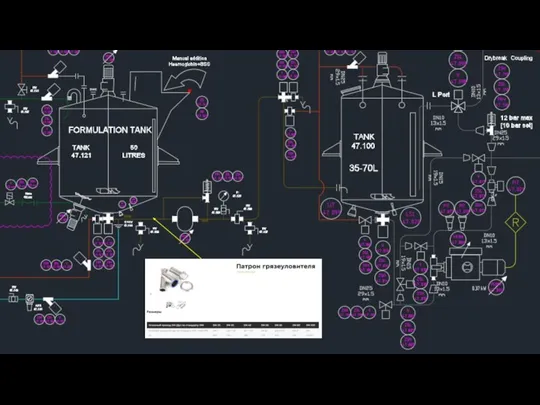 Патрон грязеуловителя
 Момент образования трещин в изгибаемых элементах по способу ядровых моментов
 Музей городской скульптуры
 «Сюжеты» и «герои» музыкальной формы
 Презентация на тему: Ради памяти родных
 источники+права
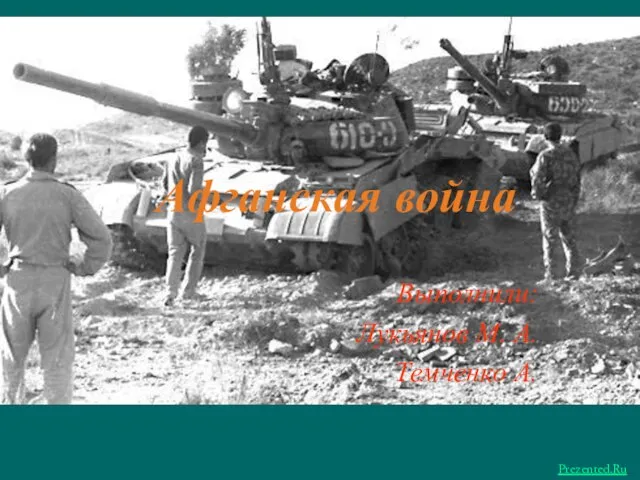 Презентация на тему Афганская война
 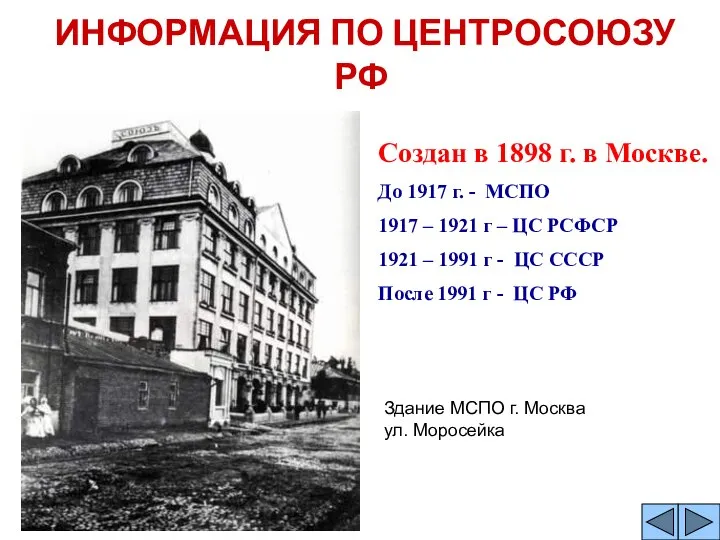 Центросоюз РФ. Предприятия собственного хозяйства центросоюза. Система потребительской кооперации Карелии
 http://www.gilev.ru
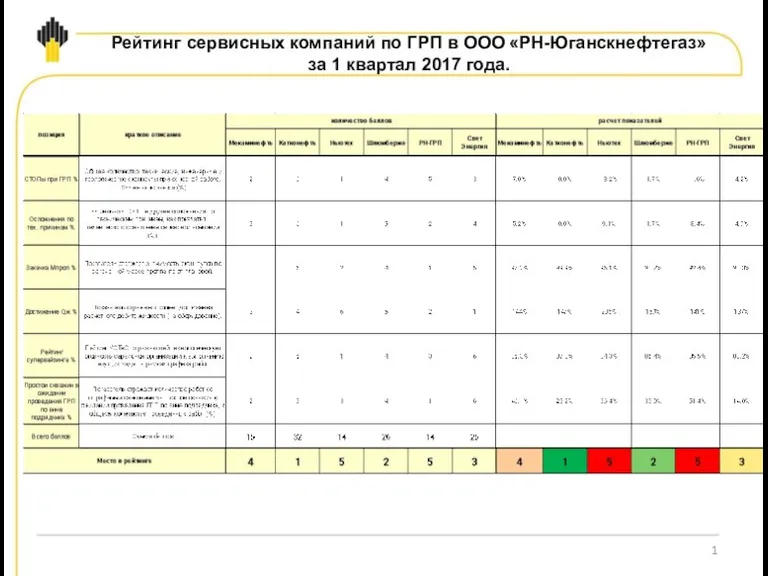 Рейтинг подрядчиков по ГРП за 1-й квартал 2017 года