- Standard deviation

Содержание
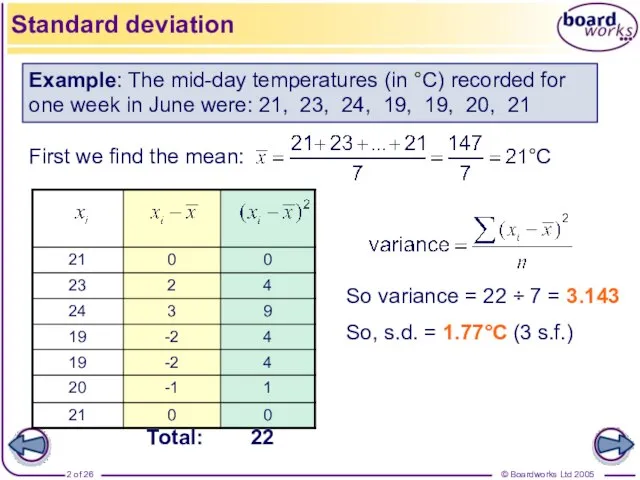
- 2. Total: 22 Example: The mid-day temperatures (in °C) recorded for one week in June were: 21,
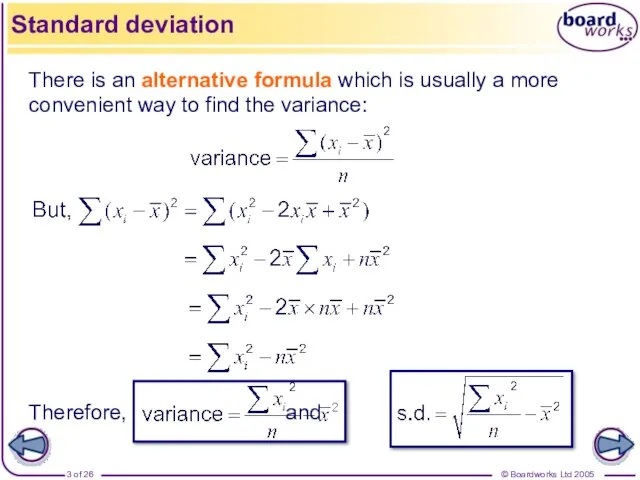
- 3. There is an alternative formula which is usually a more convenient way to find the variance:
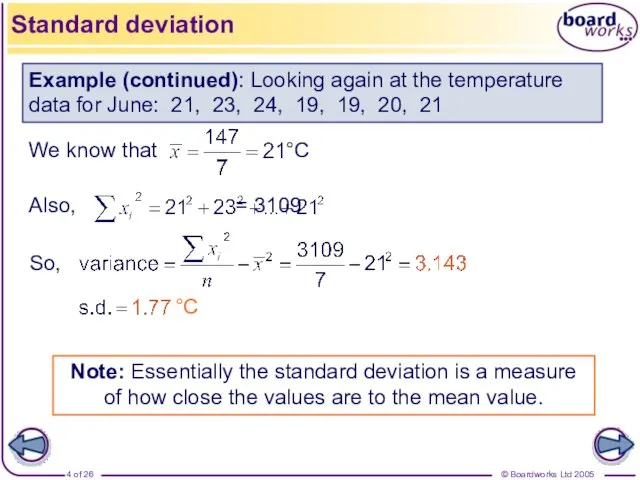
- 4. Example (continued): Looking again at the temperature data for June: 21, 23, 24, 19, 19, 20,
- 5. When the data is presented in a frequency table, the formula for finding the standard deviation
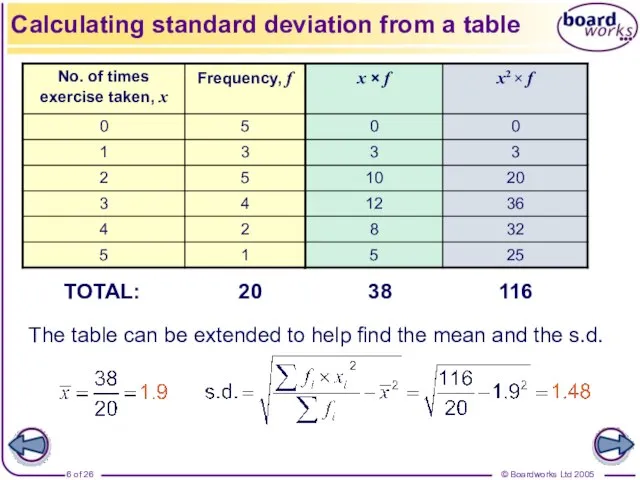
- 6. Calculating standard deviation from a table The table can be extended to help find the mean
- 9. Скачать презентацию
Слайд 3There is an alternative formula which is usually a more convenient way
There is an alternative formula which is usually a more convenient way
Слайд 4Example (continued): Looking again at the temperature data for June: 21, 23,
Example (continued): Looking again at the temperature data for June: 21, 23,
Слайд 5When the data is presented in a frequency table, the formula for
When the data is presented in a frequency table, the formula for
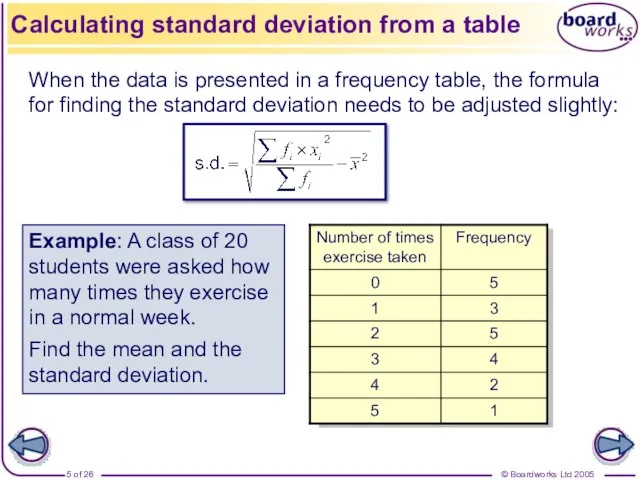
Слайд 6Calculating standard deviation from a table
The table can be extended to help
Calculating standard deviation from a table
The table can be extended to help
 Выборы в государственную думу РФ 2021
 Секция историков
 Возникновение переходных процессов. Законы коммутации и начальные условия. Лекция 12
 Шаблоны для уроков русский язык и литература 4
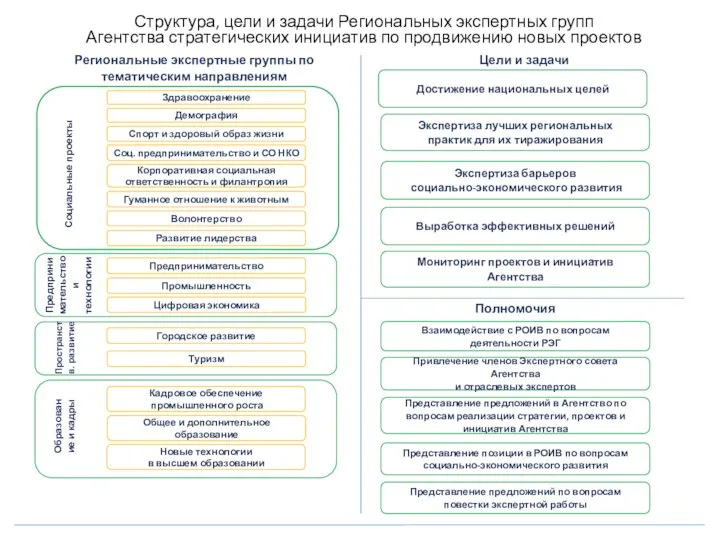 Структура, цели и задачи Региональных экспертных групп
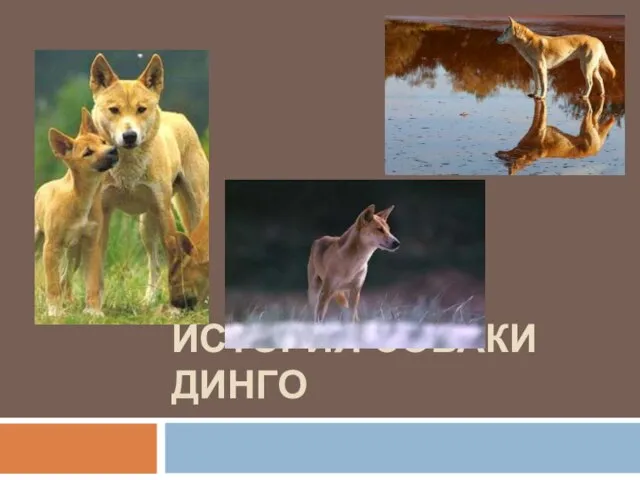 Презентация на тему История собаки динго
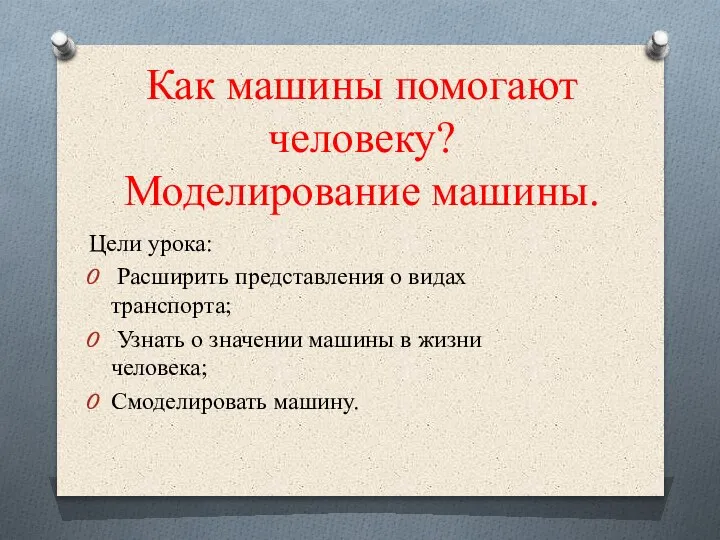 Как машины помогают человеку? Моделирование машины
 ЗАБАВНАЯ АРИФМЕТИКА ВЕСЁЛЫЕ СЧИТАЛКИ
 1
1 Соглашения о встречной торговле Подготовил: Мезенцев С.С., МЭ082
 Роль протеинов в питании спортсмена
 Сетевые акции
 Развитие способности решения задач на уроках математики
 Основные понятия теории речевой коммуникации. Коммуникация. Речевая коммуникация. (Лекция 1)
 Футбол - моя жизнь
 1. История о компании
 «Co временем любовь проходит. Любовь – это битва. Заранее проигранная… Сначала все прекрасно, даже вы сами. Вы только диву даетесь,
  Презентация на тему Понятие о системе здравоохранения РФ
  Общественные движения 1-й четверти XIX века
 Исследование процесса формирования культуры поведения в режиме дня у детей 5-6 лет
 Обновление содержания курса географии в УМК нового поколения
 Конституция Российской Федерации
 Разработка объединенного программного комплекса для определения стоимости ремонта ТС, программы тестирования специалистовпо о
 Тулово Туйпике
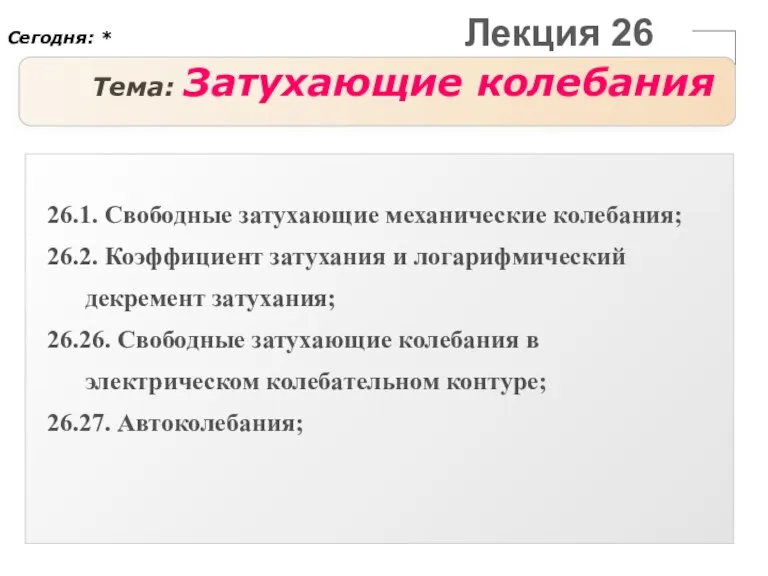 Затухающие колебания
 Принципы менеджмента в туризме
 Презентация на тему Русь и Золотая Орда (6 класс)
 Основы философии