- The market forses of supply and demand

Содержание
- 2. In this chapter, look for the answers to these questions: What factors affect buyers’ demand for
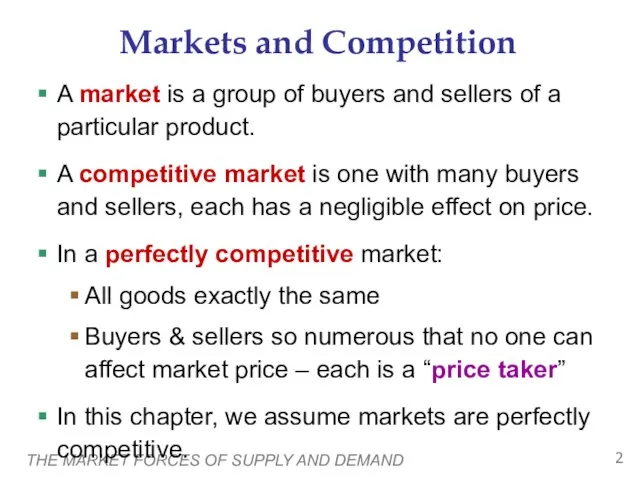
- 3. THE MARKET FORCES OF SUPPLY AND DEMAND Markets and Competition A market is a group of
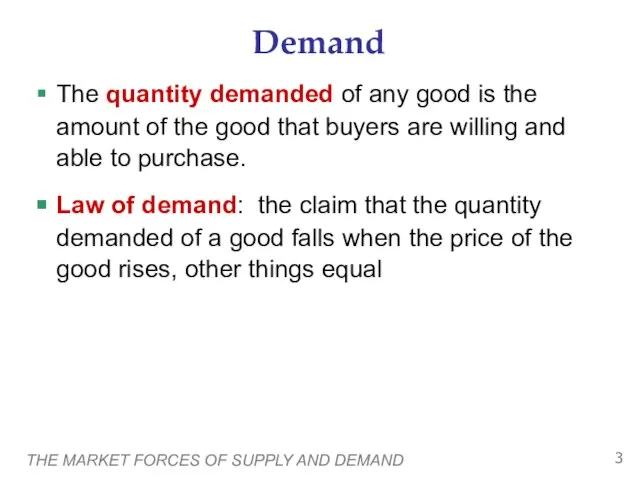
- 4. THE MARKET FORCES OF SUPPLY AND DEMAND Demand The quantity demanded of any good is the
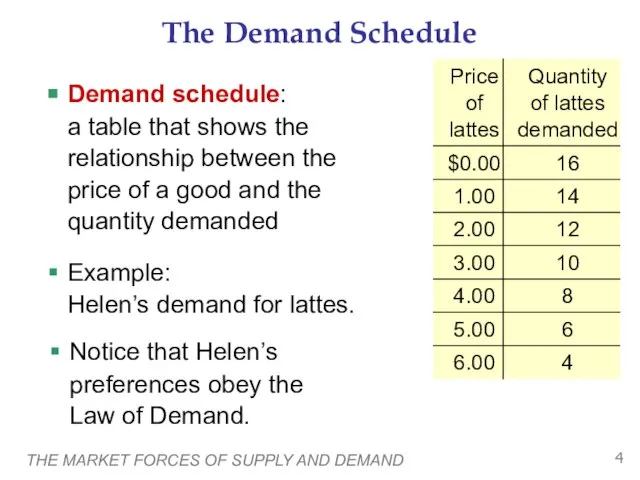
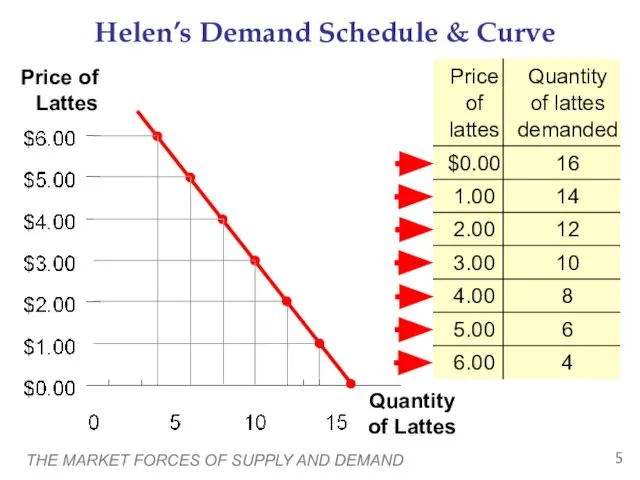
- 5. THE MARKET FORCES OF SUPPLY AND DEMAND The Demand Schedule Demand schedule: a table that shows
- 6. THE MARKET FORCES OF SUPPLY AND DEMAND Helen’s Demand Schedule & Curve
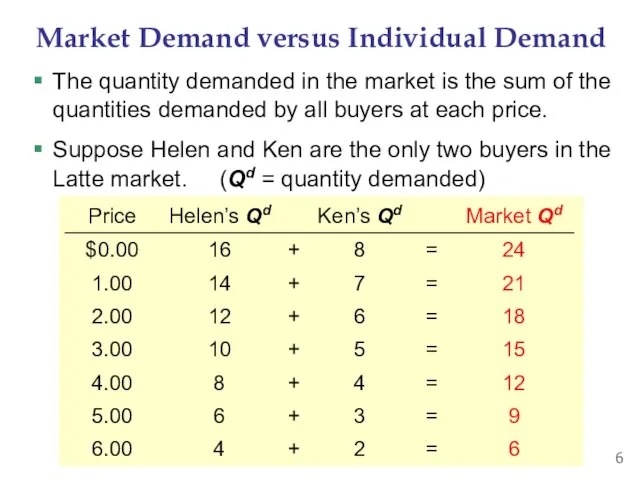
- 7. Market Demand versus Individual Demand The quantity demanded in the market is the sum of the
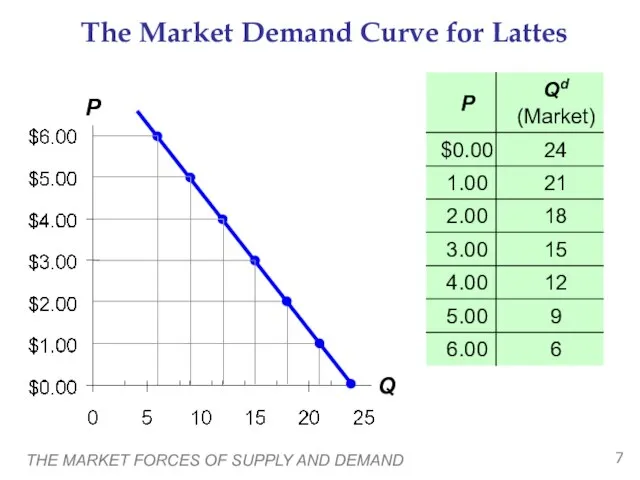
- 8. THE MARKET FORCES OF SUPPLY AND DEMAND P Q The Market Demand Curve for Lattes
- 9. THE MARKET FORCES OF SUPPLY AND DEMAND Demand Curve Shifters The demand curve shows how price
- 10. THE MARKET FORCES OF SUPPLY AND DEMAND Demand Curve Shifters: # of Buyers Increase in #
- 11. THE MARKET FORCES OF SUPPLY AND DEMAND Suppose the number of buyers increases. Then, at each
- 12. THE MARKET FORCES OF SUPPLY AND DEMAND Demand for a normal good is positively related to
- 13. THE MARKET FORCES OF SUPPLY AND DEMAND Two goods are substitutes if an increase in the
- 14. THE MARKET FORCES OF SUPPLY AND DEMAND Two goods are complements if an increase in the
- 15. THE MARKET FORCES OF SUPPLY AND DEMAND Anything that causes a shift in tastes toward a
- 16. THE MARKET FORCES OF SUPPLY AND DEMAND Expectations affect consumers’ buying decisions. Examples: If people expect
- 17. THE MARKET FORCES OF SUPPLY AND DEMAND Summary: Variables That Influence Buyers Variable A change in
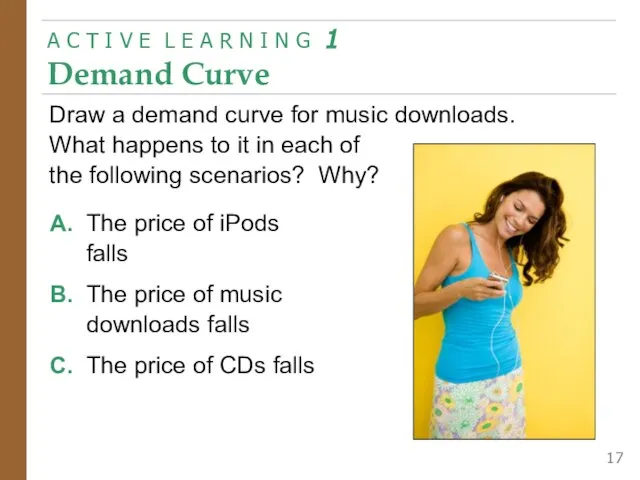
- 18. A. The price of iPods falls B. The price of music downloads falls C. The price
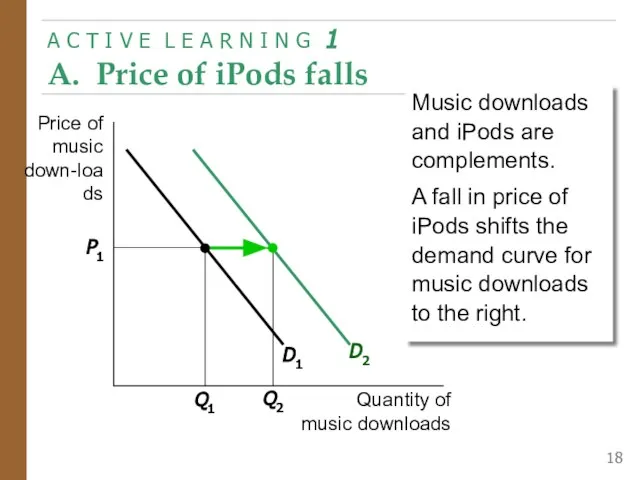
- 19. A C T I V E L E A R N I N G 1 A.
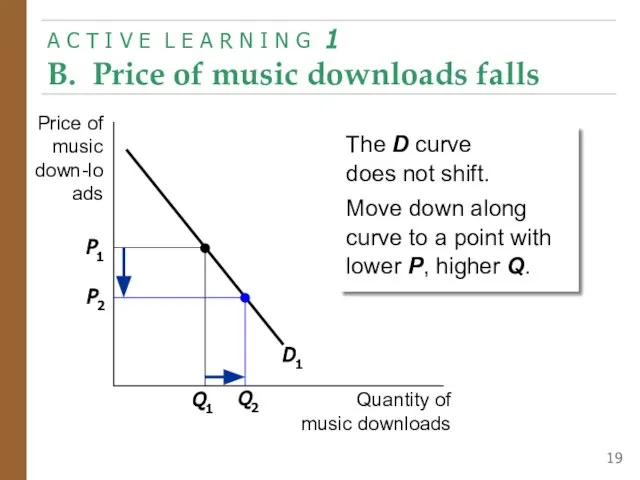
- 20. A C T I V E L E A R N I N G 1 B.
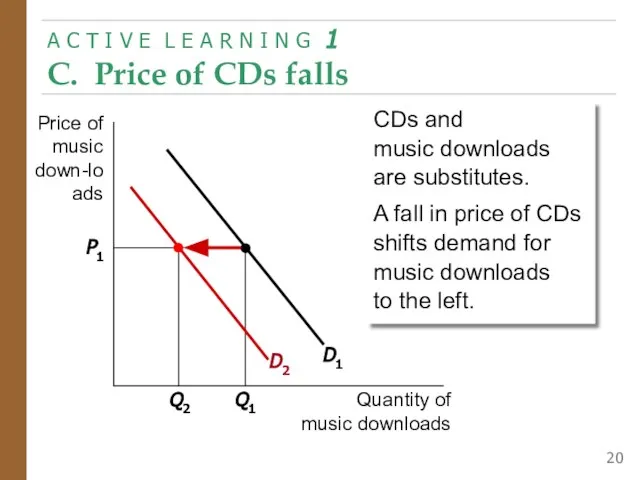
- 21. A C T I V E L E A R N I N G 1 C.
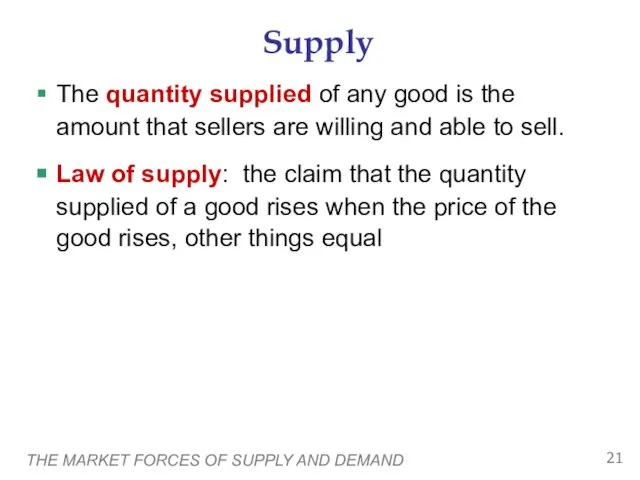
- 22. THE MARKET FORCES OF SUPPLY AND DEMAND Supply The quantity supplied of any good is the
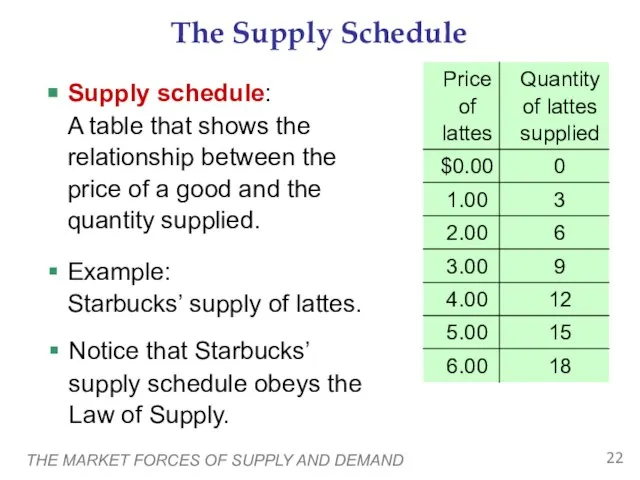
- 23. THE MARKET FORCES OF SUPPLY AND DEMAND The Supply Schedule Supply schedule: A table that shows
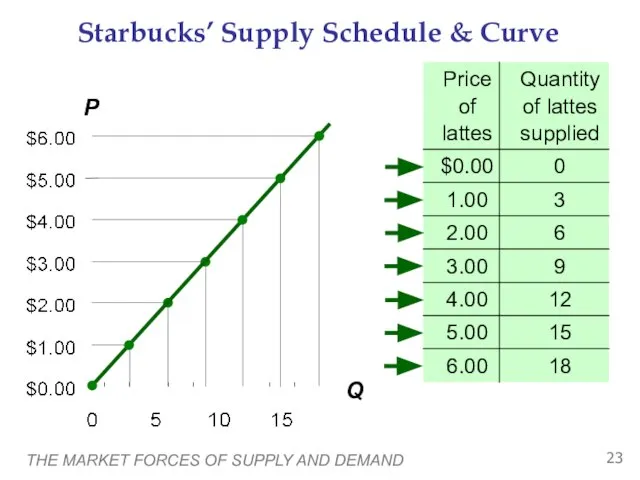
- 24. THE MARKET FORCES OF SUPPLY AND DEMAND Starbucks’ Supply Schedule & Curve P Q
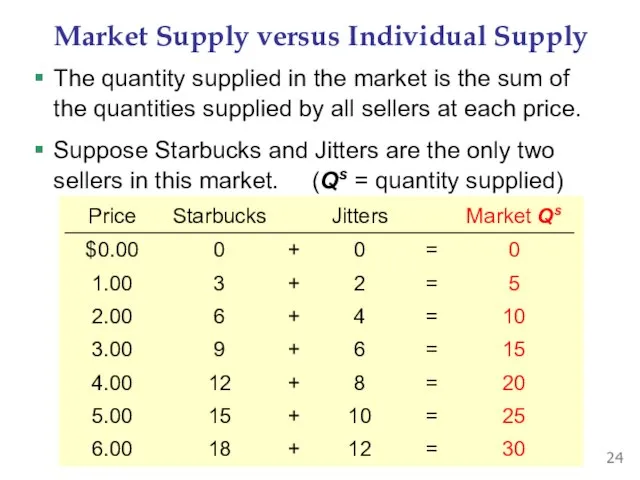
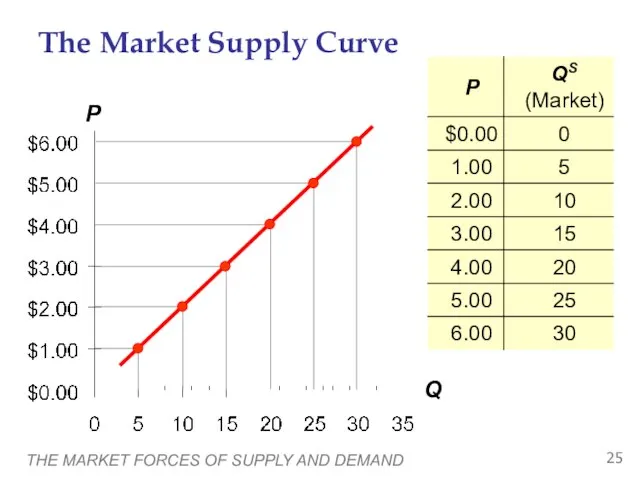
- 25. Market Supply versus Individual Supply The quantity supplied in the market is the sum of the
- 26. THE MARKET FORCES OF SUPPLY AND DEMAND The Market Supply Curve
- 27. THE MARKET FORCES OF SUPPLY AND DEMAND Supply Curve Shifters The supply curve shows how price
- 28. THE MARKET FORCES OF SUPPLY AND DEMAND Supply Curve Shifters: Input Prices Examples of input prices:
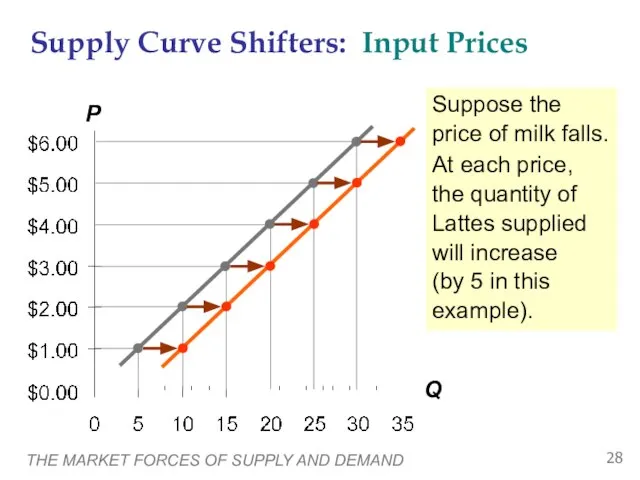
- 29. THE MARKET FORCES OF SUPPLY AND DEMAND Suppose the price of milk falls. At each price,
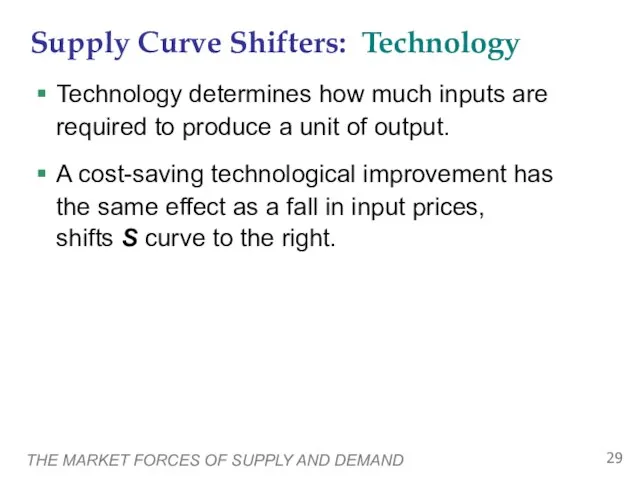
- 30. THE MARKET FORCES OF SUPPLY AND DEMAND Supply Curve Shifters: Technology Technology determines how much inputs
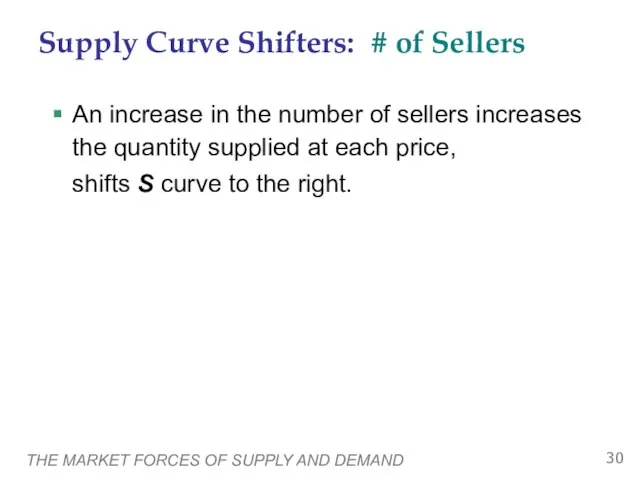
- 31. THE MARKET FORCES OF SUPPLY AND DEMAND Supply Curve Shifters: # of Sellers An increase in
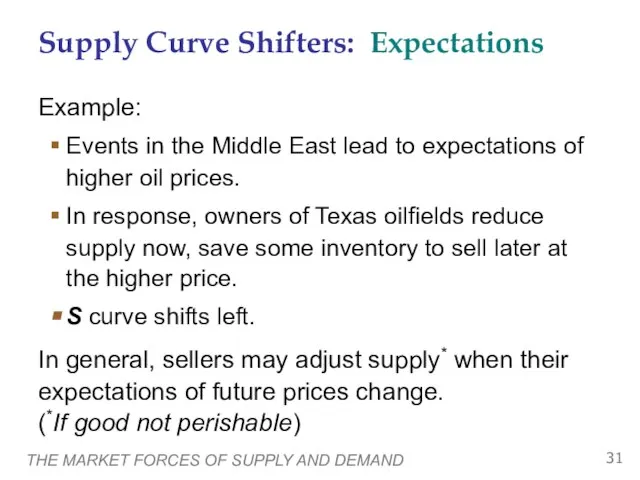
- 32. THE MARKET FORCES OF SUPPLY AND DEMAND Supply Curve Shifters: Expectations Example: Events in the Middle
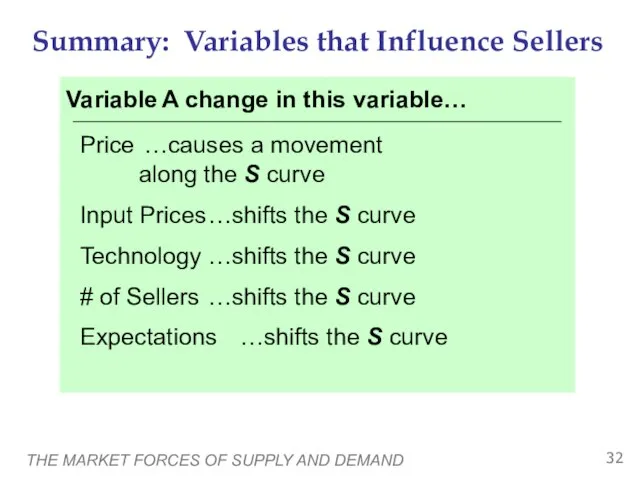
- 33. THE MARKET FORCES OF SUPPLY AND DEMAND Summary: Variables that Influence Sellers Variable A change in
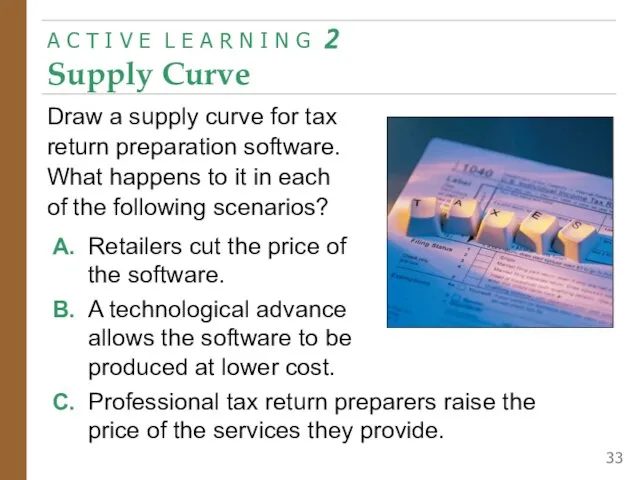
- 34. A C T I V E L E A R N I N G 2 Supply
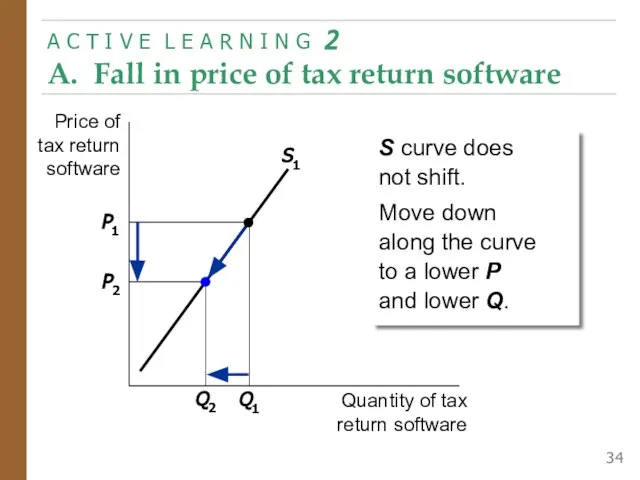
- 35. A C T I V E L E A R N I N G 2 A.
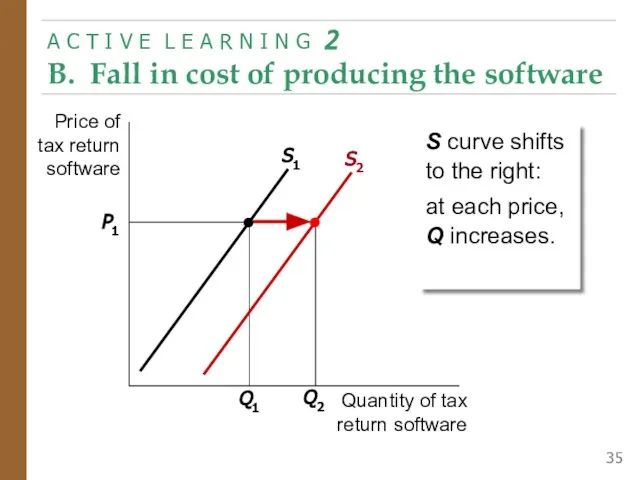
- 36. A C T I V E L E A R N I N G 2 B.
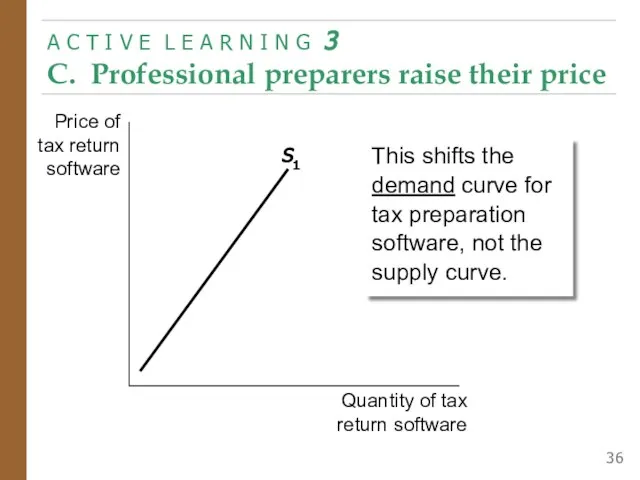
- 37. A C T I V E L E A R N I N G 3 C.
- 38. THE MARKET FORCES OF SUPPLY AND DEMAND Supply and Demand Together Equilibrium: P has reached the
- 39. THE MARKET FORCES OF SUPPLY AND DEMAND Equilibrium price: the price that equates quantity supplied with
- 40. THE MARKET FORCES OF SUPPLY AND DEMAND Equilibrium quantity: the quantity supplied and quantity demanded at
- 41. THE MARKET FORCES OF SUPPLY AND DEMAND Surplus (a.k.a. excess supply): when quantity supplied is greater
- 42. THE MARKET FORCES OF SUPPLY AND DEMAND Surplus (a.k.a. excess supply): when quantity supplied is greater
- 43. THE MARKET FORCES OF SUPPLY AND DEMAND Surplus (a.k.a. excess supply): when quantity supplied is greater
- 44. THE MARKET FORCES OF SUPPLY AND DEMAND Shortage (a.k.a. excess demand): when quantity demanded is greater
- 45. THE MARKET FORCES OF SUPPLY AND DEMAND Shortage (a.k.a. excess demand): when quantity demanded is greater
- 46. THE MARKET FORCES OF SUPPLY AND DEMAND Shortage (a.k.a. excess demand): when quantity demanded is greater
- 47. THE MARKET FORCES OF SUPPLY AND DEMAND Three Steps to Analyzing Changes in Eq’m To determine
- 48. THE MARKET FORCES OF SUPPLY AND DEMAND EXAMPLE: The Market for Hybrid Cars
- 49. THE MARKET FORCES OF SUPPLY AND DEMAND STEP 1: D curve shifts because price of gas
- 50. THE MARKET FORCES OF SUPPLY AND DEMAND EXAMPLE 1: A Shift in Demand P2 Q2 Notice:
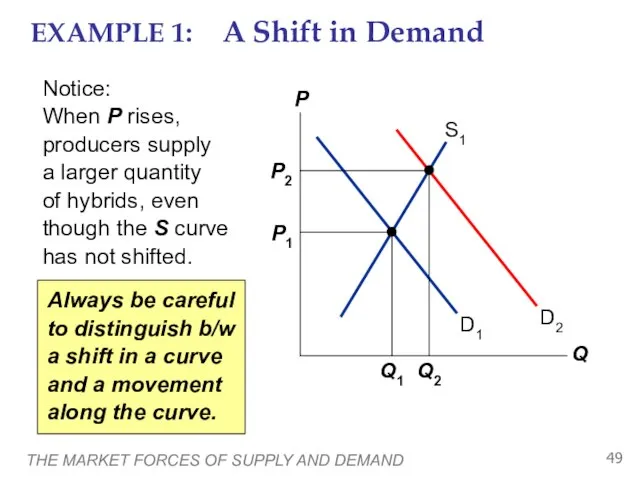
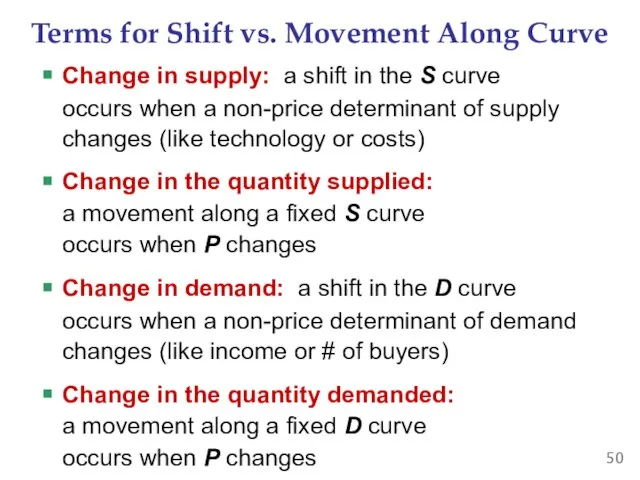
- 51. Terms for Shift vs. Movement Along Curve Change in supply: a shift in the S curve
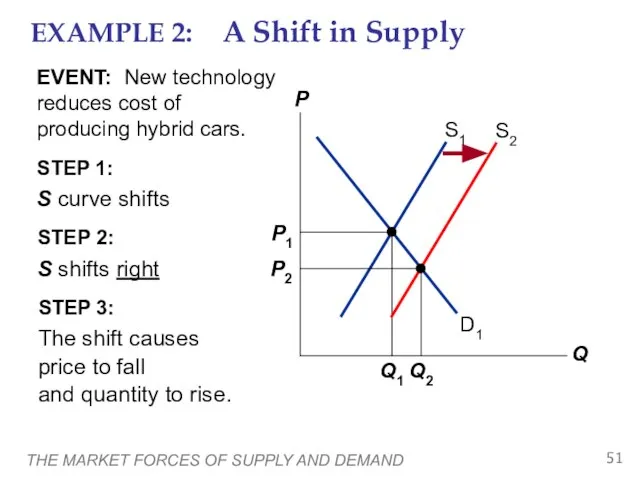
- 52. THE MARKET FORCES OF SUPPLY AND DEMAND STEP 1: S curve shifts because event affects cost
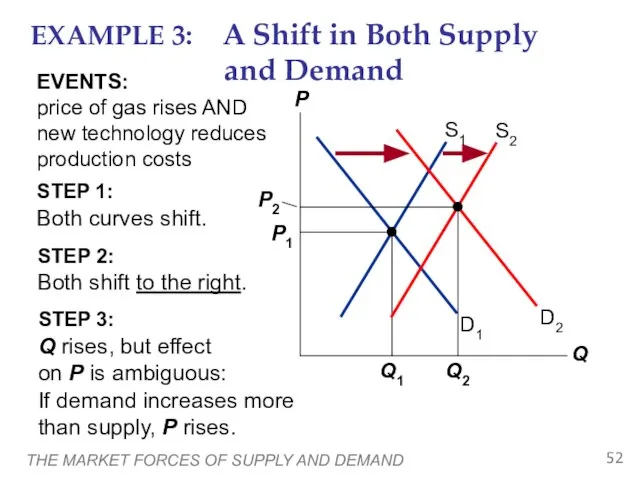
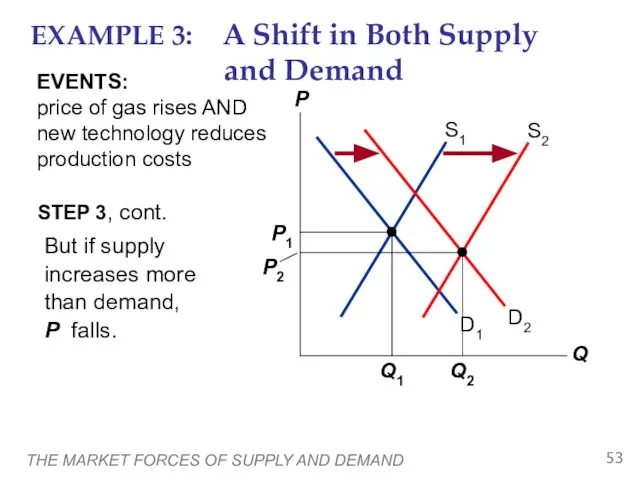
- 53. THE MARKET FORCES OF SUPPLY AND DEMAND EXAMPLE 3: A Shift in Both Supply and Demand
- 54. THE MARKET FORCES OF SUPPLY AND DEMAND EXAMPLE 3: A Shift in Both Supply and Demand
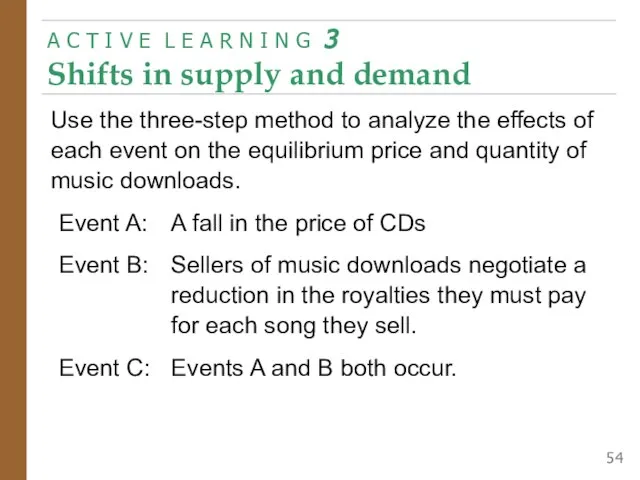
- 55. A C T I V E L E A R N I N G 3 Shifts
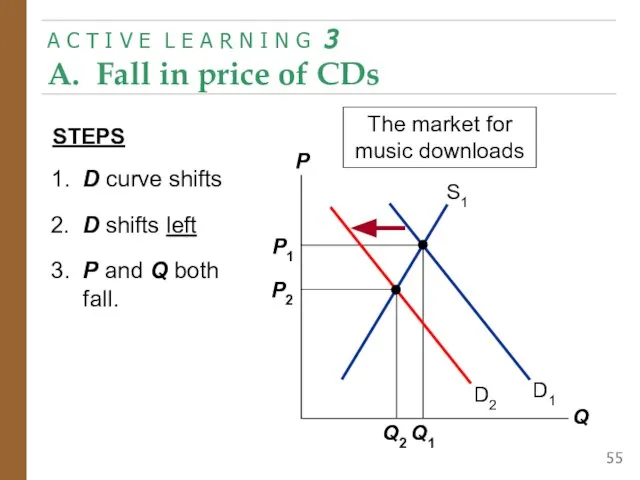
- 56. A C T I V E L E A R N I N G 3 A.
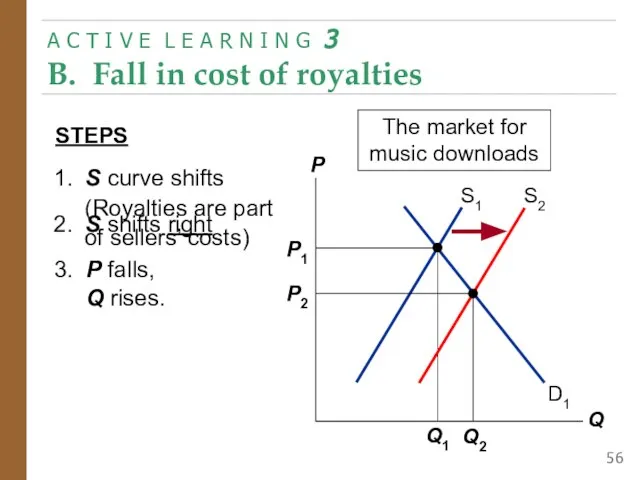
- 57. A C T I V E L E A R N I N G 3 B.
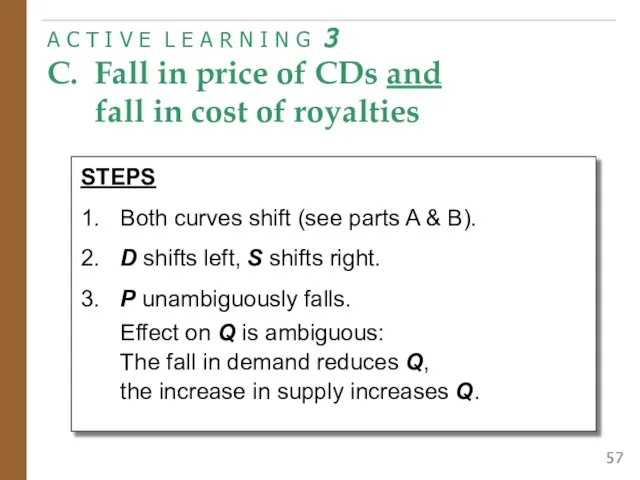
- 58. A C T I V E L E A R N I N G 3 C.
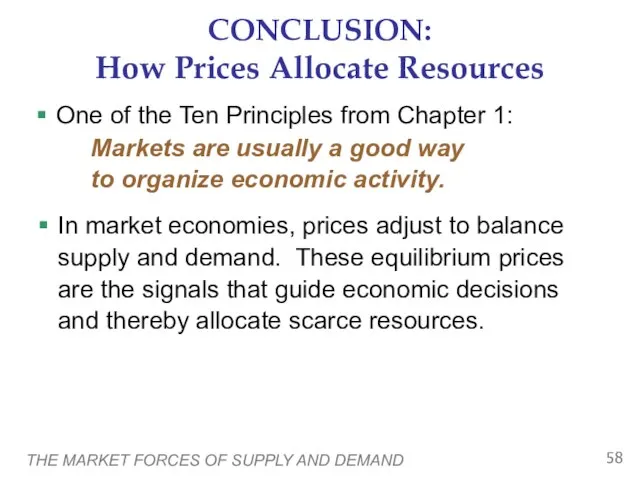
- 59. THE MARKET FORCES OF SUPPLY AND DEMAND CONCLUSION: How Prices Allocate Resources One of the Ten
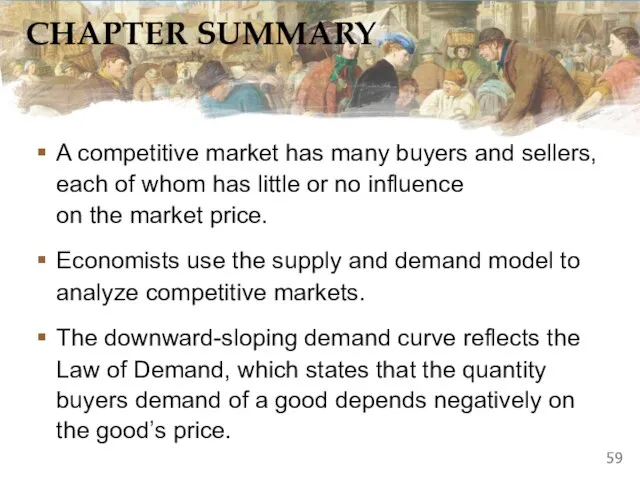
- 60. CHAPTER SUMMARY A competitive market has many buyers and sellers, each of whom has little or
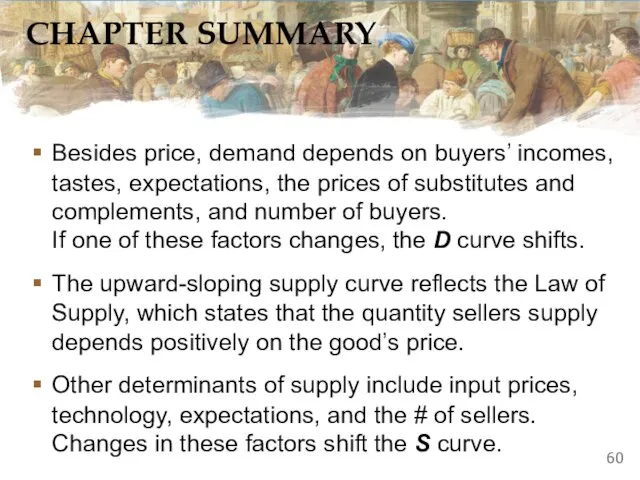
- 61. CHAPTER SUMMARY Besides price, demand depends on buyers’ incomes, tastes, expectations, the prices of substitutes and
- 62. CHAPTER SUMMARY The intersection of S and D curves determines the market equilibrium. At the equilibrium
- 64. Скачать презентацию
Слайд 3THE MARKET FORCES OF SUPPLY AND DEMAND
Markets and Competition
A market is a
THE MARKET FORCES OF SUPPLY AND DEMAND
Markets and Competition
A market is a
Слайд 4THE MARKET FORCES OF SUPPLY AND DEMAND
Demand
The quantity demanded of any good
THE MARKET FORCES OF SUPPLY AND DEMAND
Demand
The quantity demanded of any good
Слайд 5THE MARKET FORCES OF SUPPLY AND DEMAND
The Demand Schedule
Demand schedule:
a table
THE MARKET FORCES OF SUPPLY AND DEMAND
The Demand Schedule
Demand schedule: a table
Слайд 6THE MARKET FORCES OF SUPPLY AND DEMAND
Helen’s Demand Schedule & Curve
THE MARKET FORCES OF SUPPLY AND DEMAND
Helen’s Demand Schedule & Curve
Слайд 7Market Demand versus Individual Demand
The quantity demanded in the market is the
Market Demand versus Individual Demand
The quantity demanded in the market is the
Слайд 8THE MARKET FORCES OF SUPPLY AND DEMAND
P
Q
The Market Demand Curve for Lattes
THE MARKET FORCES OF SUPPLY AND DEMAND
P
Q
The Market Demand Curve for Lattes
Слайд 9THE MARKET FORCES OF SUPPLY AND DEMAND
Demand Curve Shifters
The demand curve shows
THE MARKET FORCES OF SUPPLY AND DEMAND
Demand Curve Shifters
The demand curve shows
Слайд 10THE MARKET FORCES OF SUPPLY AND DEMAND
Demand Curve Shifters: # of Buyers
Increase
THE MARKET FORCES OF SUPPLY AND DEMAND
Demand Curve Shifters: # of Buyers
Increase
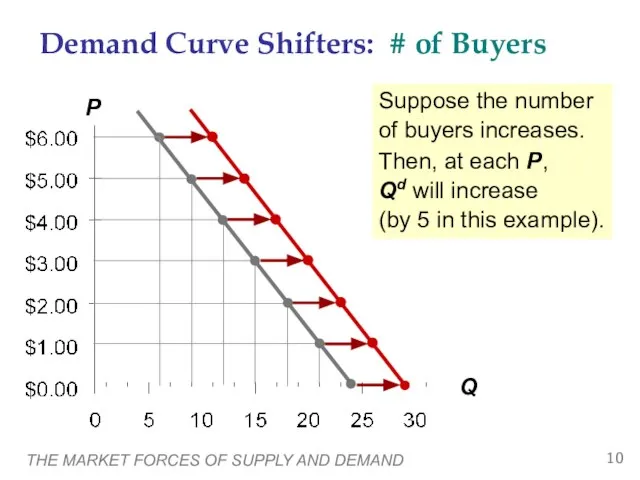
Слайд 11THE MARKET FORCES OF SUPPLY AND DEMAND
Suppose the number of buyers increases.
THE MARKET FORCES OF SUPPLY AND DEMAND
Suppose the number of buyers increases.
Слайд 12THE MARKET FORCES OF SUPPLY AND DEMAND
Demand for a normal good is
THE MARKET FORCES OF SUPPLY AND DEMAND
Demand for a normal good is
Слайд 13THE MARKET FORCES OF SUPPLY AND DEMAND
Two goods are substitutes if an
THE MARKET FORCES OF SUPPLY AND DEMAND
Two goods are substitutes if an
Слайд 14THE MARKET FORCES OF SUPPLY AND DEMAND
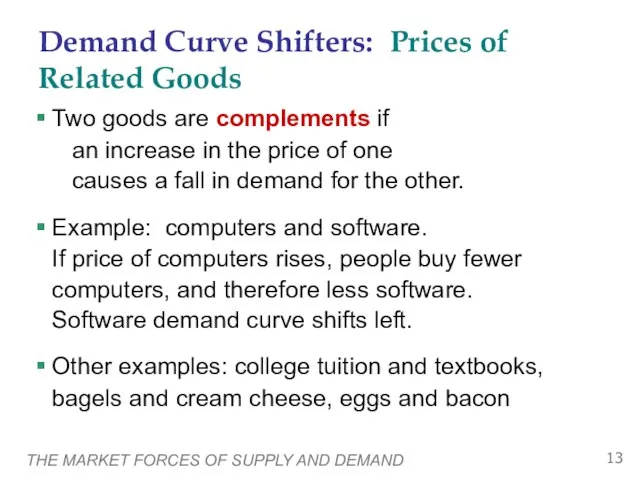
Two goods are complements if an
THE MARKET FORCES OF SUPPLY AND DEMAND
Two goods are complements if an
Слайд 15THE MARKET FORCES OF SUPPLY AND DEMAND
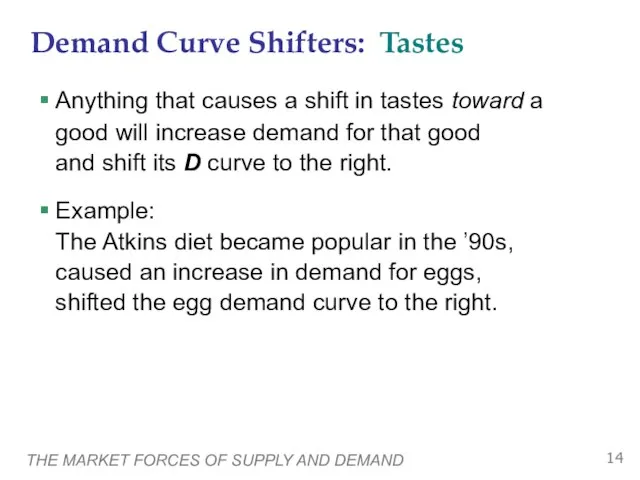
Anything that causes a shift in
THE MARKET FORCES OF SUPPLY AND DEMAND
Anything that causes a shift in
Слайд 16THE MARKET FORCES OF SUPPLY AND DEMAND
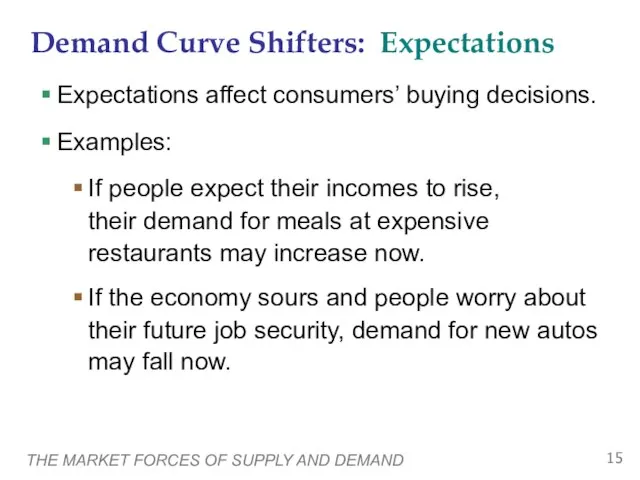
Expectations affect consumers’ buying decisions.
Examples:
If
THE MARKET FORCES OF SUPPLY AND DEMAND
Expectations affect consumers’ buying decisions.
Examples:
If
Слайд 17THE MARKET FORCES OF SUPPLY AND DEMAND
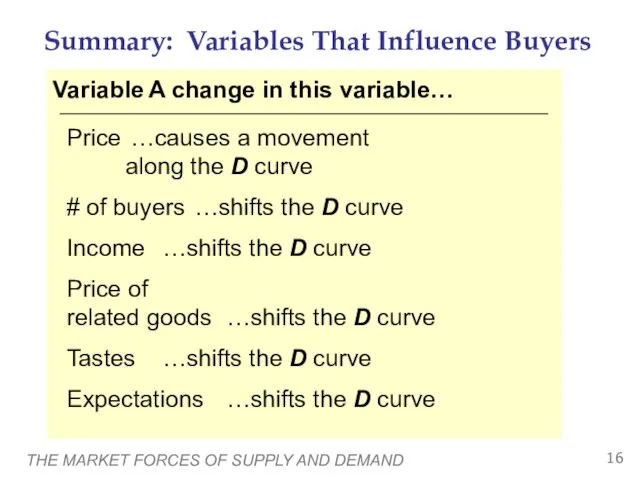
Summary: Variables That Influence Buyers
Variable A change
THE MARKET FORCES OF SUPPLY AND DEMAND
Summary: Variables That Influence Buyers
Variable A change
Слайд 18A. The price of iPods falls
B. The price of music downloads falls
C. The price of
A. The price of iPods falls
B. The price of music downloads falls
C. The price of
Слайд 19A C T I V E L E A R N I
A C T I V E L E A R N I
Слайд 20A C T I V E L E A R N I
A C T I V E L E A R N I
Слайд 21A C T I V E L E A R N I
A C T I V E L E A R N I
Слайд 22THE MARKET FORCES OF SUPPLY AND DEMAND
Supply
The quantity supplied of any good
THE MARKET FORCES OF SUPPLY AND DEMAND
Supply
The quantity supplied of any good
Слайд 23THE MARKET FORCES OF SUPPLY AND DEMAND
The Supply Schedule
Supply schedule:
A table
THE MARKET FORCES OF SUPPLY AND DEMAND
The Supply Schedule
Supply schedule: A table
Слайд 24THE MARKET FORCES OF SUPPLY AND DEMAND
Starbucks’ Supply Schedule & Curve
P
Q
THE MARKET FORCES OF SUPPLY AND DEMAND
Starbucks’ Supply Schedule & Curve
P
Q
Слайд 25Market Supply versus Individual Supply
The quantity supplied in the market is the
Market Supply versus Individual Supply
The quantity supplied in the market is the
Слайд 26THE MARKET FORCES OF SUPPLY AND DEMAND
The Market Supply Curve
THE MARKET FORCES OF SUPPLY AND DEMAND
The Market Supply Curve
Слайд 27THE MARKET FORCES OF SUPPLY AND DEMAND
Supply Curve Shifters
The supply curve shows
THE MARKET FORCES OF SUPPLY AND DEMAND
Supply Curve Shifters
The supply curve shows
Слайд 28THE MARKET FORCES OF SUPPLY AND DEMAND
Supply Curve Shifters: Input Prices
Examples of
THE MARKET FORCES OF SUPPLY AND DEMAND
Supply Curve Shifters: Input Prices
Examples of
Слайд 29THE MARKET FORCES OF SUPPLY AND DEMAND
Suppose the price of milk falls.
THE MARKET FORCES OF SUPPLY AND DEMAND
Suppose the price of milk falls.
Слайд 30THE MARKET FORCES OF SUPPLY AND DEMAND
Supply Curve Shifters: Technology
Technology determines how
THE MARKET FORCES OF SUPPLY AND DEMAND
Supply Curve Shifters: Technology
Technology determines how
Слайд 31THE MARKET FORCES OF SUPPLY AND DEMAND
Supply Curve Shifters: # of Sellers
THE MARKET FORCES OF SUPPLY AND DEMAND
Supply Curve Shifters: # of Sellers
Слайд 32THE MARKET FORCES OF SUPPLY AND DEMAND
Supply Curve Shifters: Expectations
Example:
Events in
THE MARKET FORCES OF SUPPLY AND DEMAND
Supply Curve Shifters: Expectations
Example:
Events in
Слайд 33THE MARKET FORCES OF SUPPLY AND DEMAND
Summary: Variables that Influence Sellers
Variable A change
THE MARKET FORCES OF SUPPLY AND DEMAND
Summary: Variables that Influence Sellers
Variable A change
Слайд 34A C T I V E L E A R N I
A C T I V E L E A R N I
Слайд 35A C T I V E L E A R N I
A C T I V E L E A R N I
Слайд 36A C T I V E L E A R N I
A C T I V E L E A R N I
Слайд 37A C T I V E L E A R N I
A C T I V E L E A R N I
Слайд 38THE MARKET FORCES OF SUPPLY AND DEMAND
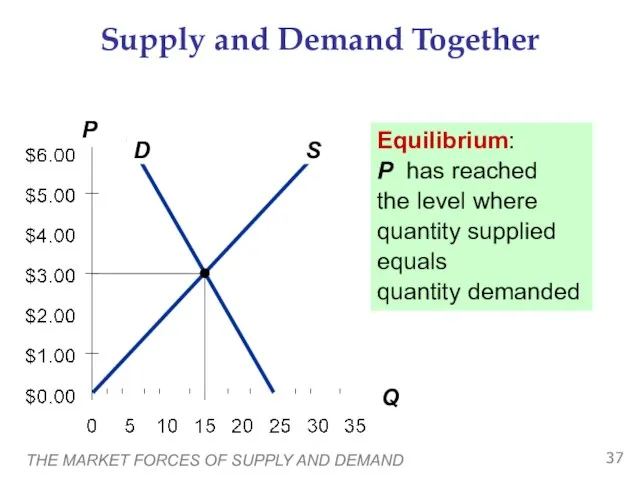
Supply and Demand Together
Equilibrium:
P has
THE MARKET FORCES OF SUPPLY AND DEMAND
Supply and Demand Together
Equilibrium: P has
Слайд 39THE MARKET FORCES OF SUPPLY AND DEMAND
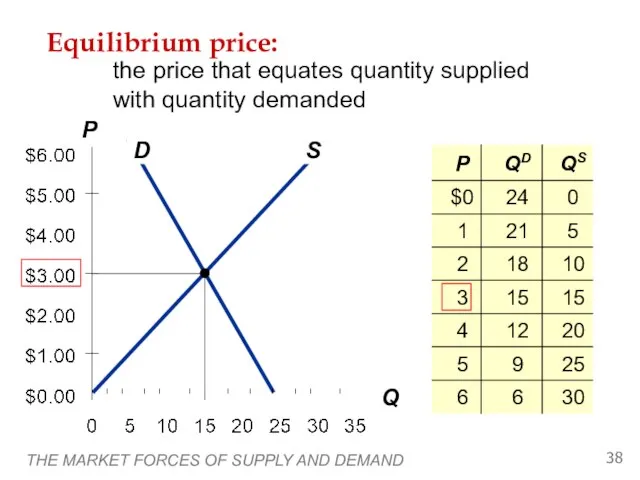
Equilibrium price:
the price that equates quantity
THE MARKET FORCES OF SUPPLY AND DEMAND
Equilibrium price:
the price that equates quantity
Слайд 40THE MARKET FORCES OF SUPPLY AND DEMAND
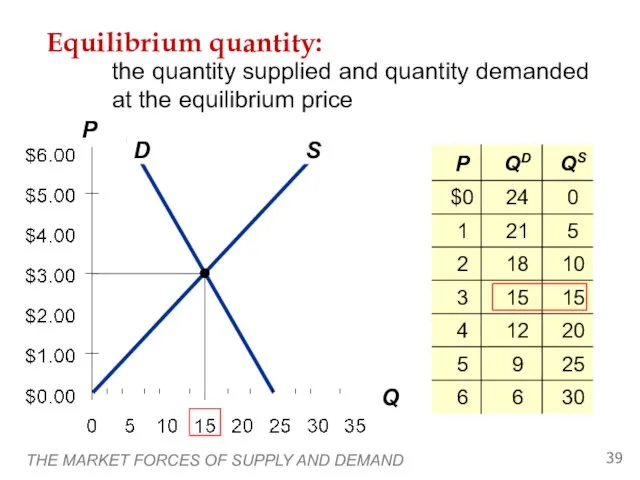
Equilibrium quantity:
the quantity supplied and quantity
THE MARKET FORCES OF SUPPLY AND DEMAND
Equilibrium quantity:
the quantity supplied and quantity
Слайд 41THE MARKET FORCES OF SUPPLY AND DEMAND
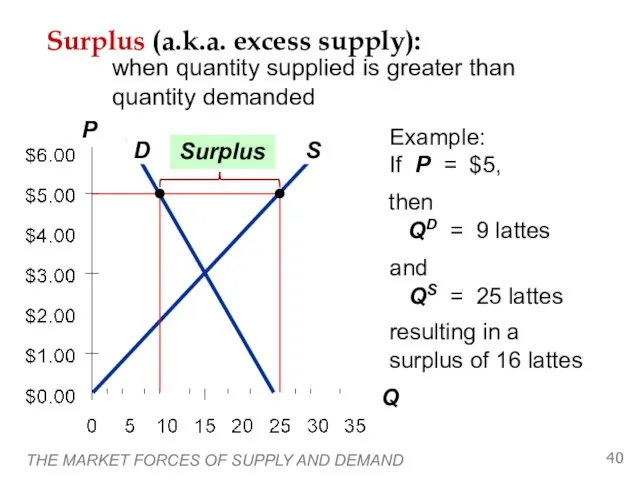
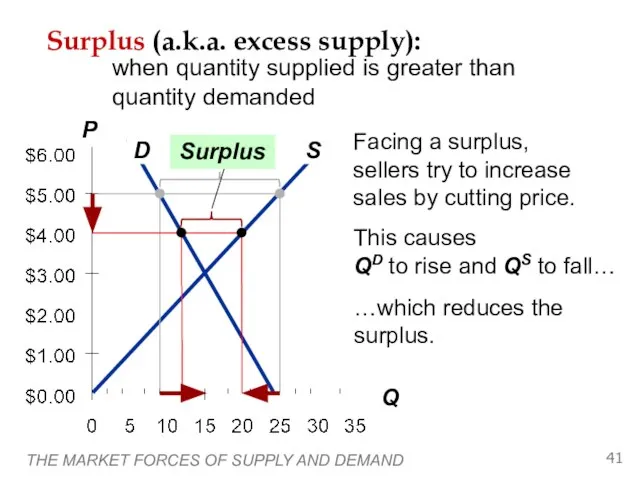
Surplus (a.k.a. excess supply):
when quantity supplied
THE MARKET FORCES OF SUPPLY AND DEMAND
Surplus (a.k.a. excess supply):
when quantity supplied
Слайд 42THE MARKET FORCES OF SUPPLY AND DEMAND
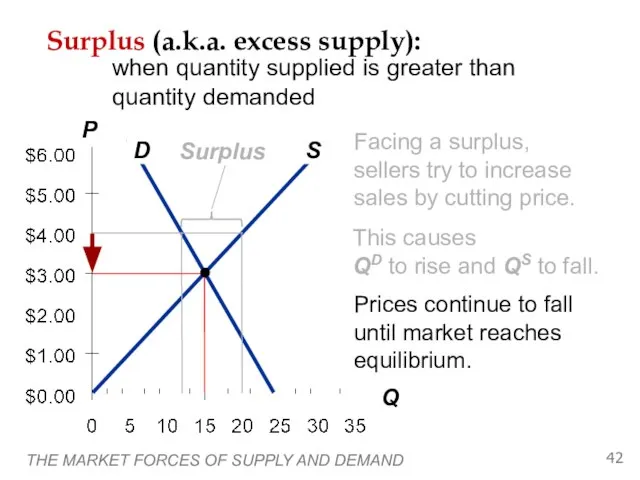
Surplus (a.k.a. excess supply):
when quantity supplied
THE MARKET FORCES OF SUPPLY AND DEMAND
Surplus (a.k.a. excess supply):
when quantity supplied
Слайд 43THE MARKET FORCES OF SUPPLY AND DEMAND
Surplus (a.k.a. excess supply):
when quantity supplied
THE MARKET FORCES OF SUPPLY AND DEMAND
Surplus (a.k.a. excess supply):
when quantity supplied
Слайд 44THE MARKET FORCES OF SUPPLY AND DEMAND
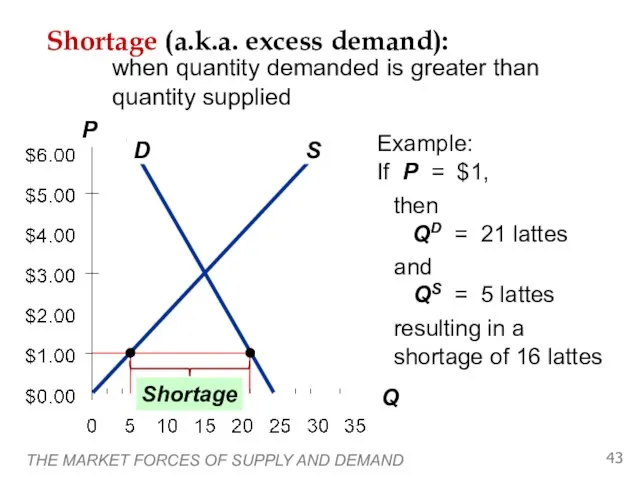
Shortage (a.k.a. excess demand):
when quantity demanded
THE MARKET FORCES OF SUPPLY AND DEMAND
Shortage (a.k.a. excess demand):
when quantity demanded
Слайд 45THE MARKET FORCES OF SUPPLY AND DEMAND
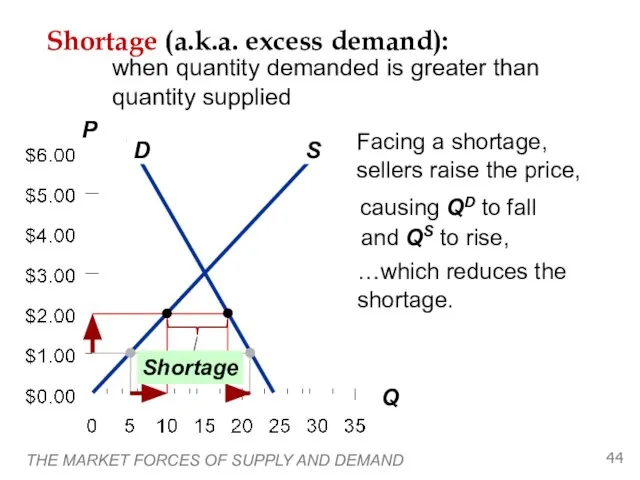
Shortage (a.k.a. excess demand):
when quantity demanded
THE MARKET FORCES OF SUPPLY AND DEMAND
Shortage (a.k.a. excess demand):
when quantity demanded
Слайд 46THE MARKET FORCES OF SUPPLY AND DEMAND
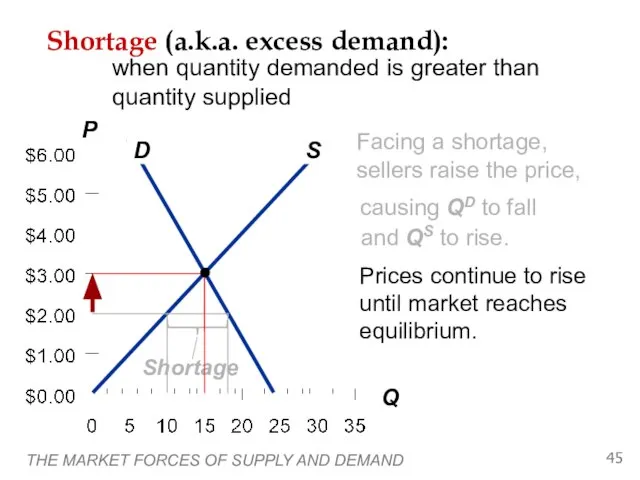
Shortage (a.k.a. excess demand):
when quantity demanded
THE MARKET FORCES OF SUPPLY AND DEMAND
Shortage (a.k.a. excess demand):
when quantity demanded
Слайд 47THE MARKET FORCES OF SUPPLY AND DEMAND
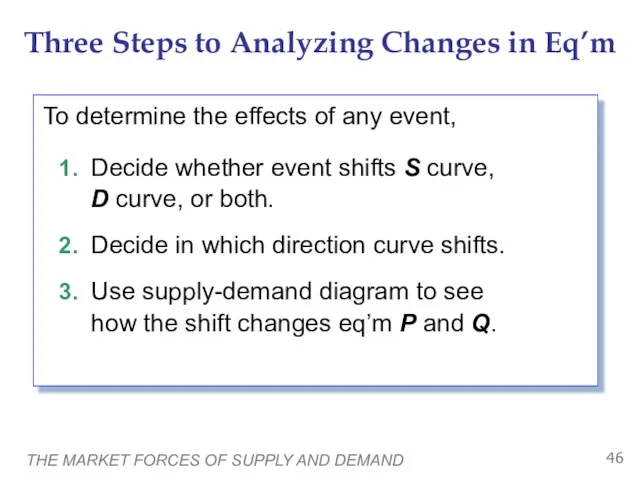
Three Steps to Analyzing Changes in
THE MARKET FORCES OF SUPPLY AND DEMAND
Three Steps to Analyzing Changes in
Слайд 48THE MARKET FORCES OF SUPPLY AND DEMAND
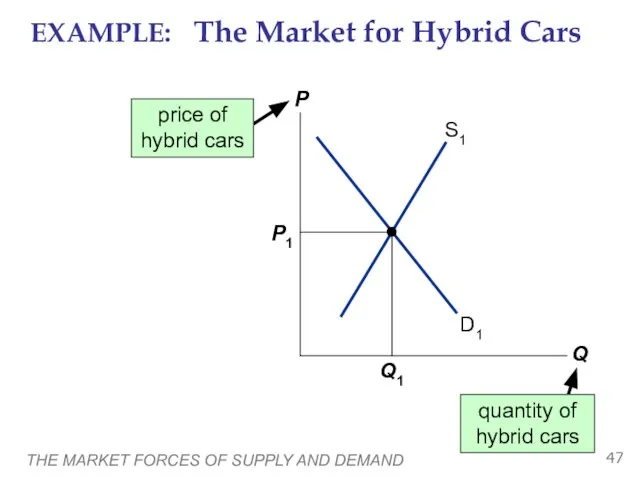
EXAMPLE: The Market for Hybrid Cars
THE MARKET FORCES OF SUPPLY AND DEMAND
EXAMPLE: The Market for Hybrid Cars
Слайд 49THE MARKET FORCES OF SUPPLY AND DEMAND
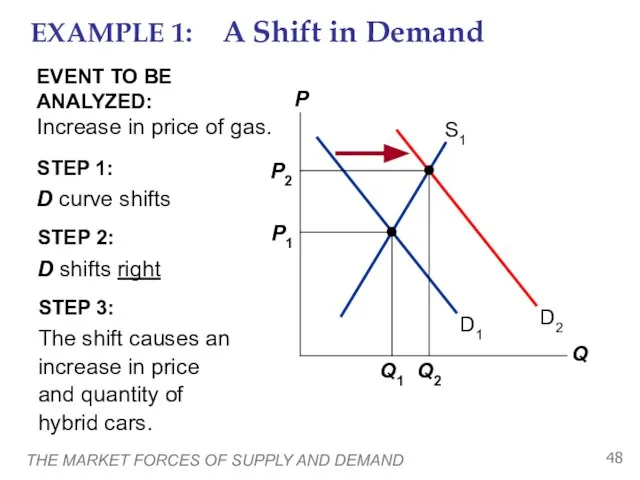
STEP 1:
D curve shifts
because
THE MARKET FORCES OF SUPPLY AND DEMAND
STEP 1:
D curve shifts
because
Слайд 50THE MARKET FORCES OF SUPPLY AND DEMAND
EXAMPLE 1: A Shift in Demand
P2
Q2
Notice:
THE MARKET FORCES OF SUPPLY AND DEMAND
EXAMPLE 1: A Shift in Demand
P2
Q2
Notice:
Слайд 51Terms for Shift vs. Movement Along Curve
Change in supply: a shift in
Terms for Shift vs. Movement Along Curve
Change in supply: a shift in
Слайд 52THE MARKET FORCES OF SUPPLY AND DEMAND
STEP 1:
S curve shifts
because
THE MARKET FORCES OF SUPPLY AND DEMAND
STEP 1:
S curve shifts
because
Слайд 53THE MARKET FORCES OF SUPPLY AND DEMAND
EXAMPLE 3: A Shift in Both
THE MARKET FORCES OF SUPPLY AND DEMAND
EXAMPLE 3: A Shift in Both
Слайд 54THE MARKET FORCES OF SUPPLY AND DEMAND
EXAMPLE 3: A Shift in Both
THE MARKET FORCES OF SUPPLY AND DEMAND
EXAMPLE 3: A Shift in Both
Слайд 55A C T I V E L E A R N I
A C T I V E L E A R N I
Слайд 56A C T I V E L E A R N I
A C T I V E L E A R N I
Слайд 57A C T I V E L E A R N I
A C T I V E L E A R N I
Слайд 58A C T I V E L E A R N I
A C T I V E L E A R N I
Слайд 59THE MARKET FORCES OF SUPPLY AND DEMAND
CONCLUSION:
How Prices Allocate Resources
One of
THE MARKET FORCES OF SUPPLY AND DEMAND
CONCLUSION:
How Prices Allocate Resources
One of
Слайд 60CHAPTER SUMMARY
A competitive market has many buyers and sellers, each of whom
CHAPTER SUMMARY
A competitive market has many buyers and sellers, each of whom
Слайд 61CHAPTER SUMMARY
Besides price, demand depends on buyers’ incomes, tastes, expectations, the prices
CHAPTER SUMMARY
Besides price, demand depends on buyers’ incomes, tastes, expectations, the prices
Слайд 62CHAPTER SUMMARY
The intersection of S and D curves determines the market equilibrium.
CHAPTER SUMMARY
The intersection of S and D curves determines the market equilibrium.
 Удалите лишнее
 45b93ad8b40a432b9fbc7c499afbbc6c (1)
 Цифровые приборы
 Система образования в Канаде
 Путешествие в зимнюю Москву!
 Презентация на тему Образ святого Александра Невского в культуре и литературе
  Коммерческое Предложение
 Организм человека как единая саморазвивающаяся биологическая система (Лекция 4)
 Реклама в России.События и перспективы
 Возникновение искусства и религии
 Презентация на тему Питание растений
  М.Е.Салтыков-Щедрин «История одного города» Власть и мы
 Международные стандарты ISO
 География Австралии!
 Денежные агрегаты
 Саудовской Аравии
 Муниципальное общеобразовательное учреждение «Заводская средняя общеобразовательная школа» Троицкого района
 Центр развития (www.dcenter.ru)
 Механизм протекания цепной ядерной реакции
 Общая характеристика семейства Эльбрус. Разработки на базе современной отечественной микропроцессорной архитектуры
 Сообщество «Сделаем вместе!»
 Презентация на тему Малые жанры фольклора (5 класс)
 Уроки с использованием компьютерных технологий в учебном процессе
 Мотив крика, одиночества в живописи и литературе
 Мультимедийные урокиМАСТЕР-КЛАСС
 2CV – Rencontre mondiale
 Иоганн генрих песталоцци
 ПЛАТЕЖНЫЕ КАРТЫ:реальное состояние и нереализованные возможности