- Complex analysis of metabolic status, intracellular pH, viscosity and cytoskeleton of human

Содержание
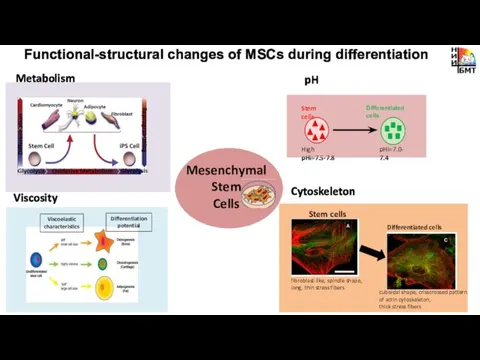
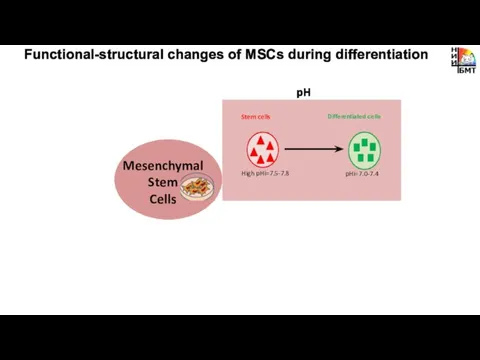
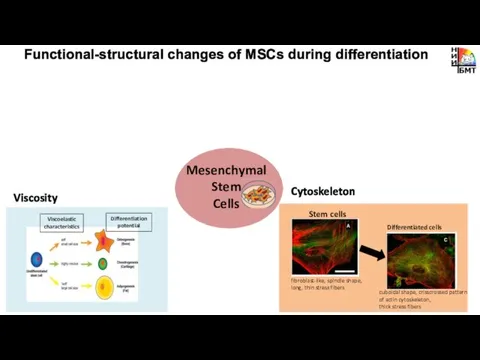
- 2. Metabolism pH Cytoskeleton Functional-structural changes of MSCs during differentiation Viscosity Mesenchymal Stem Cells
- 3. Effective control of MSCs differentiation - great challenge Complex analysis is required!!!
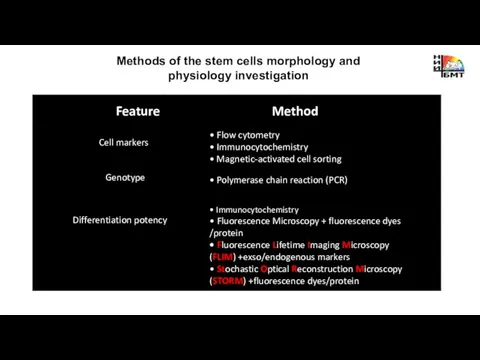
- 4. Methods of the stem cells morphology and physiology investigation Feature Method Cell markers • Flow cytometry
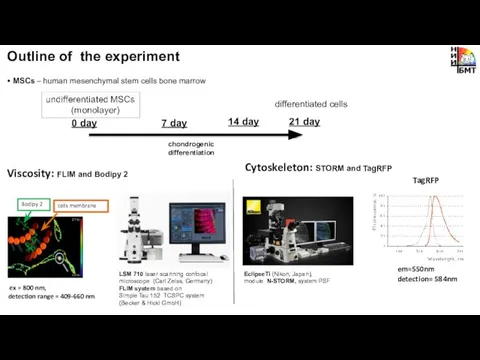
- 5. Outline of the experiment • MSCs – human mesenchymal stem cells bone marrow Metabolism: fluorescence microscopy
- 6. • MSCs – human mesenchymal stem cells bone marrow LSM 710 laser scanning confocal microscope (Carl
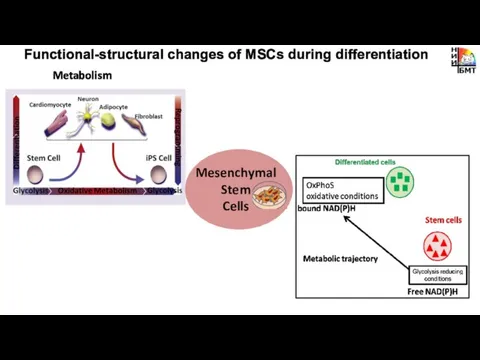
- 7. Metabolism Functional-structural changes of MSCs during differentiation Mesenchymal Stem Cells
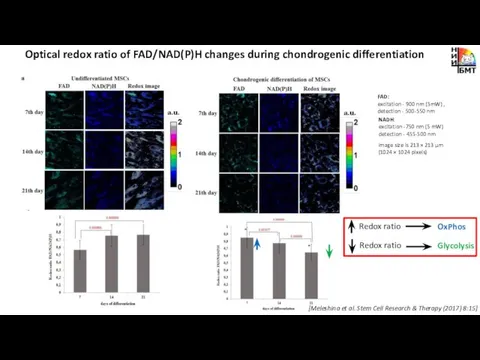
- 8. Optical redox ratio of FAD/NAD(P)H changes during chondrogenic differentiation NADH: excitation -750 nm (5 mW) detection
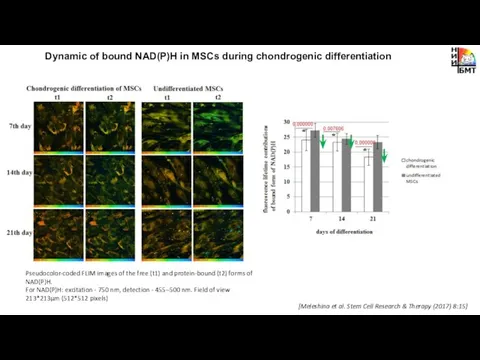
- 9. Dynamic of bound NAD(P)H in MSCs during chondrogenic differentiation [Meleshina et al. Stem Cell Research &
- 10. pH Functional-structural changes of MSCs during differentiation Mesenchymal Stem Cells
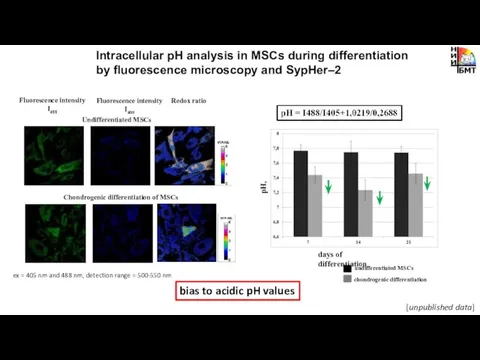
- 11. Intracellular pH analysis in MSCs during differentiation by fluorescence microscopy and SypHer–2 days of differentiation pH,
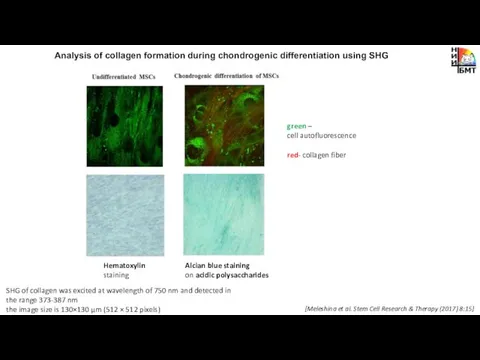
- 12. Analysis of collagen formation during chondrogenic differentiation using SHG green – cell autofluorescence red- collagen fiber
- 13. Cytoskeleton Functional-structural changes of MSCs during differentiation Viscosity Mesenchymal Stem Cells
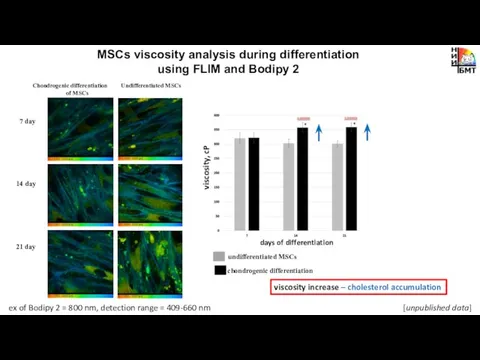
- 14. MSCs viscosity analysis during differentiation using FLIM and Bodipy 2 chondrogenic differentiation undifferentiated MSCs viscosity increase
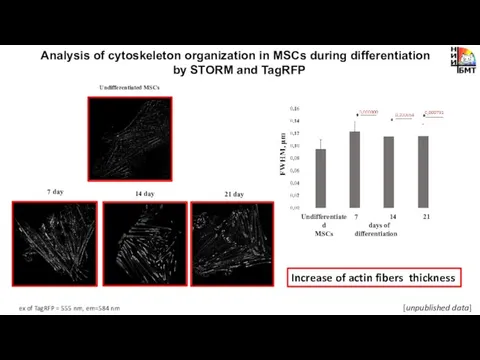
- 15. Analysis of cytoskeleton organization in MSCs during differentiation by STORM and TagRFP Undifferentiated MSCs 7 day
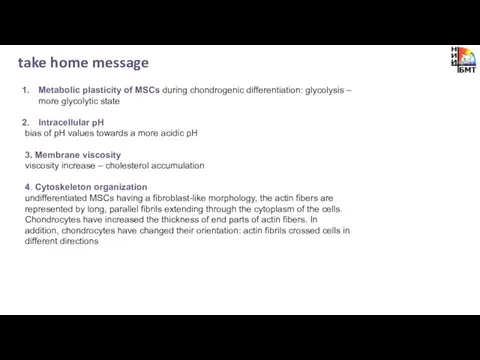
- 16. take home message Metabolic plasticity of MSCs during chondrogenic differentiation: glycolysis – more glycolytic state Intracellular
- 17. Acknowledgements This work has been financially supported by Russian Science Foundation (grants No. 14-15-00536) M.V. Shirmanova
- 19. Скачать презентацию
Слайд 2Metabolism
pH
Cytoskeleton
Functional-structural changes of MSCs during differentiation
Viscosity
Mesenchymal
Stem
Cells
Metabolism
pH
Cytoskeleton
Functional-structural changes of MSCs during differentiation
Viscosity
Mesenchymal
Stem
Cells
Слайд 3Effective control of MSCs differentiation - great challenge
Complex analysis is required!!!
Effective control of MSCs differentiation - great challenge
Complex analysis is required!!!
Слайд 4Methods of the stem cells morphology and physiology investigation
Feature
Method
Cell markers
• Flow cytometry
•
Methods of the stem cells morphology and physiology investigation
Feature
Method
Cell markers
• Flow cytometry
•
Слайд 5Outline of the experiment
• MSCs – human mesenchymal stem cells bone marrow
Outline of the experiment
• MSCs – human mesenchymal stem cells bone marrow
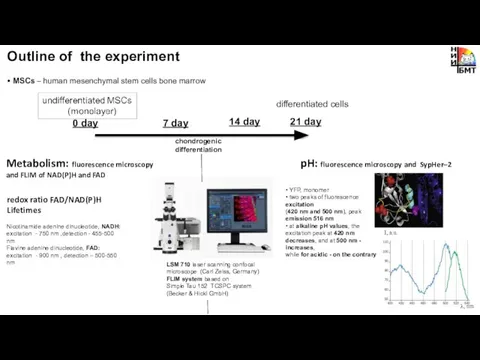
Слайд 6• MSCs – human mesenchymal stem cells bone marrow
LSM 710 laser
• MSCs – human mesenchymal stem cells bone marrow
LSM 710 laser
Слайд 7Metabolism
Functional-structural changes of MSCs during differentiation
Mesenchymal
Stem
Cells
Metabolism
Functional-structural changes of MSCs during differentiation
Mesenchymal
Stem
Cells
Слайд 8Optical redox ratio of FAD/NAD(P)H changes during chondrogenic differentiation
NADH:
excitation -750 nm
Optical redox ratio of FAD/NAD(P)H changes during chondrogenic differentiation
NADH:
excitation -750 nm
Слайд 9Dynamic of bound NAD(P)H in MSCs during chondrogenic differentiation
[Meleshina et al.
Dynamic of bound NAD(P)H in MSCs during chondrogenic differentiation
[Meleshina et al.
Слайд 10pH
Functional-structural changes of MSCs during differentiation
Mesenchymal
Stem
Cells
pH
Functional-structural changes of MSCs during differentiation
Mesenchymal
Stem
Cells
Слайд 11Intracellular pH analysis in MSCs during differentiation
by fluorescence microscopy and SypHer–2
Intracellular pH analysis in MSCs during differentiation
by fluorescence microscopy and SypHer–2
Слайд 12Analysis of collagen formation during chondrogenic differentiation using SHG
green –
cell autofluorescence
red- collagen
Analysis of collagen formation during chondrogenic differentiation using SHG
green –
cell autofluorescence
red- collagen
Слайд 13Cytoskeleton
Functional-structural changes of MSCs during differentiation
Viscosity
Mesenchymal
Stem
Cells
Cytoskeleton
Functional-structural changes of MSCs during differentiation
Viscosity
Mesenchymal
Stem
Cells
Слайд 14MSCs viscosity analysis during differentiation
using FLIM and Bodipy 2
chondrogenic differentiation
undifferentiated MSCs
viscosity
MSCs viscosity analysis during differentiation
using FLIM and Bodipy 2
chondrogenic differentiation
undifferentiated MSCs
viscosity
Слайд 15Analysis of cytoskeleton organization in MSCs during differentiation
by STORM and TagRFP
Analysis of cytoskeleton organization in MSCs during differentiation
by STORM and TagRFP
Слайд 16take home message
Metabolic plasticity of MSCs during chondrogenic differentiation: glycolysis – more
take home message
Metabolic plasticity of MSCs during chondrogenic differentiation: glycolysis – more
Слайд 17Acknowledgements
This work has been financially supported by Russian Science Foundation (grants No.
Acknowledgements
This work has been financially supported by Russian Science Foundation (grants No.
 Жизнь на Земле
 Уровни организации жизни
 Металлы в организме человека
 Введение в предмет. Уровни организации живого организма
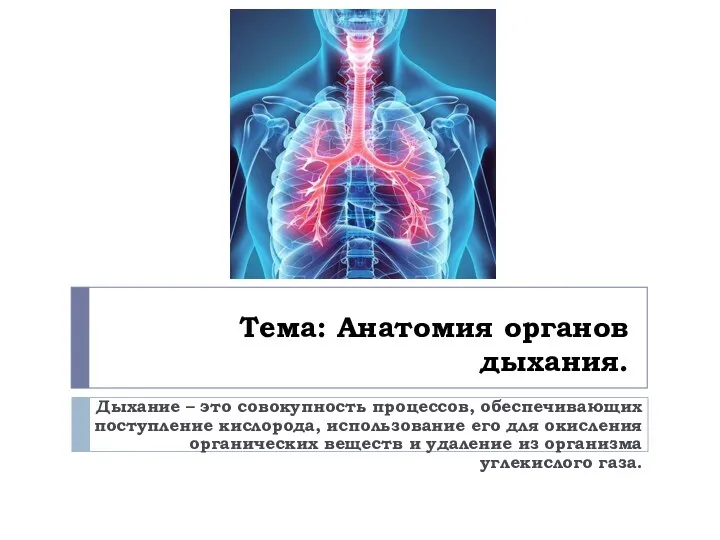 Анатомия органов дыхания
 Нут – бараний или турецкий горох
 Автономное пребывание человека в природной среде
 Презентация на тему Темновая фаза фотосинтеза (10 класс)
  Функциональная анатомия, развитие и аномалии развития дыхательной системы
 Доказательства эволюции животных. Урок 7 класс. Учитель химии и биологии Линийчук Ирина Ивановна.
 Blue botanical image 6-11x14
 Lektsia_10_Fiziologia_dykhania
 Генетический код. Первичное действие гена
 Красная книга Курганской области
 Тесты по теме «Типы размножения живых организмов» 9 класс
 Риба-Папуга
 Кожа. Эпидермис, гиподерма, дерма
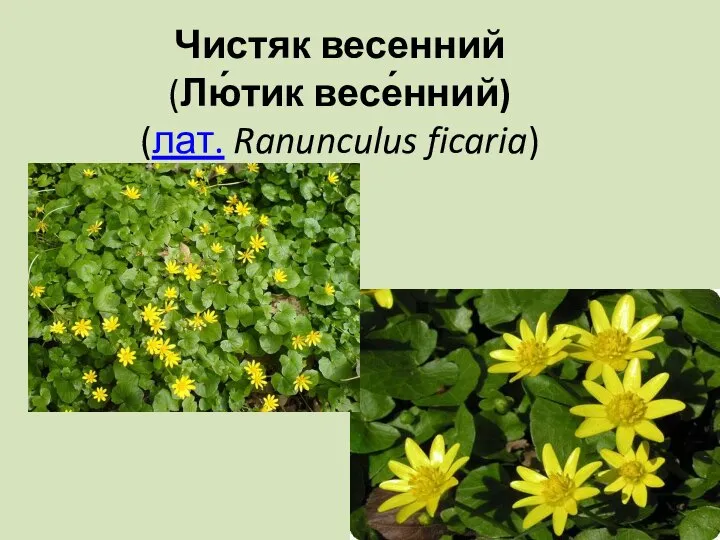 Чистяк весенний (Лю́тик весе́нний). Научная классификация
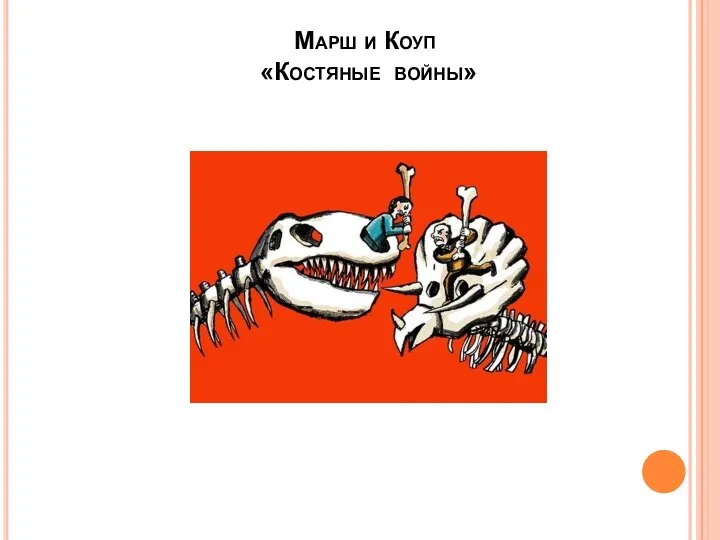 Костяные войны. Марш и Коуп
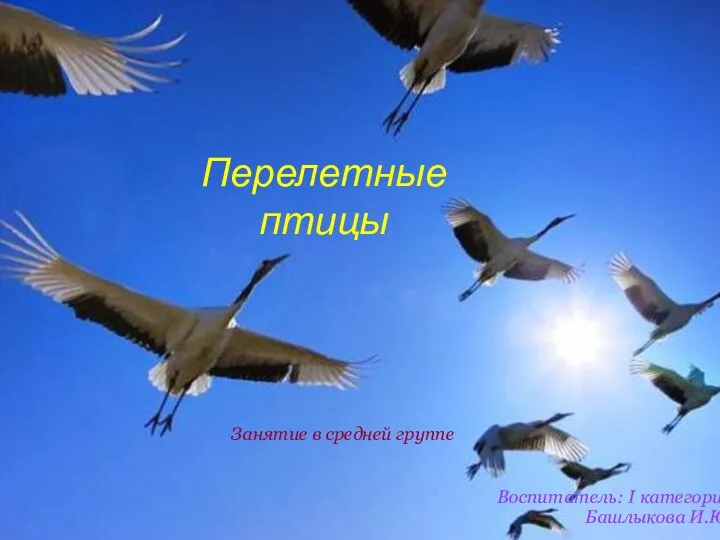 Перелетные птицы
 Покрытосеменные (цветковые) растения
 Эволюция кровеносной системы беспозвоночных
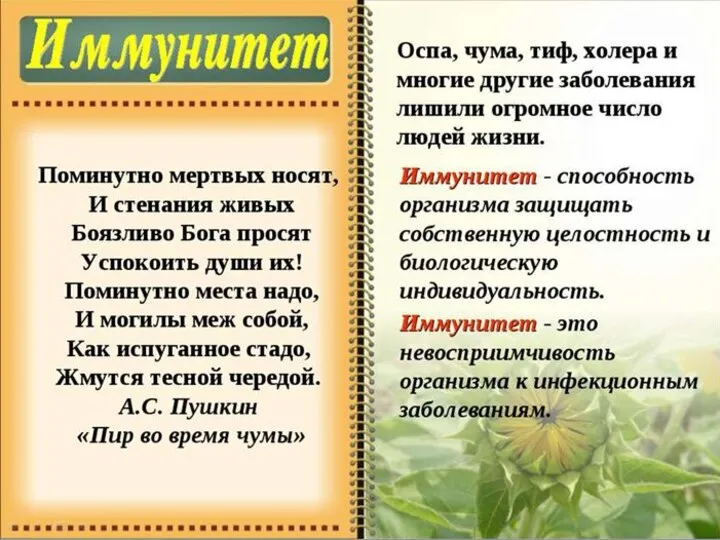 Иммунитет. Иммунная система
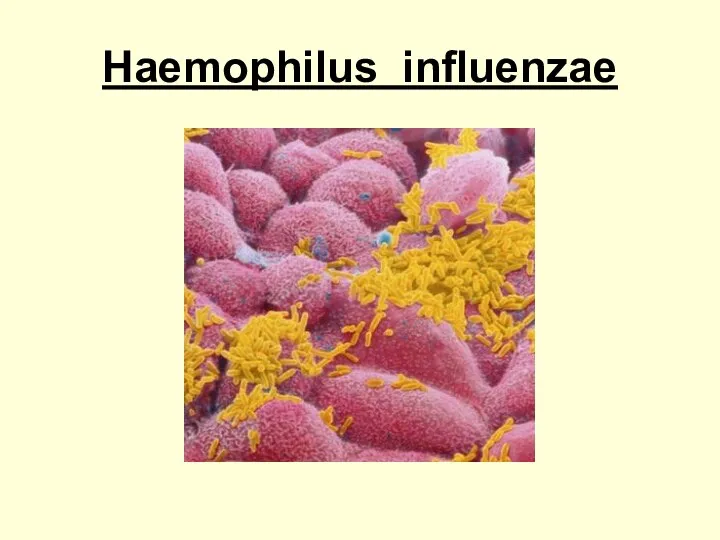 Haemophilus influenzae. Таксономия
 Грибы. Виды грибов
 Основные понятия генетики
 Презентация на тему Дыхание. Заболевания органов дыхания и их предупреждения
 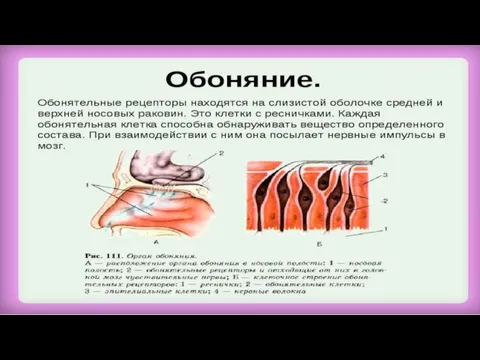 Обоняние. Нос