- American Society

Содержание
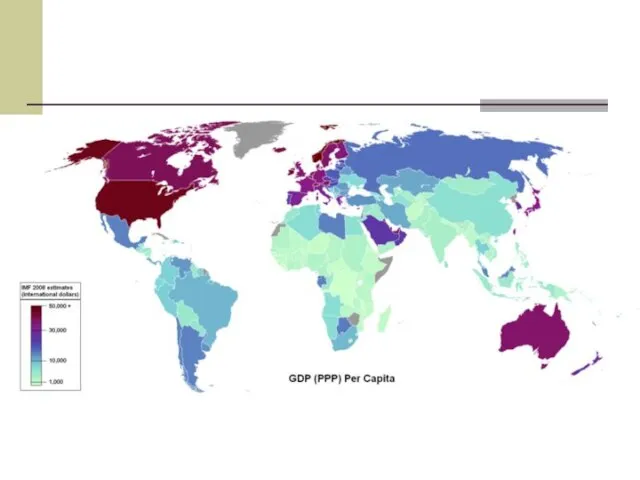
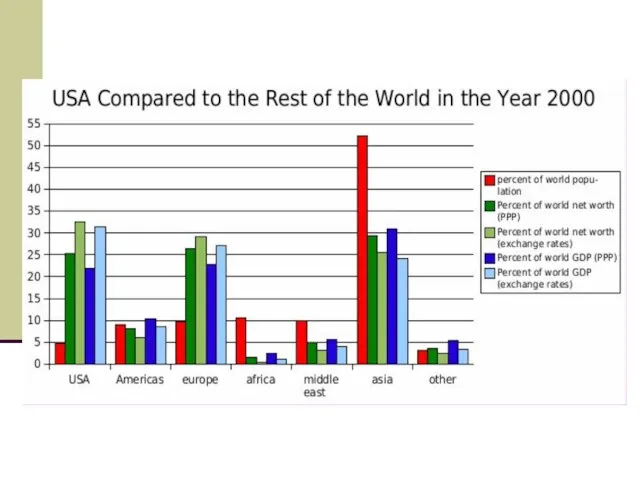
- 2. Economy It is market-oriented economy. The United States has the largest,most technologically powerful and most diverse
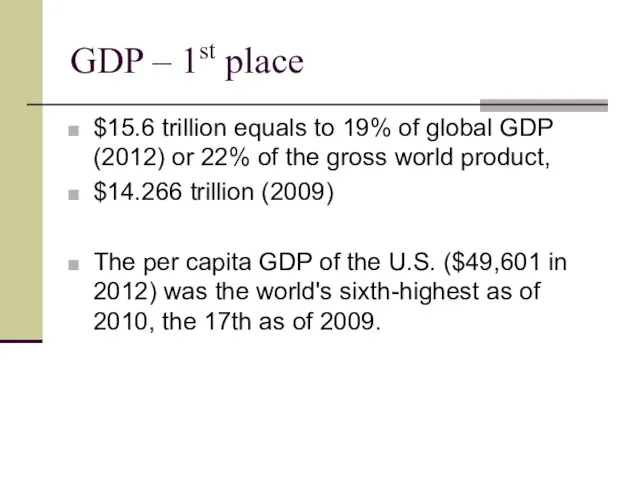
- 3. GDP – 1st place $15.6 trillion equals to 19% of global GDP (2012) or 22% of
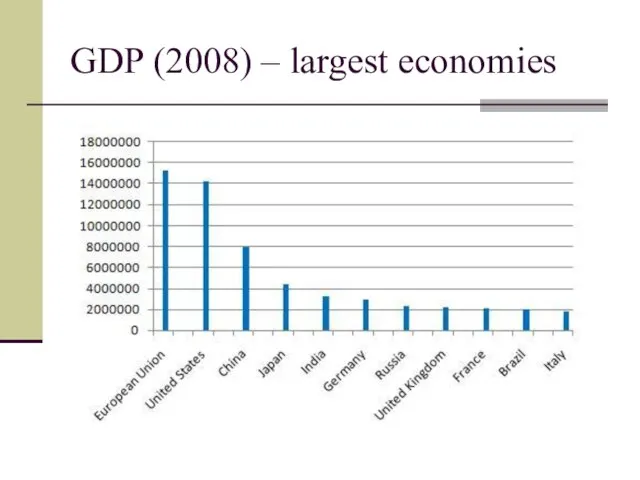
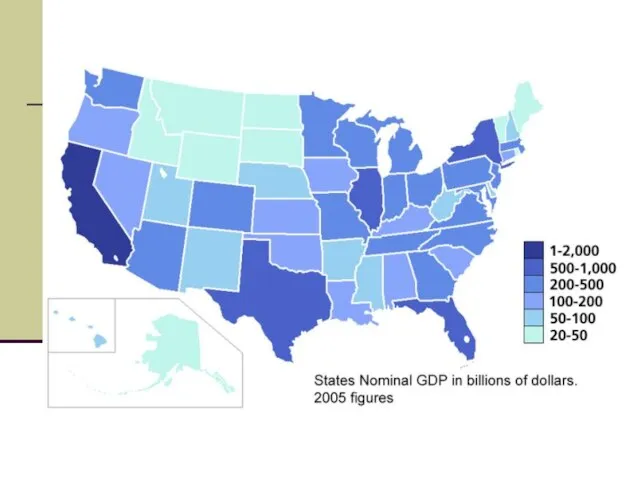
- 4. GDP (2008) – largest economies
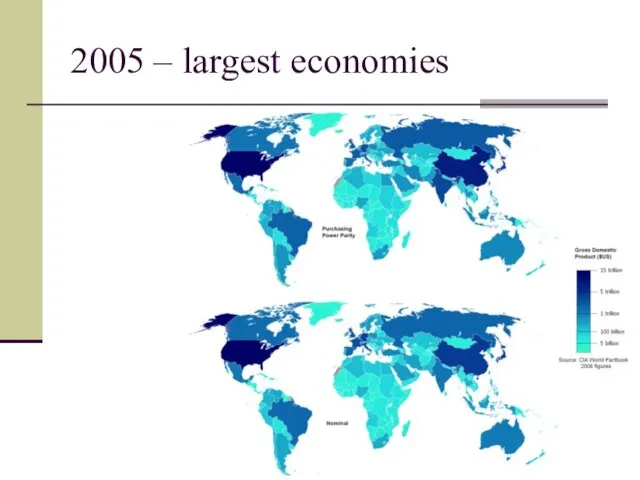
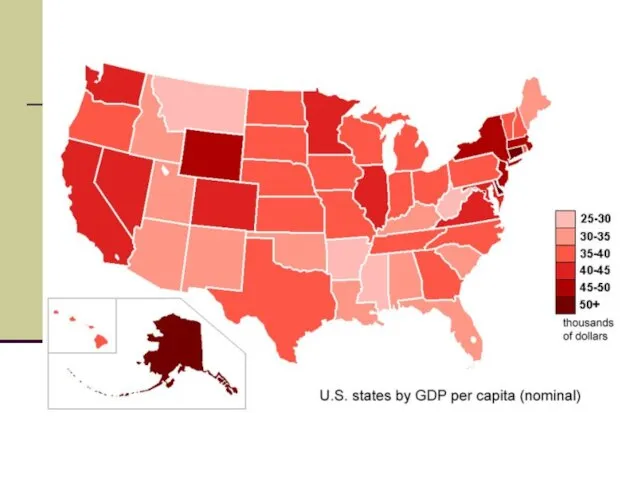
- 5. 2005 – largest economies
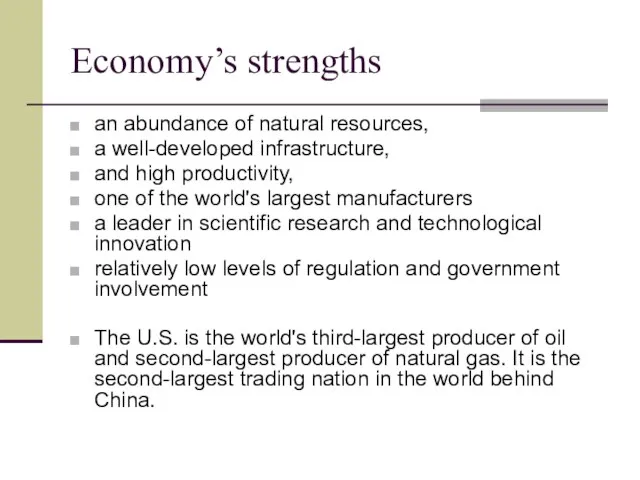
- 8. Economy’s strengths an abundance of natural resources, a well-developed infrastructure, and high productivity, one of the
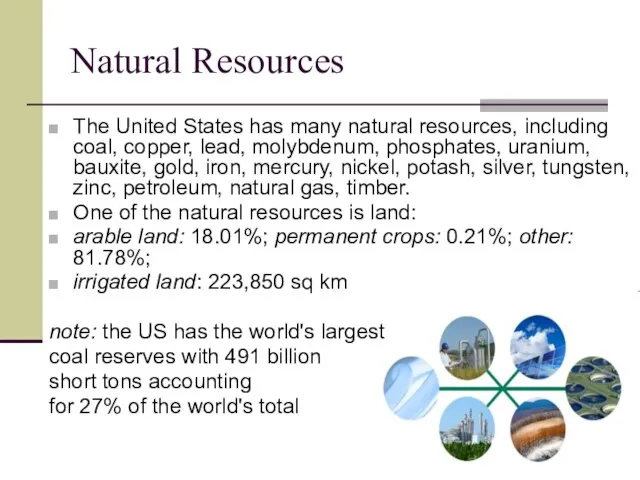
- 9. Natural Resources The United States has many natural resources, including coal, copper, lead, molybdenum, phosphates, uranium,
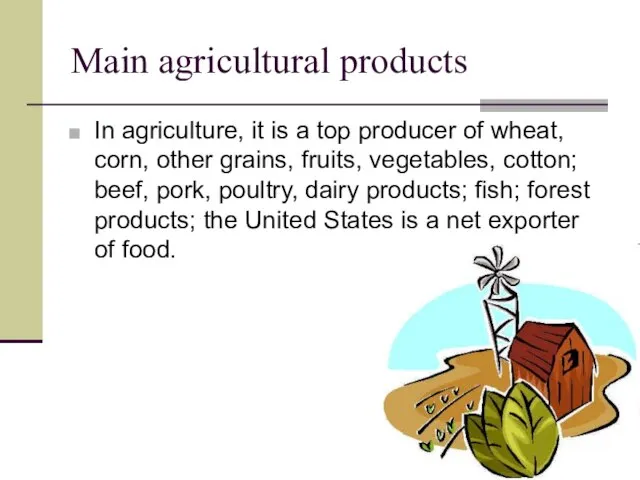
- 10. Main agricultural products In agriculture, it is a top producer of wheat, corn, other grains, fruits,
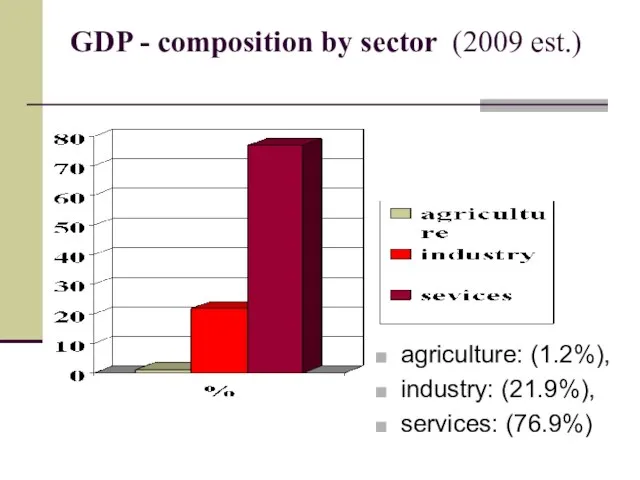
- 11. GDP - composition by sector (2009 est.) agriculture: (1.2%), industry: (21.9%), services: (76.9%)
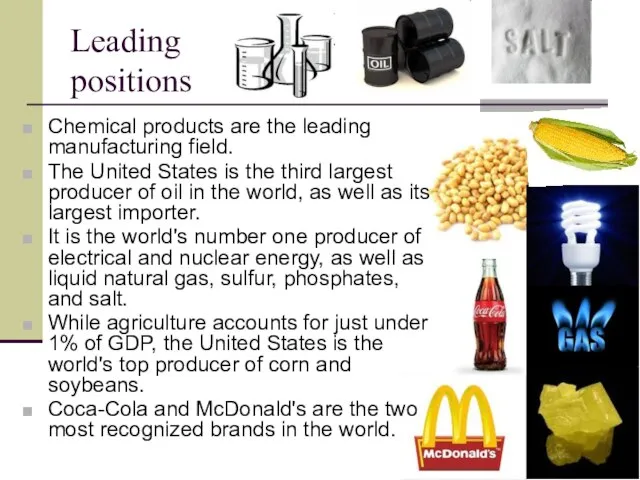
- 12. Leading positions Chemical products are the leading manufacturing field. The United States is the third largest
- 13. Main industries: petroleum, steel, motor vehicles, aerospace, telecommunications, chemicals, creative industries, electronics, food processing, consumer goods,
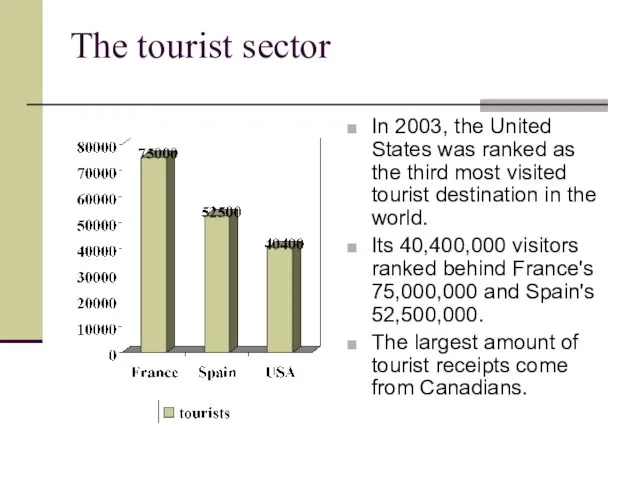
- 14. The tourist sector In 2003, the United States was ranked as the third most visited tourist
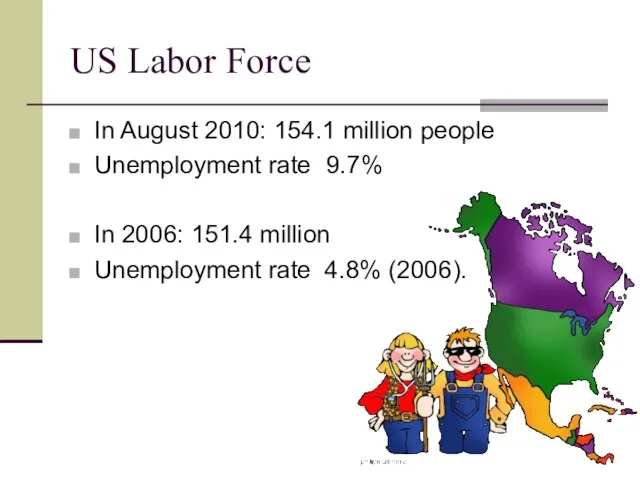
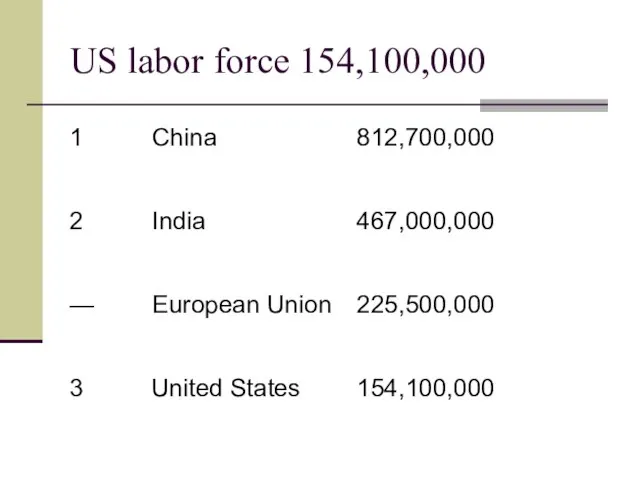
- 17. US Labor Force In August 2010: 154.1 million people Unemployment rate 9.7% In 2006: 151.4 million
- 18. US labor force 154,100,000
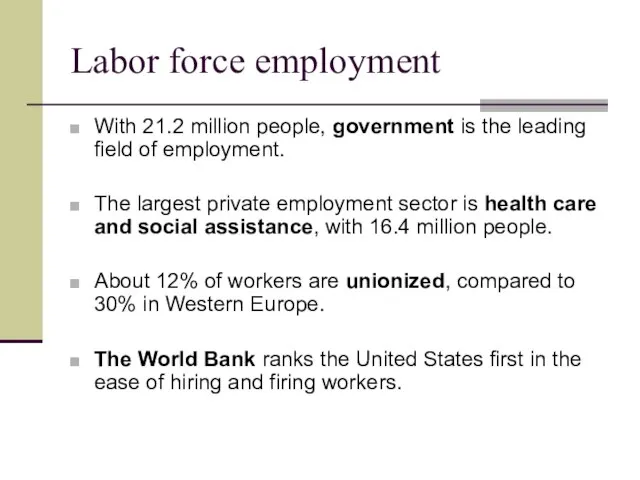
- 19. Labor force employment With 21.2 million people, government is the leading field of employment. The largest
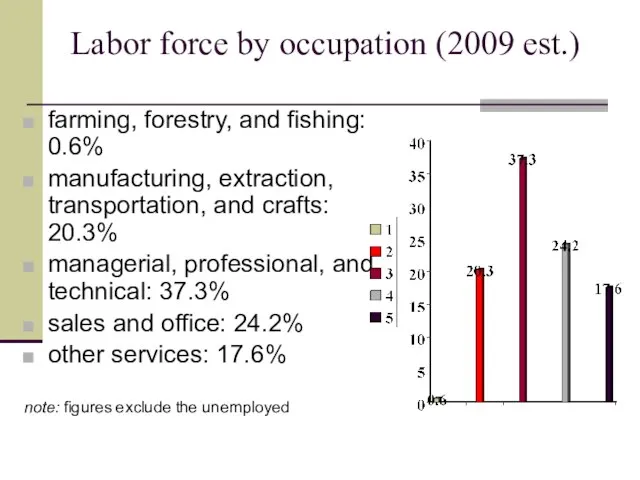
- 20. Labor force by occupation (2009 est.) farming, forestry, and fishing: 0.6% manufacturing, extraction, transportation, and crafts:
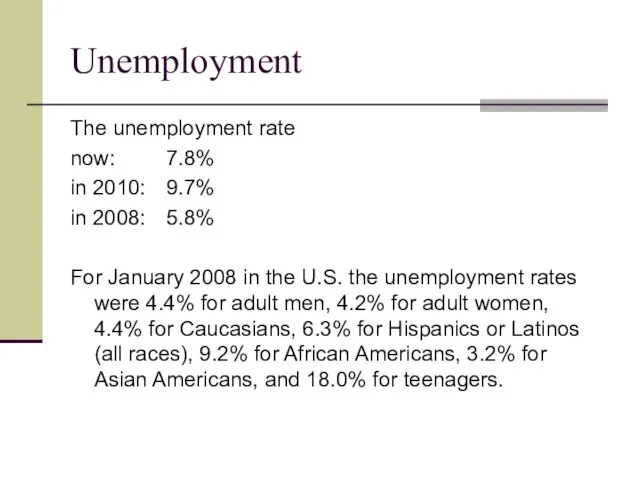
- 21. Unemployment The unemployment rate now: 7.8% in 2010: 9.7% in 2008: 5.8% For January 2008 in
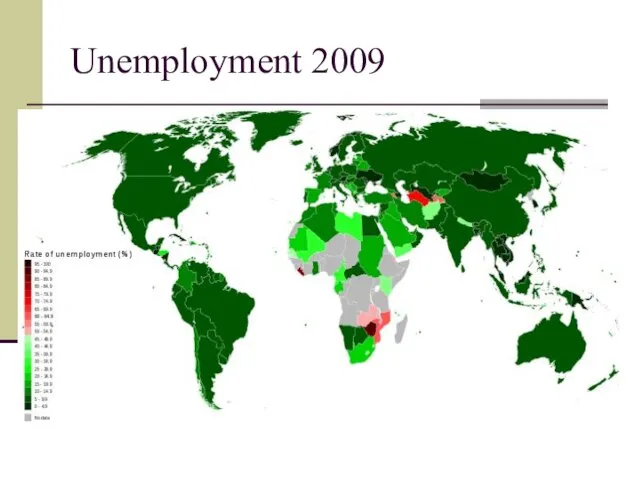
- 22. Unemployment 2009
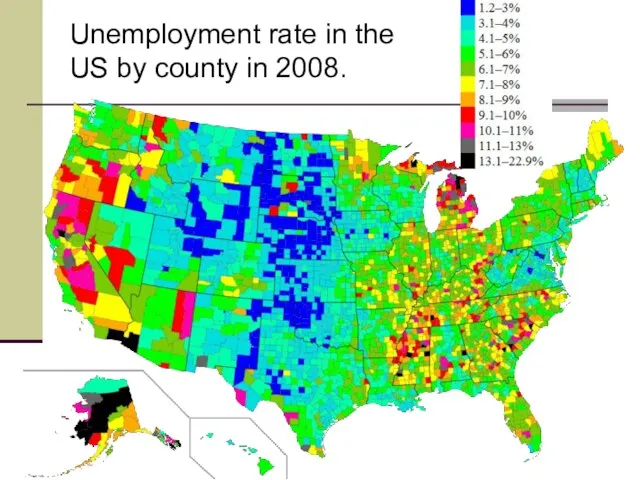
- 23. Unemployment rate in the US by county in 2008.
- 24. Productivity In 2009, the United States had the third highest labor productivity per person in the
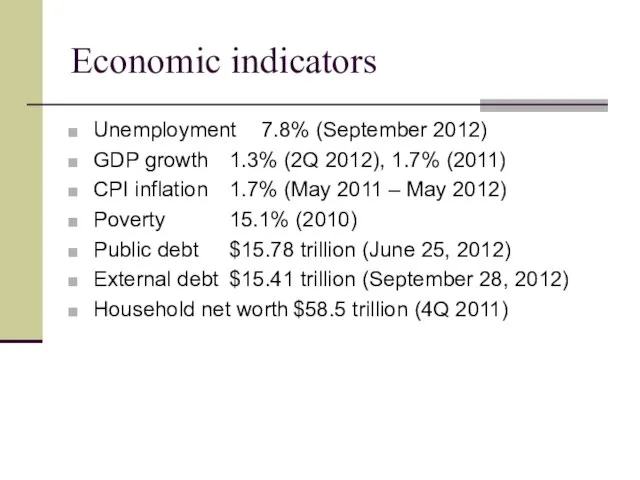
- 25. Economic indicators Unemployment 7.8% (September 2012) GDP growth 1.3% (2Q 2012), 1.7% (2011) CPI inflation 1.7%
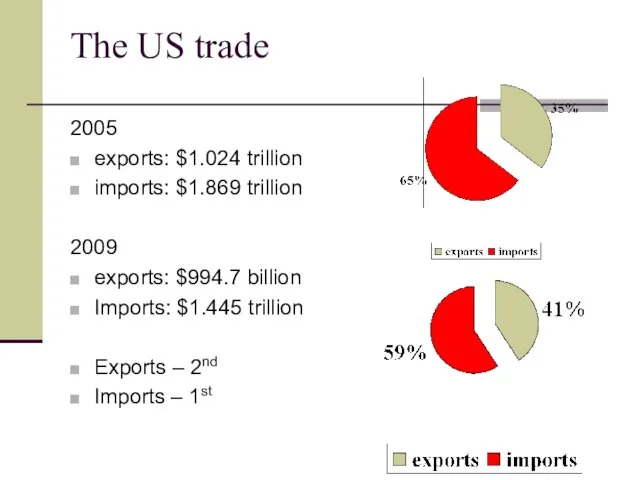
- 26. The US trade 2005 exports: $1.024 trillion imports: $1.869 trillion 2009 exports: $994.7 billion Imports: $1.445
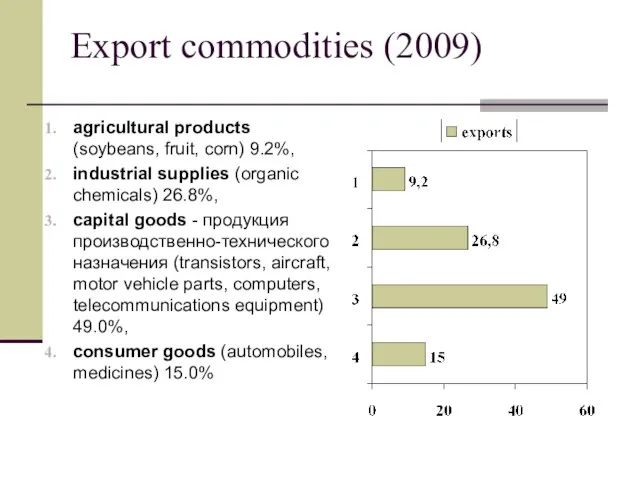
- 27. Export commodities (2009) agricultural products (soybeans, fruit, corn) 9.2%, industrial supplies (organic chemicals) 26.8%, capital goods
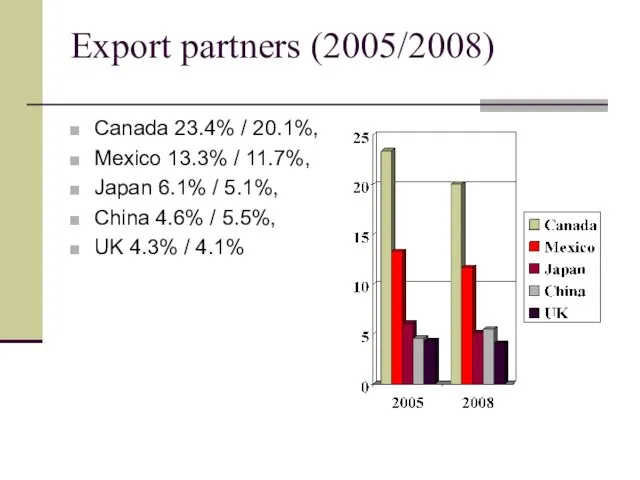
- 28. Export partners (2005/2008) Canada 23.4% / 20.1%, Mexico 13.3% / 11.7%, Japan 6.1% / 5.1%, China
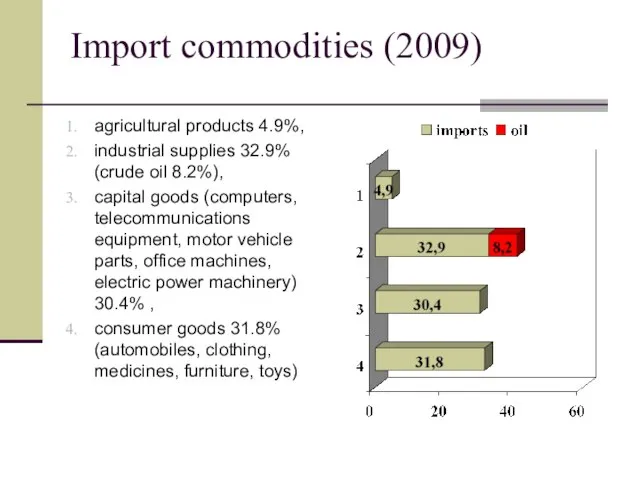
- 29. Import commodities (2009) agricultural products 4.9%, industrial supplies 32.9% (crude oil 8.2%), capital goods (computers, telecommunications
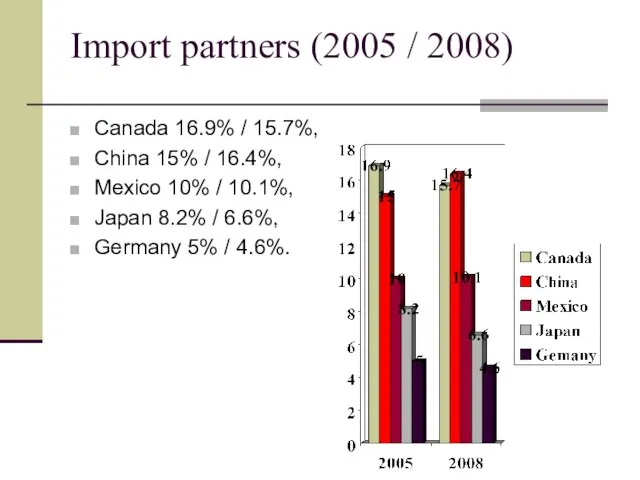
- 30. Import partners (2005 / 2008) Canada 16.9% / 15.7%, China 15% / 16.4%, Mexico 10% /
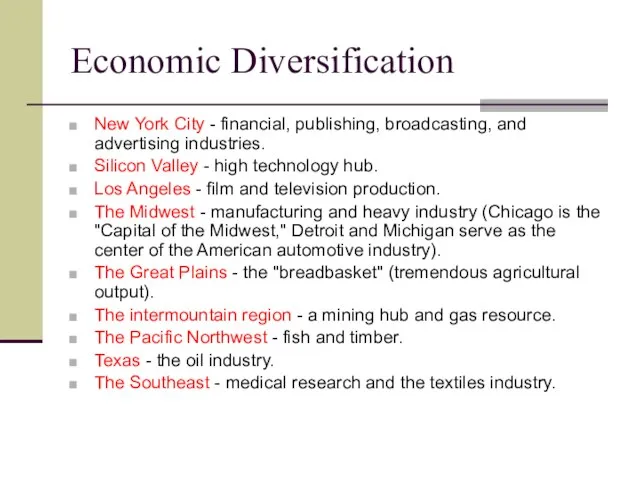
- 31. Economic Diversification New York City - financial, publishing, broadcasting, and advertising industries. Silicon Valley - high
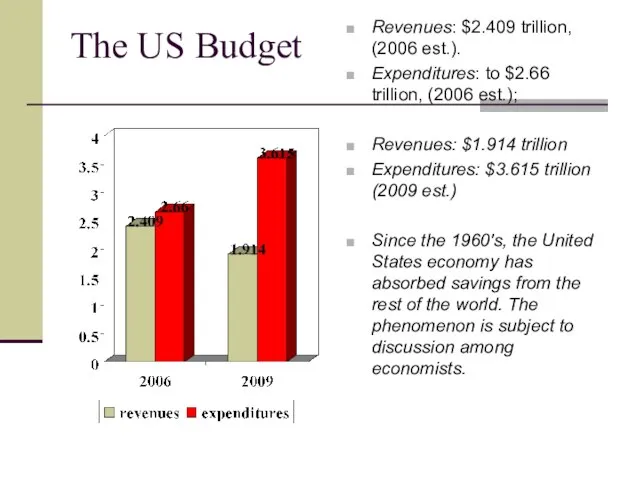
- 32. The US Budget Revenues: $2.409 trillion, (2006 est.). Expenditures: to $2.66 trillion, (2006 est.); Revenues: $1.914
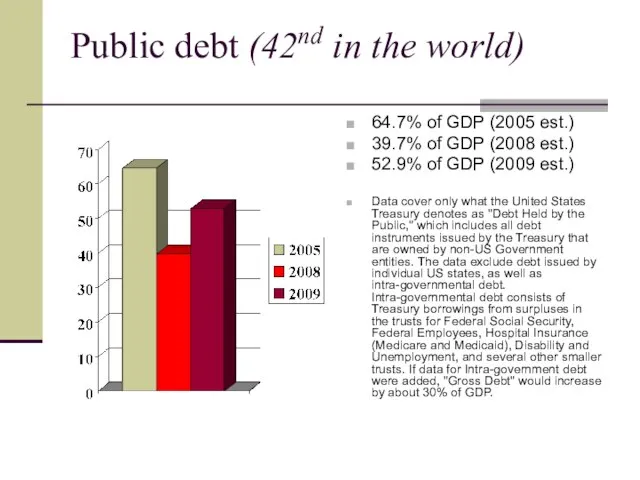
- 33. Public debt (42nd in the world) 64.7% of GDP (2005 est.) 39.7% of GDP (2008 est.)
- 34. Summary Debt Accounting The Summary Debt Accounting program is responsible for accounting for the public debt
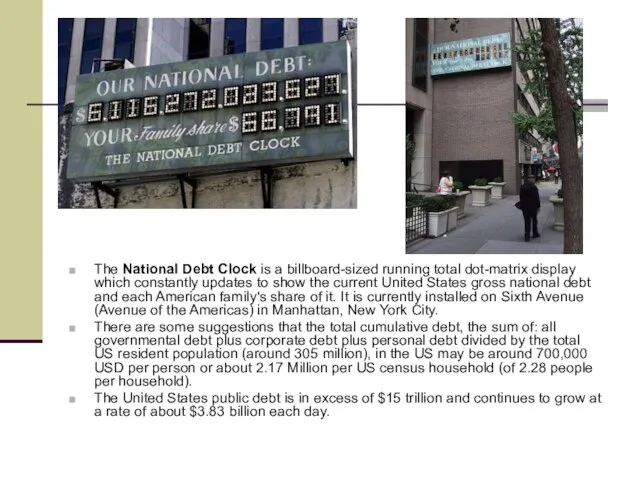
- 35. The National Debt Clock is a billboard-sized running total dot-matrix display which constantly updates to show
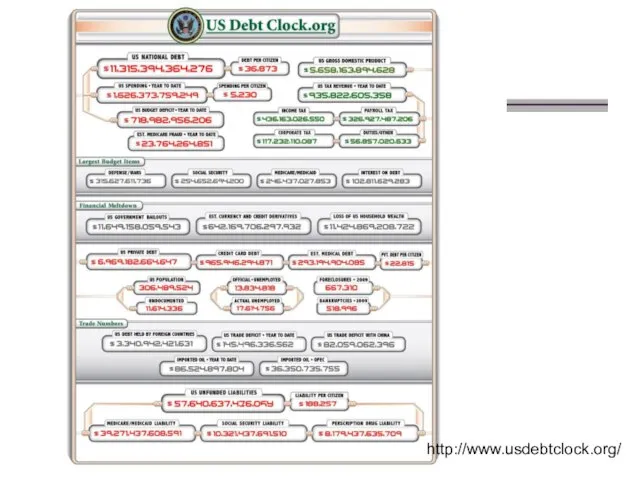
- 36. http://www.usdebtclock.org/
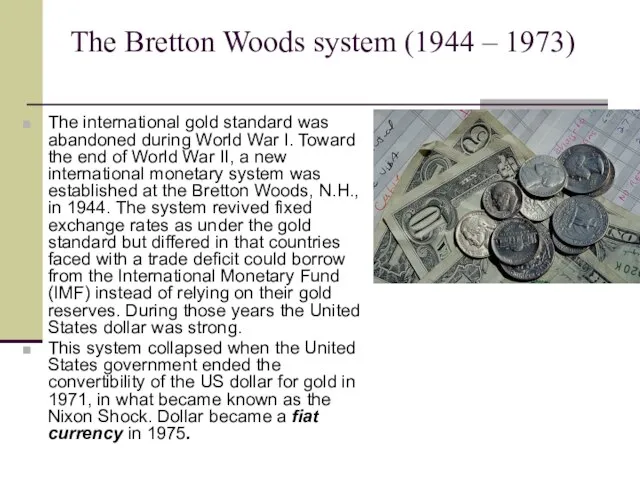
- 37. The Bretton Woods system (1944 – 1973) The international gold standard was abandoned during World War
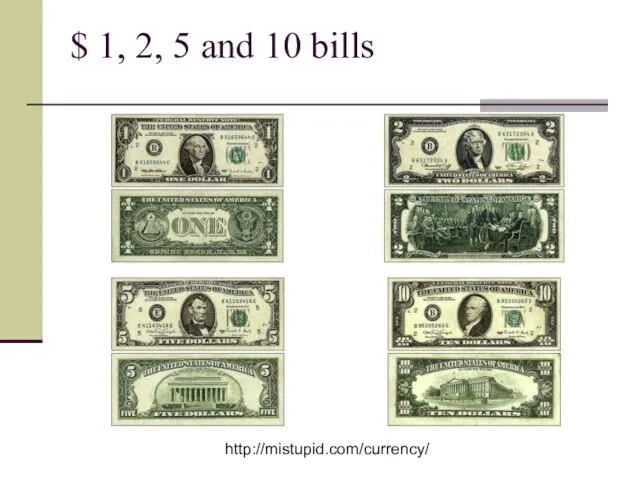
- 38. $ 1, 2, 5 and 10 bills http://mistupid.com/currency/
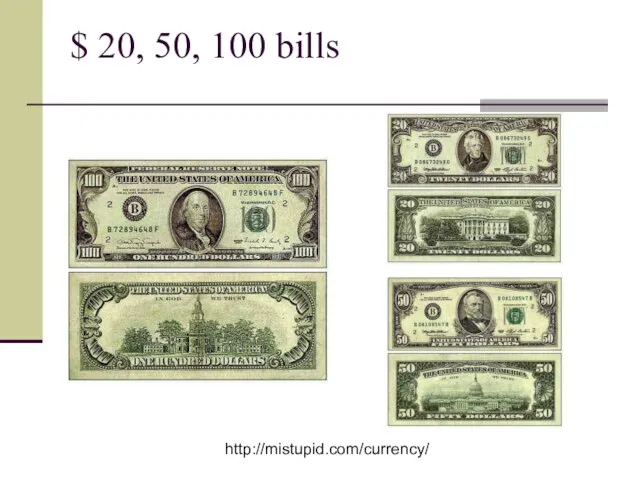
- 39. $ 20, 50, 100 bills http://mistupid.com/currency/
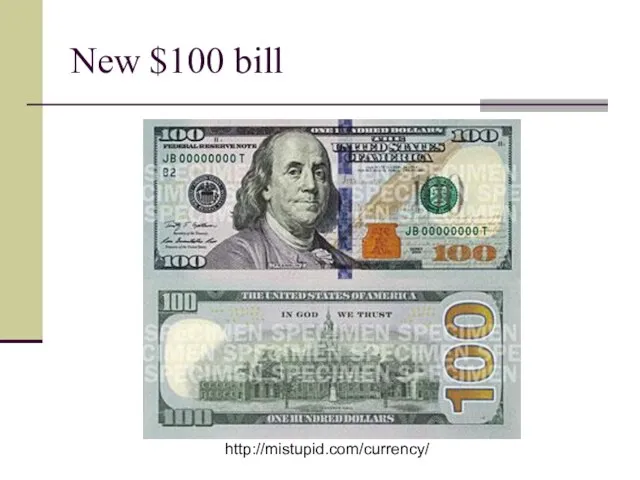
- 40. New $100 bill http://mistupid.com/currency/
- 41. Financial markets About 60% of the global currency reserves have been invested in the United States
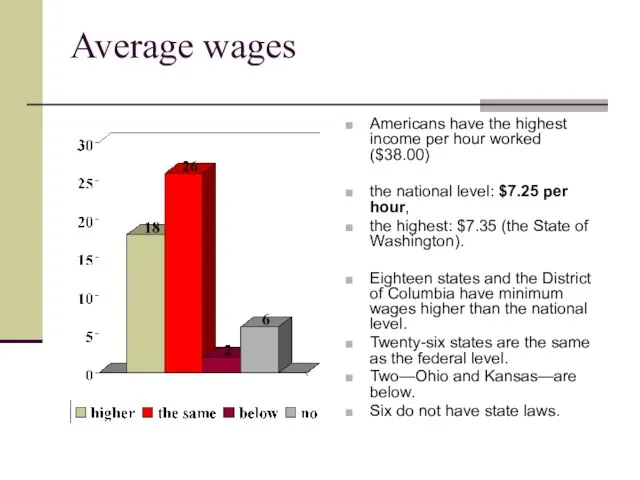
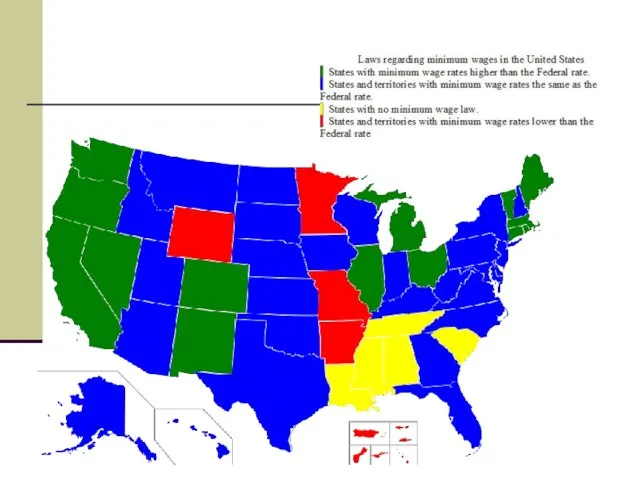
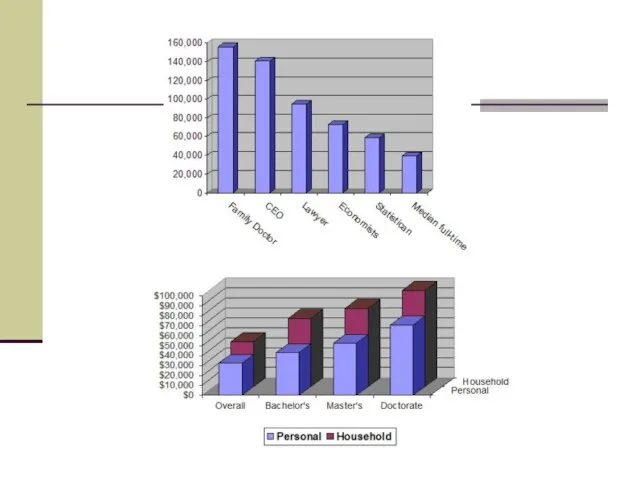
- 42. Average wages Americans have the highest income per hour worked ($38.00) the national level: $7.25 per
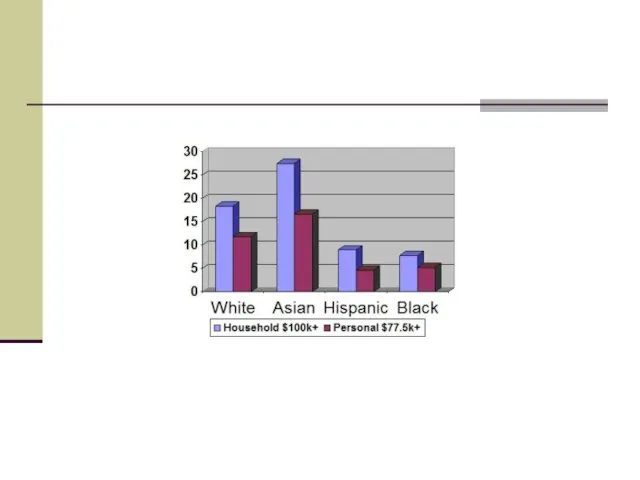
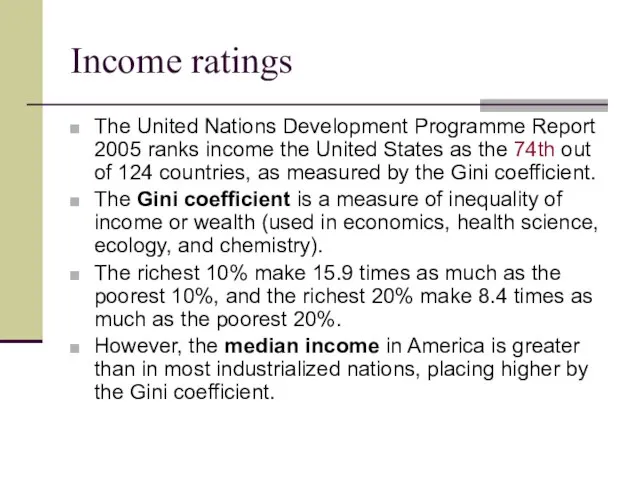
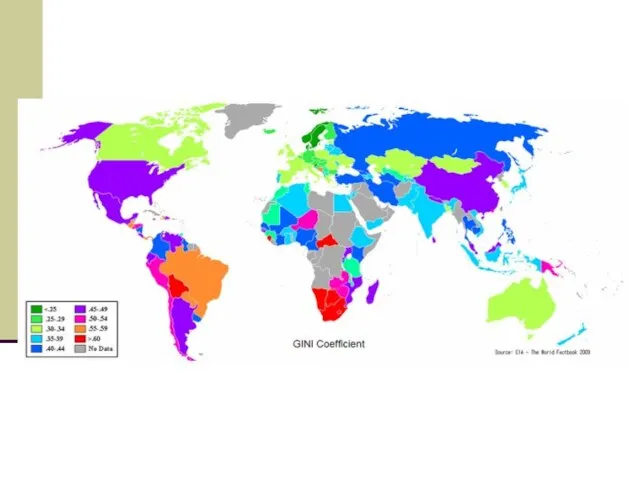
- 46. Income ratings The United Nations Development Programme Report 2005 ranks income the United States as the
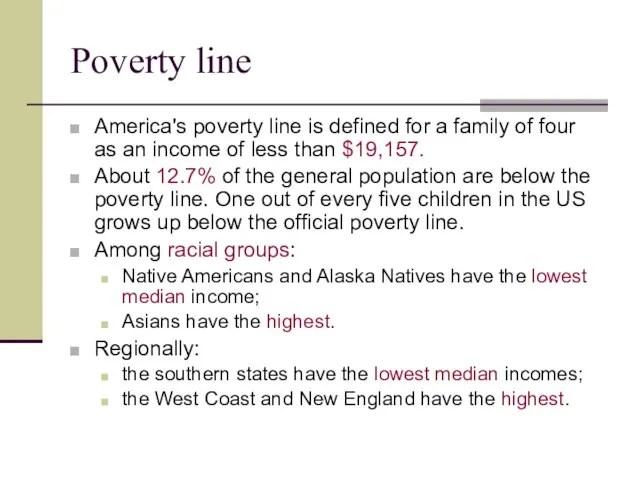
- 48. Poverty line America's poverty line is defined for a family of four as an income of
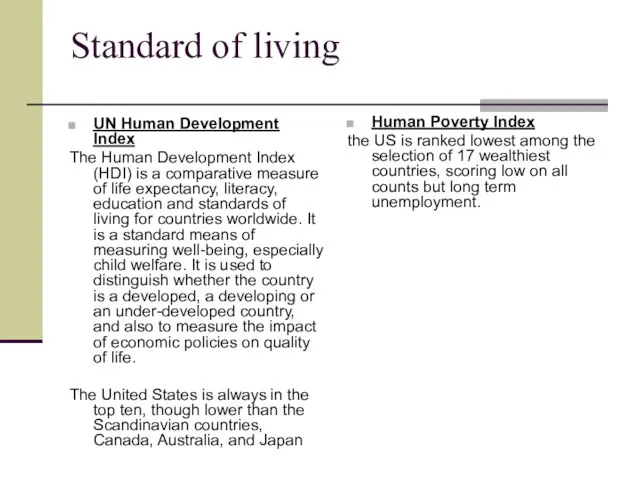
- 49. Standard of living UN Human Development Index The Human Development Index (HDI) is a comparative measure
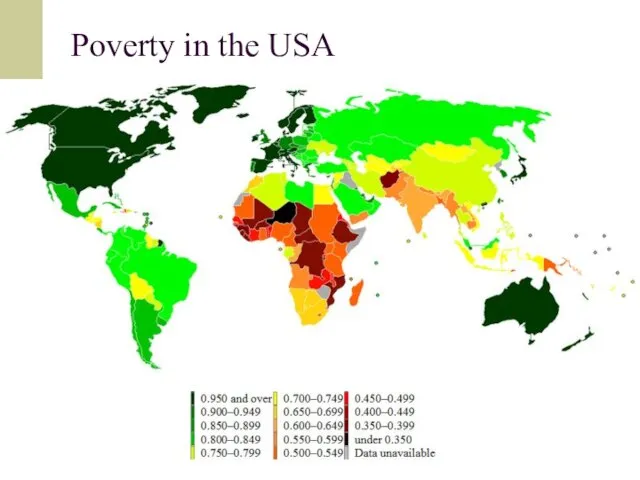
- 50. Poverty in the USA
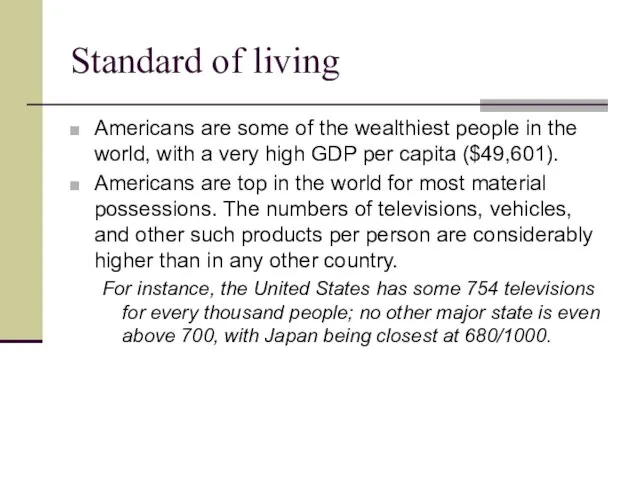
- 51. Standard of living Americans are some of the wealthiest people in the world, with a very
- 52. What is FiDi?
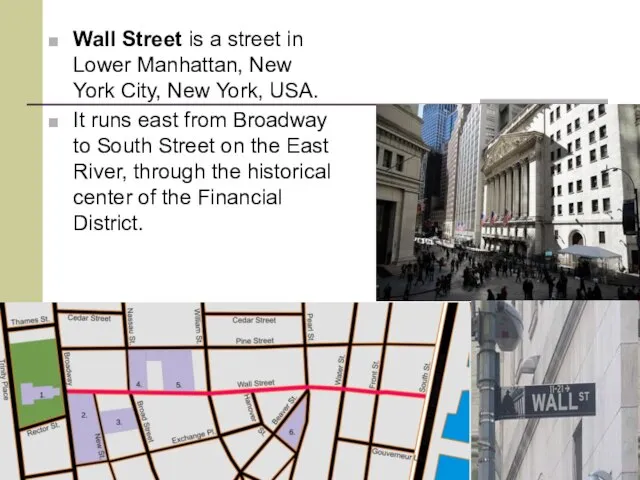
- 53. Financial District The Financial District of New York City (sometimes called FiDi) is a neighborhood on
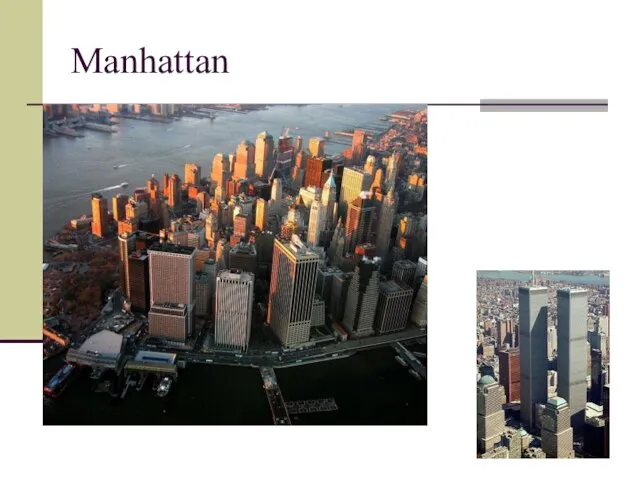
- 54. Manhattan
- 55. Wall Street is a street in Lower Manhattan, New York City, New York, USA. It runs
- 56. What is Wall Street?
- 57. Wall Street
- 58. Wall Street in films The film Die Hard with a Vengeance has a plot involving thieves
- 59. Wall Street in films In the film National Treasure a clue to finding the Templar Treasure
- 60. What is NYSE?
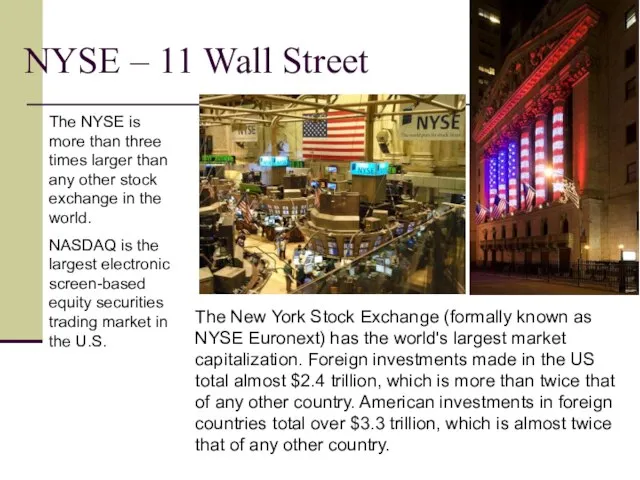
- 61. NYSE – 11 Wall Street The New York Stock Exchange (formally known as NYSE Euronext) has
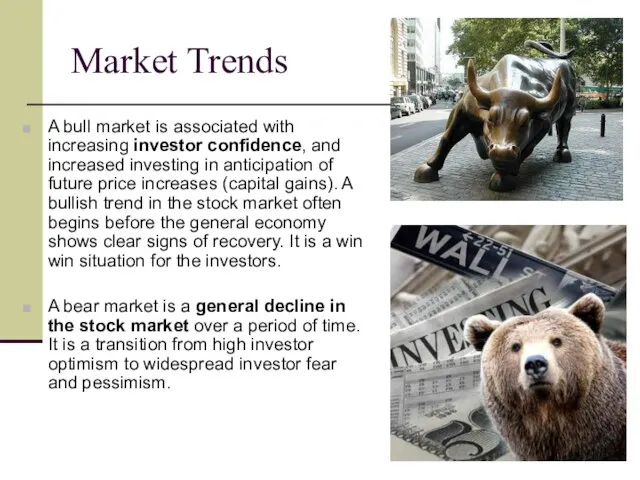
- 62. Market Trends A bull market is associated with increasing investor confidence, and increased investing in anticipation
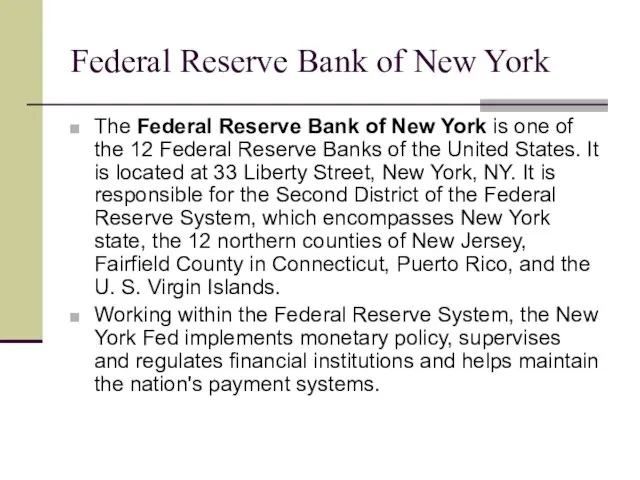
- 65. Federal Reserve Bank of New York The Federal Reserve Bank of New York is one of
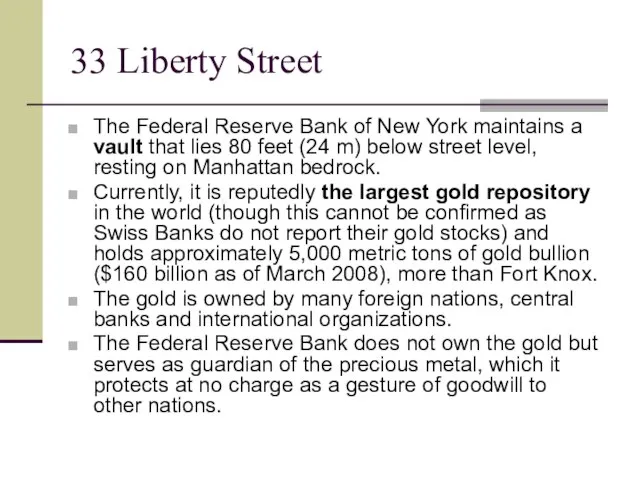
- 67. 33 Liberty Street The Federal Reserve Bank of New York maintains a vault that lies 80
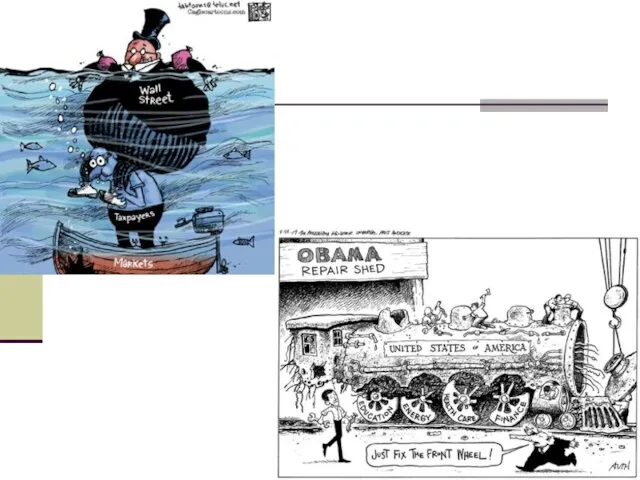
- 69. World Crisis
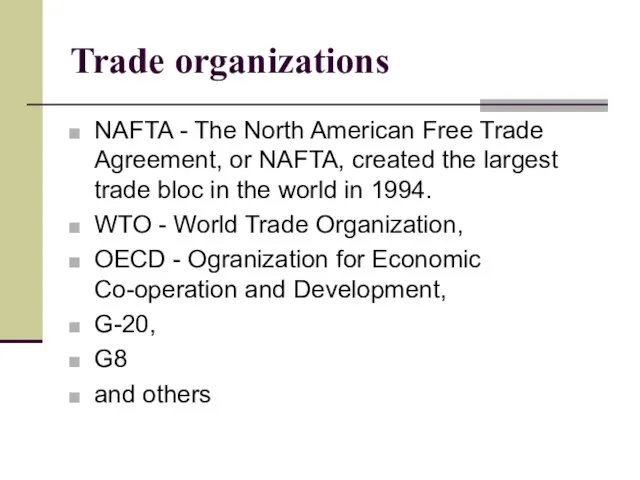
- 71. Trade organizations NAFTA - The North American Free Trade Agreement, or NAFTA, created the largest trade
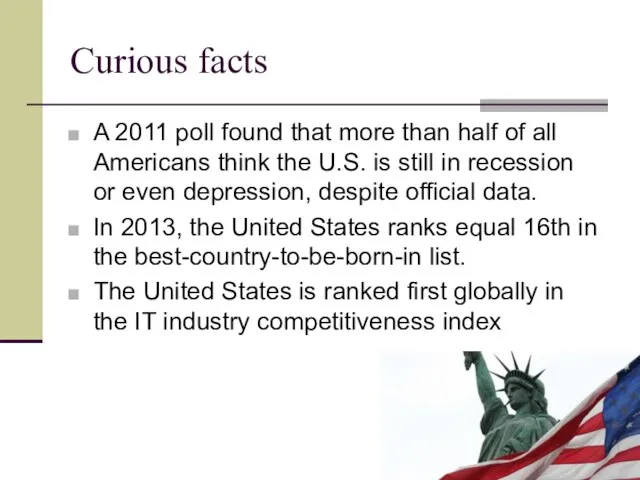
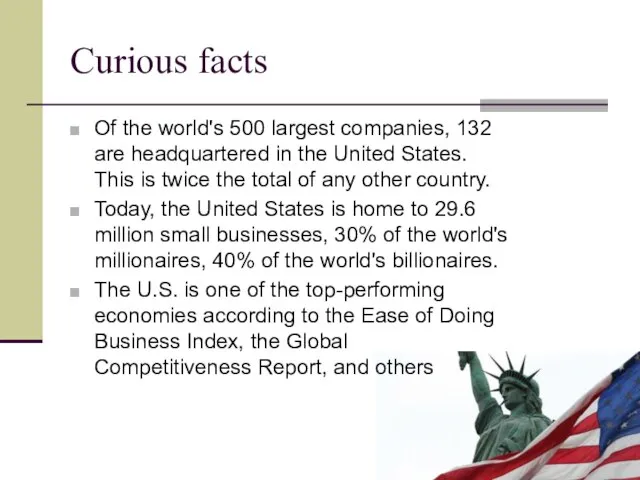
- 72. Curious facts A 2011 poll found that more than half of all Americans think the U.S.
- 73. Curious facts Of the world's 500 largest companies, 132 are headquartered in the United States. This
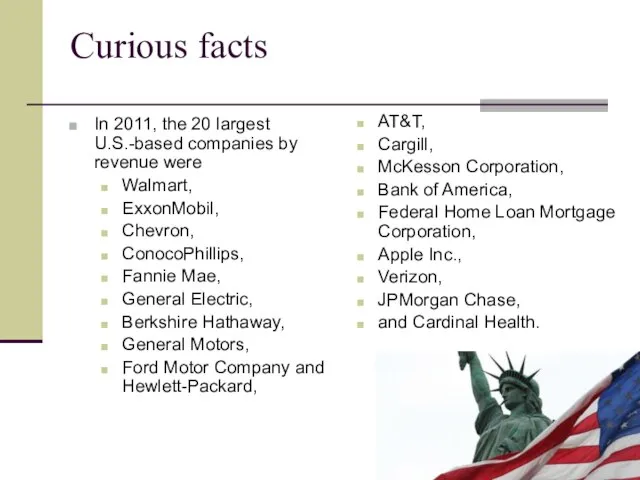
- 75. Curious facts In 2011, the 20 largest U.S.-based companies by revenue were Walmart, ExxonMobil, Chevron, ConocoPhillips,
- 76. Curious facts Apple, Google, IBM, McDonald's, and Microsoft are the world's five most valuable brands in
- 77. Curious facts The United States has been the birthplace of 161 of Britannica's 321 Great Inventions,
- 78. Demographics
- 79. Population (2013 est.) Population: 315,591,000 (3rd) Density: 34.2/km2 or 88.6/sq mi Urbanized population: 82% (the worldwide
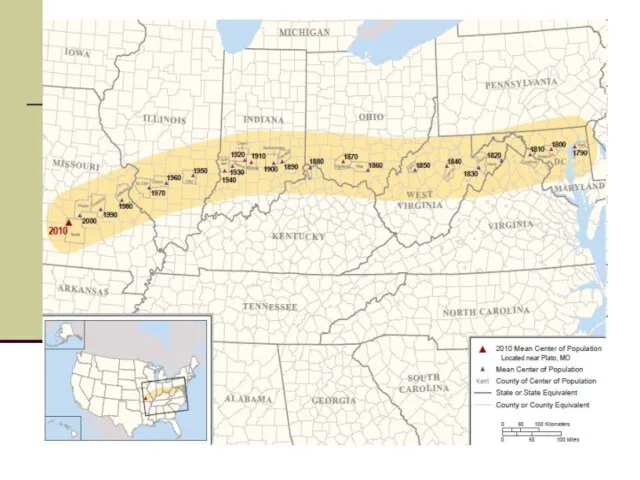
- 80. California and Texas are the most populous states, as the mean center of United States population
- 82. Population distribution The mean center of the U.S. population continues to drift farther west and south.
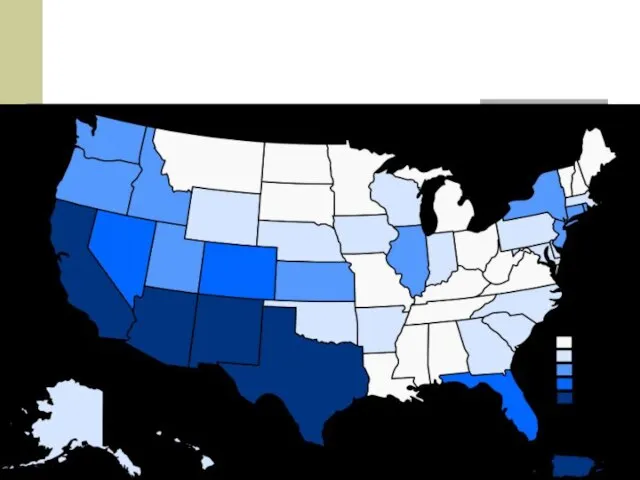
- 84. Major population tendencies the mass immigration of Hispanics from Latin America into the Southwest, which is
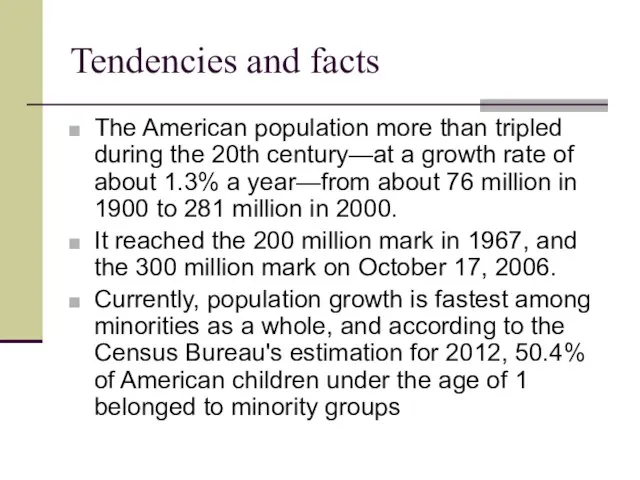
- 86. Tendencies and facts The American population more than tripled during the 20th century—at a growth rate
- 87. Cities The United States has dozens of major cities, including 9 of the 66 "global cities"
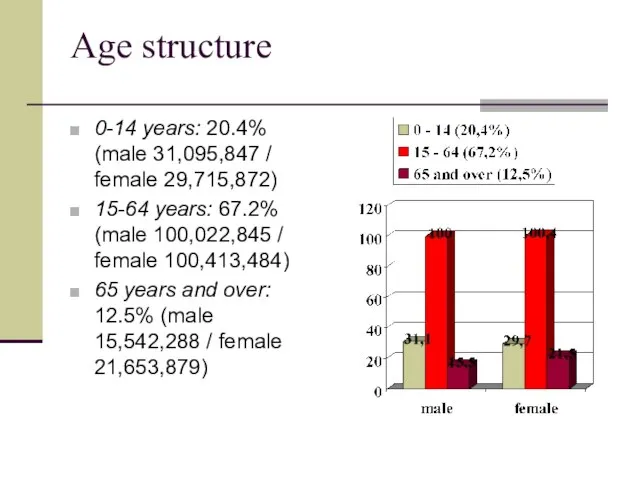
- 88. Age structure 0-14 years: 20.4% (male 31,095,847 / female 29,715,872) 15-64 years: 67.2% (male 100,022,845 /
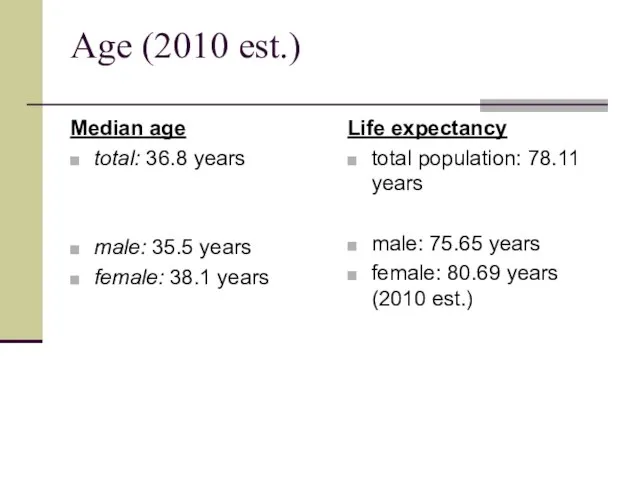
- 89. Age (2010 est.) Median age total: 36.8 years male: 35.5 years female: 38.1 years Life expectancy
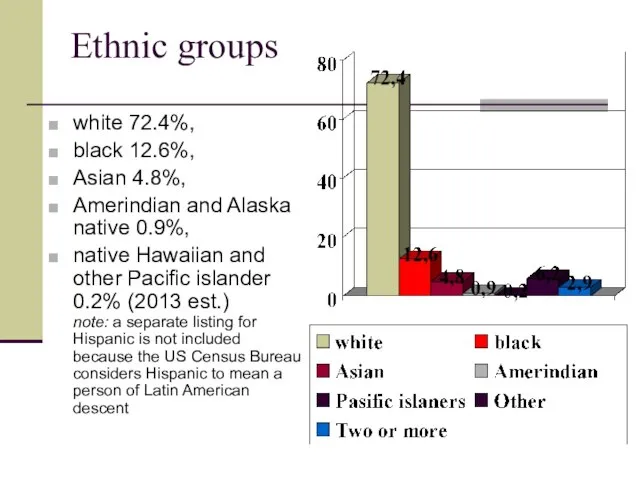
- 90. Ethnic groups white 72.4%, black 12.6%, Asian 4.8%, Amerindian and Alaska native 0.9%, native Hawaiian and
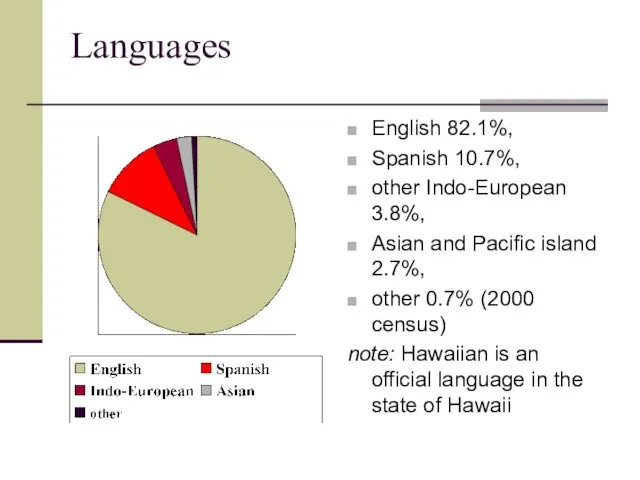
- 93. Languages English 82.1%, Spanish 10.7%, other Indo-European 3.8%, Asian and Pacific island 2.7%, other 0.7% (2000
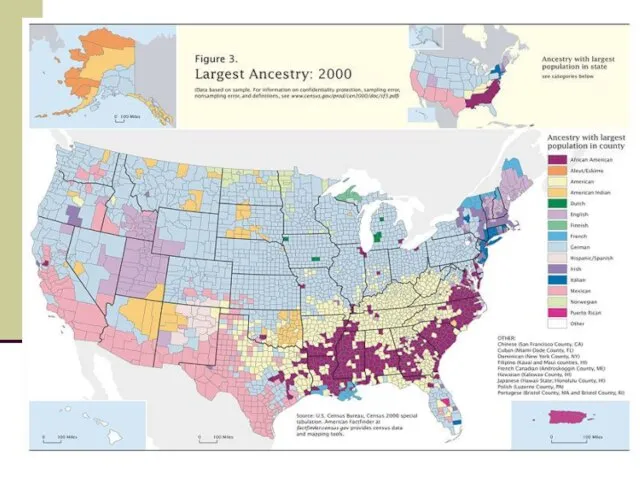
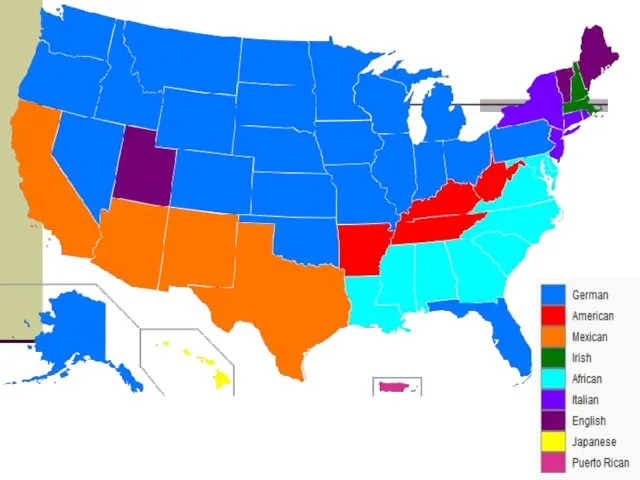
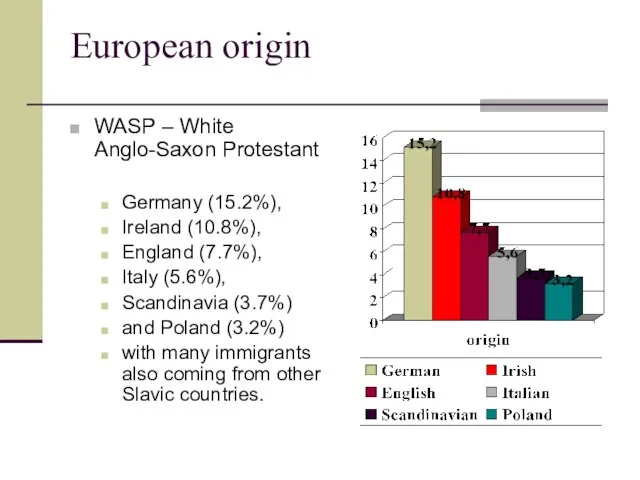
- 94. European origin WASP – White Anglo-Saxon Protestant Germany (15.2%), Ireland (10.8%), England (7.7%), Italy (5.6%), Scandinavia
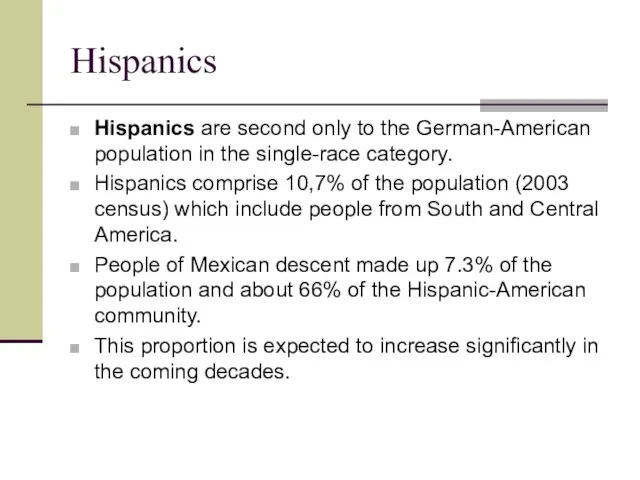
- 95. Hispanics Hispanics are second only to the German-American population in the single-race category. Hispanics comprise 10,7%
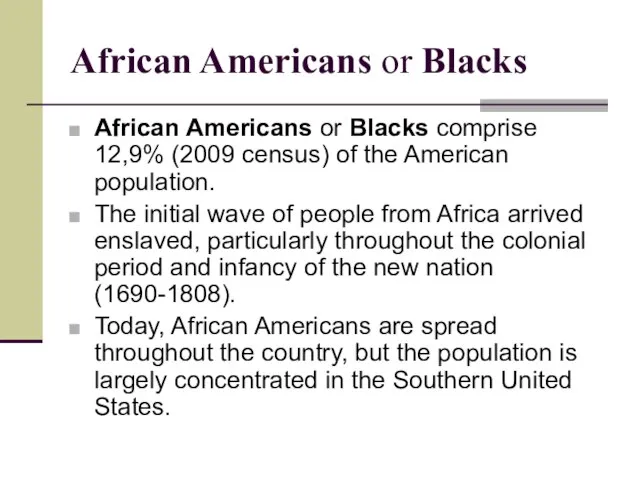
- 96. African Americans or Blacks African Americans or Blacks comprise 12,9% (2009 census) of the American population.
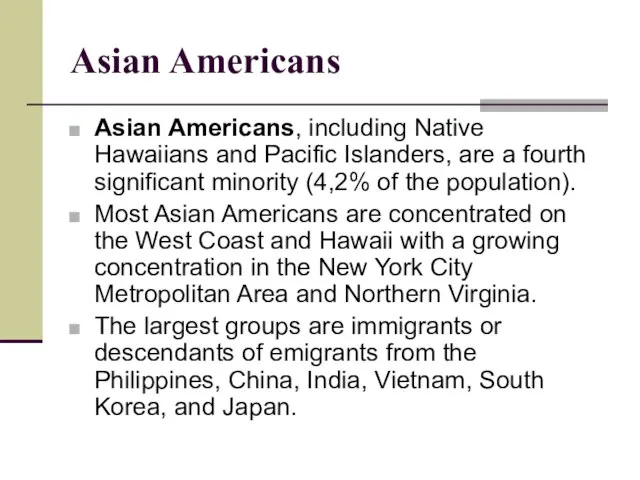
- 97. Asian Americans Asian Americans, including Native Hawaiians and Pacific Islanders, are a fourth significant minority (4,2%
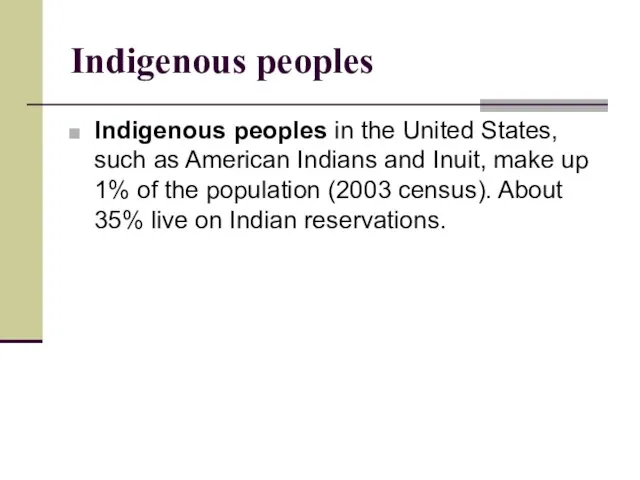
- 98. Indigenous peoples Indigenous peoples in the United States, such as American Indians and Inuit, make up
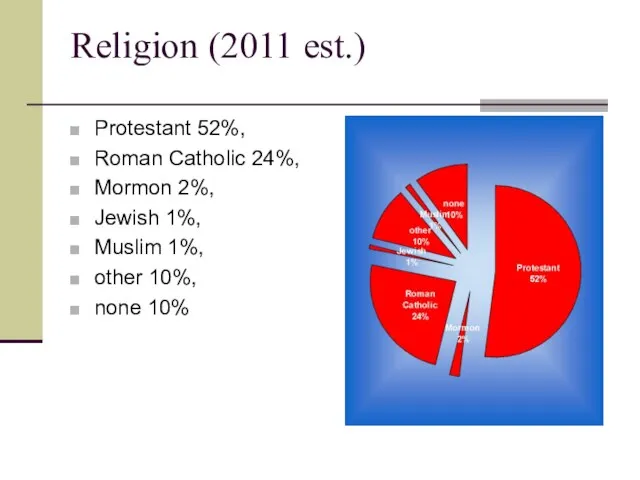
- 99. Religion (2011 est.) Protestant 52%, Roman Catholic 24%, Mormon 2%, Jewish 1%, Muslim 1%, other 10%,
- 100. Religion
- 101. Christian denominations Catholic, Baptist, Methodist, Lutheran, Presbyterian, Pentecostal (Charismatic or Evangelical), Episcopalian, Latter-Day Saints, Church of
- 102. Religiosity The United States is noteworthy among developed nations for its relatively high level of religiosity.
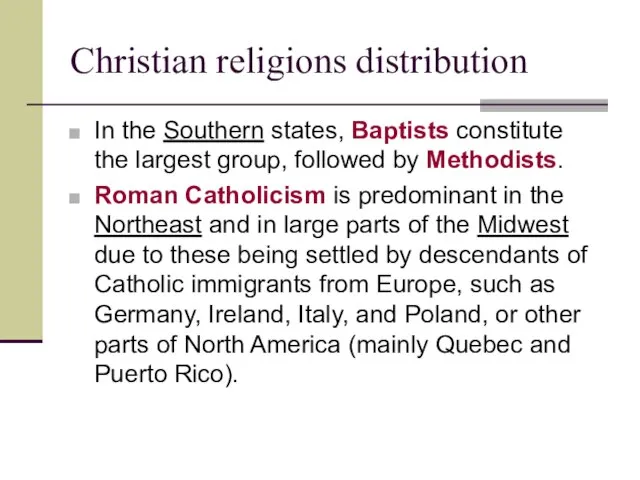
- 103. Christian religions distribution In the Southern states, Baptists constitute the largest group, followed by Methodists. Roman
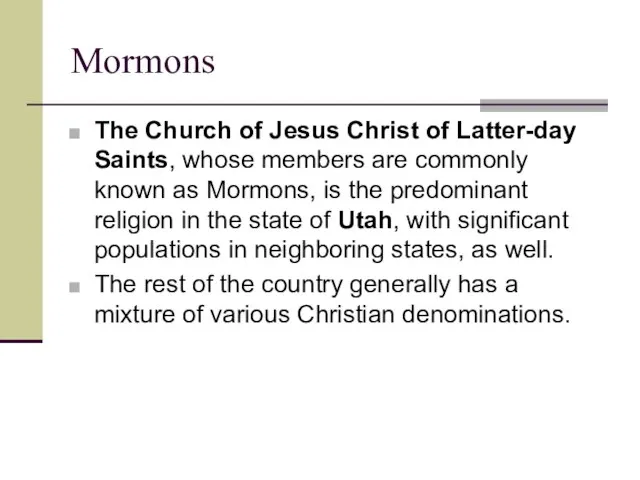
- 104. Mormons The Church of Jesus Christ of Latter-day Saints, whose members are commonly known as Mormons,
- 106. Скачать презентацию
Слайд 2Economy
It is market-oriented economy.
The United States has the largest,most technologically powerful
Economy
It is market-oriented economy.
The United States has the largest,most technologically powerful
Слайд 3GDP – 1st place
$15.6 trillion equals to 19% of global GDP (2012)
GDP – 1st place
$15.6 trillion equals to 19% of global GDP (2012)
Слайд 4GDP (2008) – largest economies
GDP (2008) – largest economies
Слайд 52005 – largest economies
2005 – largest economies
Слайд 8Economy’s strengths
an abundance of natural resources,
a well-developed infrastructure,
and high productivity,
one
Economy’s strengths
an abundance of natural resources,
a well-developed infrastructure,
and high productivity,
one
Слайд 9Natural Resources
The United States has many natural resources, including coal, copper,
Natural Resources
The United States has many natural resources, including coal, copper,
Слайд 10Main agricultural products
In agriculture, it is a top producer of wheat, corn,
Main agricultural products
In agriculture, it is a top producer of wheat, corn,
Слайд 11GDP - composition by sector (2009 est.)
agriculture: (1.2%),
industry: (21.9%),
services: (76.9%)
GDP - composition by sector (2009 est.)
agriculture: (1.2%),
industry: (21.9%),
services: (76.9%)
Слайд 12Leading
positions
Chemical products are the leading manufacturing field.
The United States is
Leading
positions
Chemical products are the leading manufacturing field.
The United States is
Слайд 13Main industries:
petroleum, steel, motor vehicles, aerospace, telecommunications, chemicals, creative industries, electronics, food
Main industries:
petroleum, steel, motor vehicles, aerospace, telecommunications, chemicals, creative industries, electronics, food
Слайд 14The tourist sector
In 2003, the United States was ranked as the third
The tourist sector
In 2003, the United States was ranked as the third
Слайд 17US Labor Force
In August 2010: 154.1 million people
Unemployment rate 9.7%
In 2006: 151.4
US Labor Force
In August 2010: 154.1 million people
Unemployment rate 9.7%
In 2006: 151.4
Слайд 18US labor force 154,100,000
US labor force 154,100,000
Слайд 19Labor force employment
With 21.2 million people, government is the leading field of
Labor force employment
With 21.2 million people, government is the leading field of
Слайд 20Labor force by occupation (2009 est.)
farming, forestry, and fishing: 0.6%
manufacturing, extraction, transportation,
Labor force by occupation (2009 est.)
farming, forestry, and fishing: 0.6%
manufacturing, extraction, transportation,
Слайд 21Unemployment
The unemployment rate
now: 7.8%
in 2010: 9.7%
in 2008: 5.8%
For January 2008 in
Unemployment
The unemployment rate
now: 7.8%
in 2010: 9.7%
in 2008: 5.8%
For January 2008 in
Слайд 22Unemployment 2009
Unemployment 2009
Слайд 23Unemployment rate in the US by county in 2008.
Unemployment rate in the US by county in 2008.
Слайд 24Productivity
In 2009, the United States had the third highest labor productivity per
Productivity
In 2009, the United States had the third highest labor productivity per

Слайд 25Economic indicators
Unemployment 7.8% (September 2012)
GDP growth 1.3% (2Q 2012), 1.7% (2011)
CPI inflation 1.7% (May 2011
Economic indicators
Unemployment 7.8% (September 2012)
GDP growth 1.3% (2Q 2012), 1.7% (2011)
CPI inflation 1.7% (May 2011
Слайд 26The US trade
2005
exports: $1.024 trillion
imports: $1.869 trillion
2009
exports: $994.7 billion
Imports: $1.445 trillion
Exports –
The US trade
2005
exports: $1.024 trillion
imports: $1.869 trillion
2009
exports: $994.7 billion
Imports: $1.445 trillion
Exports –
Слайд 27Export commodities (2009)
agricultural products (soybeans, fruit, corn) 9.2%,
industrial supplies (organic
Export commodities (2009)
agricultural products (soybeans, fruit, corn) 9.2%,
industrial supplies (organic
Слайд 28Export partners (2005/2008)
Canada 23.4% / 20.1%,
Mexico 13.3% / 11.7%,
Japan 6.1%
Export partners (2005/2008)
Canada 23.4% / 20.1%,
Mexico 13.3% / 11.7%,
Japan 6.1%
Слайд 29Import commodities (2009)
agricultural products 4.9%,
industrial supplies 32.9% (crude oil 8.2%),
capital
Import commodities (2009)
agricultural products 4.9%,
industrial supplies 32.9% (crude oil 8.2%),
capital
Слайд 30Import partners (2005 / 2008)
Canada 16.9% / 15.7%,
China 15% / 16.4%,
Import partners (2005 / 2008)
Canada 16.9% / 15.7%,
China 15% / 16.4%,
Слайд 31Economic Diversification
New York City - financial, publishing, broadcasting, and advertising industries.
Silicon
Economic Diversification
New York City - financial, publishing, broadcasting, and advertising industries.
Silicon
Слайд 32The US Budget
Revenues: $2.409 trillion, (2006 est.).
Expenditures: to $2.66 trillion, (2006 est.);
Revenues:
The US Budget
Revenues: $2.409 trillion, (2006 est.).
Expenditures: to $2.66 trillion, (2006 est.);
Revenues:
Слайд 33Public debt (42nd in the world)
64.7% of GDP (2005 est.)
39.7% of GDP
Public debt (42nd in the world)
64.7% of GDP (2005 est.)
39.7% of GDP
Слайд 34Summary Debt Accounting
The Summary Debt Accounting program is responsible for accounting
Summary Debt Accounting
The Summary Debt Accounting program is responsible for accounting
Слайд 35The National Debt Clock is a billboard-sized running total dot-matrix display which
The National Debt Clock is a billboard-sized running total dot-matrix display which
Слайд 36http://www.usdebtclock.org/
http://www.usdebtclock.org/
Слайд 37The Bretton Woods system (1944 – 1973)
The international gold standard was abandoned
The Bretton Woods system (1944 – 1973)
The international gold standard was abandoned
Слайд 38$ 1, 2, 5 and 10 bills
http://mistupid.com/currency/
$ 1, 2, 5 and 10 bills
http://mistupid.com/currency/
Слайд 39$ 20, 50, 100 bills
http://mistupid.com/currency/
$ 20, 50, 100 bills
http://mistupid.com/currency/
Слайд 40New $100 bill
http://mistupid.com/currency/
New $100 bill
http://mistupid.com/currency/
Слайд 41Financial markets
About 60% of the global currency reserves have been invested in
Financial markets
About 60% of the global currency reserves have been invested in
Слайд 42Average wages
Americans have the highest income per hour worked ($38.00)
the national
Average wages
Americans have the highest income per hour worked ($38.00)
the national
Слайд 46Income ratings
The United Nations Development Programme Report 2005 ranks income the United
Income ratings
The United Nations Development Programme Report 2005 ranks income the United
Слайд 48Poverty line
America's poverty line is defined for a family of four as
Poverty line
America's poverty line is defined for a family of four as
Слайд 49Standard of living
UN Human Development Index
The Human Development Index (HDI) is
Standard of living
UN Human Development Index
The Human Development Index (HDI) is
Слайд 50Poverty in the USA
Poverty in the USA
Слайд 51Standard of living
Americans are some of the wealthiest people in the world,
Standard of living
Americans are some of the wealthiest people in the world,
Слайд 52What is FiDi?
What is FiDi?
Слайд 53Financial District
The Financial District of New York City (sometimes called FiDi)
Financial District
The Financial District of New York City (sometimes called FiDi)
Слайд 54Manhattan
Manhattan
Слайд 55Wall Street is a street in Lower Manhattan, New York City, New
Wall Street is a street in Lower Manhattan, New York City, New
Слайд 56What is Wall Street?
What is Wall Street?

Слайд 57Wall Street
Wall Street
Слайд 58Wall Street in films
The film Die Hard with a Vengeance has a
Wall Street in films
The film Die Hard with a Vengeance has a

Слайд 59Wall Street in films
In the film National Treasure a clue to finding
Wall Street in films
In the film National Treasure a clue to finding

Слайд 60What is NYSE?
What is NYSE?

Слайд 61NYSE – 11 Wall Street
The New York Stock Exchange (formally known as
NYSE – 11 Wall Street
The New York Stock Exchange (formally known as
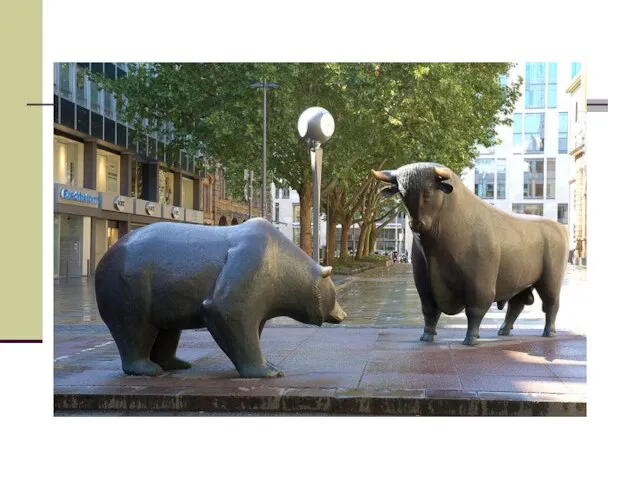
Слайд 62Market Trends
A bull market is associated with increasing investor confidence, and increased
Market Trends
A bull market is associated with increasing investor confidence, and increased
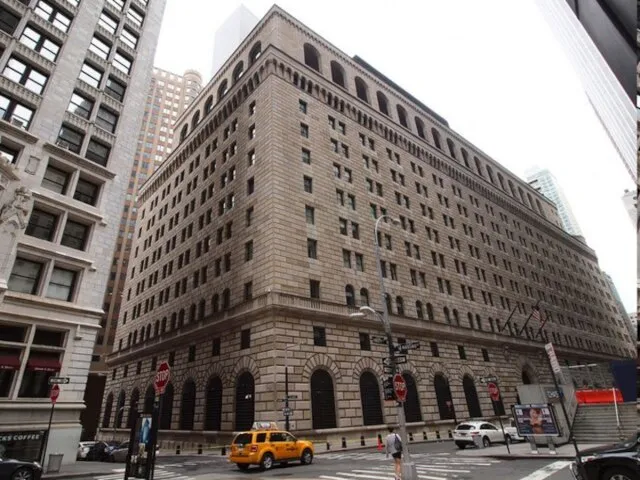
Слайд 65Federal Reserve Bank of New York
The Federal Reserve Bank of New York
Federal Reserve Bank of New York
The Federal Reserve Bank of New York
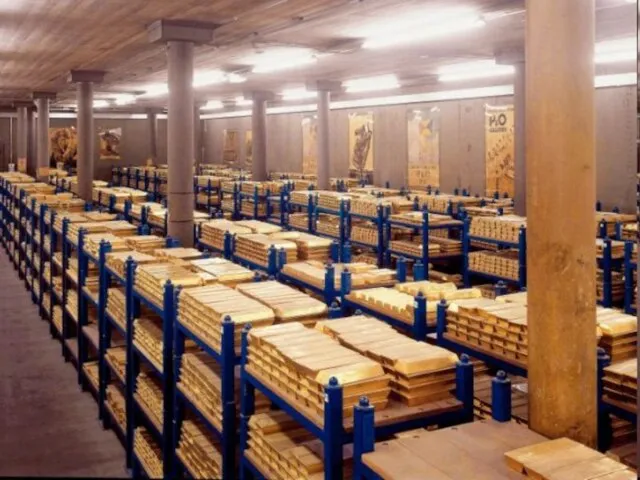
Слайд 6733 Liberty Street
The Federal Reserve Bank of New York maintains a
33 Liberty Street
The Federal Reserve Bank of New York maintains a

Слайд 69World Crisis
World Crisis

Слайд 71Trade organizations
NAFTA - The North American Free Trade Agreement, or NAFTA, created
Trade organizations
NAFTA - The North American Free Trade Agreement, or NAFTA, created
Слайд 72Curious facts
A 2011 poll found that more than half of all Americans
Curious facts
A 2011 poll found that more than half of all Americans
Слайд 73Curious facts
Of the world's 500 largest companies, 132 are headquartered in the
Curious facts
Of the world's 500 largest companies, 132 are headquartered in the

Слайд 75Curious facts
In 2011, the 20 largest U.S.-based companies by revenue were
Walmart,
Curious facts
In 2011, the 20 largest U.S.-based companies by revenue were
Walmart,
Слайд 76Curious facts
Apple, Google, IBM, McDonald's, and Microsoft are the world's five most
Curious facts
Apple, Google, IBM, McDonald's, and Microsoft are the world's five most
Слайд 77Curious facts
The United States has been the birthplace of 161 of Britannica's
Curious facts
The United States has been the birthplace of 161 of Britannica's
Слайд 78Demographics
Demographics

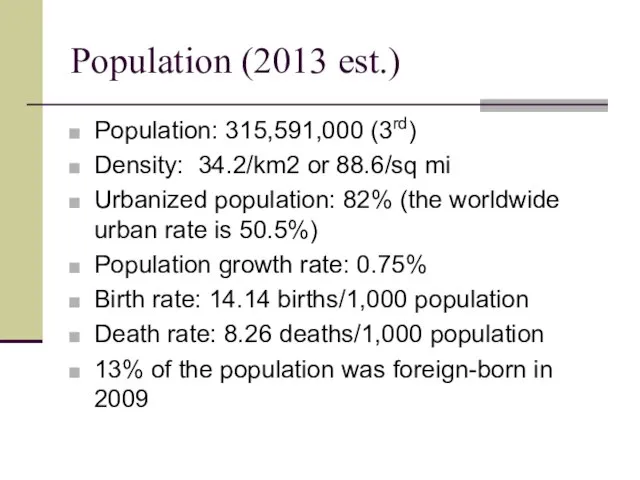
Слайд 79Population (2013 est.)
Population: 315,591,000 (3rd)
Density: 34.2/km2 or 88.6/sq mi
Urbanized population: 82% (the worldwide
Population (2013 est.)
Population: 315,591,000 (3rd)
Density: 34.2/km2 or 88.6/sq mi
Urbanized population: 82% (the worldwide
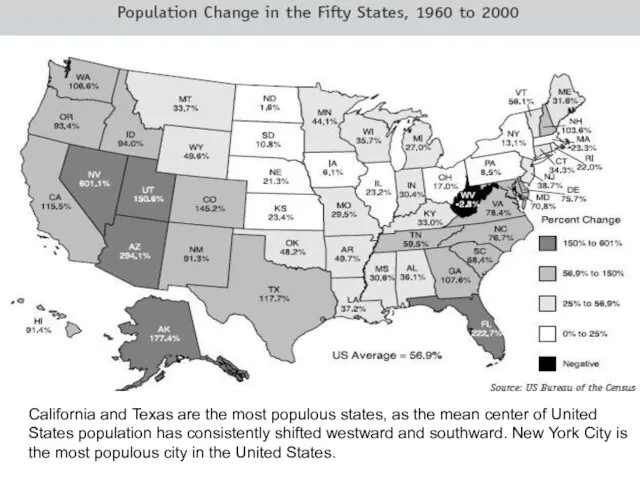
Слайд 80California and Texas are the most populous states, as the mean center
California and Texas are the most populous states, as the mean center
Слайд 82Population distribution
The mean center of the U.S. population continues to drift farther
Population distribution
The mean center of the U.S. population continues to drift farther
Слайд 84Major population tendencies
the mass immigration of Hispanics from Latin America into the
Major population tendencies
the mass immigration of Hispanics from Latin America into the
Слайд 86Tendencies and facts
The American population more than tripled during the 20th century—at
Tendencies and facts
The American population more than tripled during the 20th century—at
Слайд 87Cities
The United States has dozens of major cities, including 9 of the
Cities
The United States has dozens of major cities, including 9 of the
Слайд 88Age structure
0-14 years: 20.4% (male 31,095,847 / female 29,715,872)
15-64 years: 67.2% (male
Age structure
0-14 years: 20.4% (male 31,095,847 / female 29,715,872)
15-64 years: 67.2% (male
Слайд 89Age (2010 est.)
Median age
total: 36.8 years
male: 35.5 years
female: 38.1 years
Life
Age (2010 est.)
Median age
total: 36.8 years
male: 35.5 years
female: 38.1 years
Life
Слайд 90Ethnic groups
white 72.4%,
black 12.6%,
Asian 4.8%,
Amerindian and Alaska native
Ethnic groups
white 72.4%,
black 12.6%,
Asian 4.8%,
Amerindian and Alaska native
Слайд 93Languages
English 82.1%,
Spanish 10.7%,
other Indo-European 3.8%,
Asian and Pacific island 2.7%,
Languages
English 82.1%,
Spanish 10.7%,
other Indo-European 3.8%,
Asian and Pacific island 2.7%,
Слайд 94European origin
WASP – White Anglo-Saxon Protestant
Germany (15.2%),
Ireland (10.8%),
England (7.7%),
Italy
European origin
WASP – White Anglo-Saxon Protestant
Germany (15.2%),
Ireland (10.8%),
England (7.7%),
Italy
Слайд 95Hispanics
Hispanics are second only to the German-American population in the single-race category.
Hispanics
Hispanics are second only to the German-American population in the single-race category.
Слайд 96African Americans or Blacks
African Americans or Blacks comprise 12,9% (2009 census) of
African Americans or Blacks
African Americans or Blacks comprise 12,9% (2009 census) of
Слайд 97Asian Americans
Asian Americans, including Native Hawaiians and Pacific Islanders, are a fourth
Asian Americans
Asian Americans, including Native Hawaiians and Pacific Islanders, are a fourth
Слайд 98Indigenous peoples
Indigenous peoples in the United States, such as American Indians and
Indigenous peoples
Indigenous peoples in the United States, such as American Indians and
Слайд 99Religion (2011 est.)
Protestant 52%,
Roman Catholic 24%,
Mormon 2%,
Jewish 1%,
Muslim
Religion (2011 est.)
Protestant 52%,
Roman Catholic 24%,
Mormon 2%,
Jewish 1%,
Muslim
Слайд 100Religion
Religion
Слайд 101Christian denominations
Catholic,
Baptist,
Methodist,
Lutheran,
Presbyterian,
Pentecostal (Charismatic or Evangelical),
Episcopalian,
Latter-Day Saints,
Christian denominations
Catholic,
Baptist,
Methodist,
Lutheran,
Presbyterian,
Pentecostal (Charismatic or Evangelical),
Episcopalian,
Latter-Day Saints,
Слайд 102Religiosity
The United States is noteworthy among developed nations for its relatively high
Religiosity
The United States is noteworthy among developed nations for its relatively high
Слайд 103Christian religions distribution
In the Southern states, Baptists constitute the largest group, followed
Christian religions distribution
In the Southern states, Baptists constitute the largest group, followed
Слайд 104Mormons
The Church of Jesus Christ of Latter-day Saints, whose members are commonly
Mormons
The Church of Jesus Christ of Latter-day Saints, whose members are commonly
 Этюд. Построение мебели. 8 тема
 Комплексная программаинформационно-аналитическогосопровождения тестирования студентовi-exam.ru
 ВКР: Совершенствование активных методов обслуживания покупателей в магазине
 Развитие методов синтеза, исследование физико-химических и электрофизических свойств модифицированных наноуглеродных и фторугл
 Операционная деятельность в логистике. ПОЧУ Улан-Удэнский торгово-экономический техникум. Егорова Юлия
 Социально-образовательный проект «Телецентр. Школьные новости»
 Как писать жи - ши, ча - ща, чу - щу, чк - чн - нч - нщ?
 Логика
 Презентация на тему Стенокардия
  Автоматическая энергосберегающая система освещения Automatic Energy Saving Lighting System
 Как использовать в измерении социальных медиа практику смежных отраслей?
 Constitution Act, 1982
 Тема 5. Манипулятивные игры как форма социальной активности индивида
 Воспитание 2005
 Группа поддержки спортивных команд GERBERA
 Работа с корпорациями
 Как выполнить чертёж Брусок /стойка/. 10, 11 класс
 Нематериальные активы – скрытые резервы бизнеса: ценности как источник стоимости
 Виды ответственности за невыполнение нормативных правовых актов по охране труда
 Запись простого линейного алгоритма для формального исполнителя
 Обезьяны.
 Управление учебным процессом
 Макаронные изделия Makfa. Акция
 Художественные промыслы Нижегородской области
 Золотое кольцо России город СУЗДАЛЬ
 Типы икон Богородицы
 Диалог консультанта и клиента на примере практического случая
 Презентация на тему Отряд Крокодилы