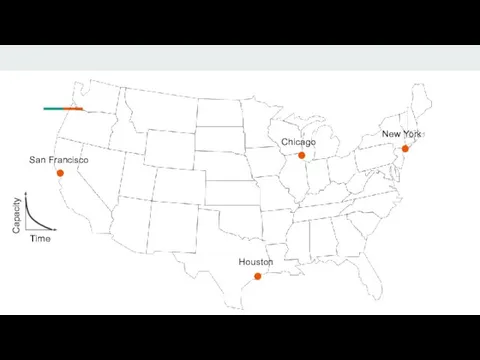
Слайд 2San Francisco
New York
Chicago
Houston
Time
Capacity
Слайд 3Factors
Battery capacity decreases over time and the main factor that affects the
rate of battery degradation is the ambient temperature. The effect of temperature on degradation has been well studied and modeled as a stress factor that accelerates the ongoing degradation process. Degradation processes are accelerated by Temperature Stress Model "S(T)" and SOC (state of charge) Stress Model S(σ).
We couldn’t find a reliable approach to measure S(σ) stress factor which takes specific gravity as inputs to aid in assessing the state of charge, so we decided to use temperature stress factors.
Слайд 4Temperature Stress factor S(T)
We used a research paper and found that the
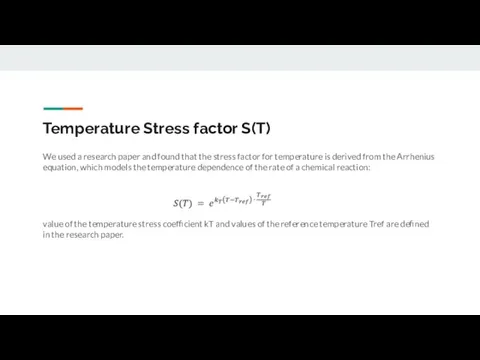
stress factor for temperature is derived from the Arrhenius equation, which models the temperature dependence of the rate of a chemical reaction:
value of the temperature stress coefficient kT and values of the reference temperature Tref are defined in the research paper.
Слайд 5S(T) modelling
We use the temperature in the city of San Francisco to
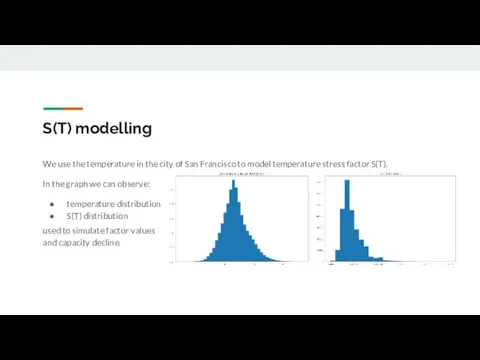
model temperature stress factor S(T).
In the graph we can observe:
temperature distribution
S(T) distribution
used to simulate factor values
and capacity decline.

 Дефицит пресной воды. Миф или реальность?
 Основы безопасности жизнедеятельности
 Информационный сайт ИП Петрушенко А.А.
 Обществознание
 Действия при угрозе по телефону
 Энциклопедия слова Верность
 Латинский язык как международный язык науки
 Защита данных от ошибок ввода
 Презентация на тему Синус и синусоиды в образах
  Презентация на тему Эволюция органического мира
 OS/2 — операционная система фирмы IBM.
 Water Drop
 Кәсіпкерлік және бизнес негіздері
 Константин Георгиевич Паустовский
 ПРЕЗЕНТАЦИЯ ПО РУССКОМУ ЯЗЫКУ ТЕМА: «Обобщающие слова при однородных членах предложения. Знаки препинания при обобщающих словах.
 Подготовка к ЕГЭ. Полезно знать
 Формирование советской государственно-политической системы. Образование СССР
 Презентация без названия (1)
 PR-тексты. Виды PR-текстов, их различия, ошибки и методы исправления
 Планирование и циклограмма аналитической деятельности в ОУ
 Оригами
 VII Всероссийский конкурс учебно-исследовательских экологических проектов «Человек на Земле» Номинация №3 «Этнографические исс
 Гербы и эмблемы. 5 класс
 Рекламные возможности
 Электрический привод. Регулирование координат
 Культура общения современного молодого человека
 Муниципальное общеобразовательное учреждение «Средняя общеобразовательная школа №1» Номинация: компьютерный проект Тема
  Элективный курс “English for Сareer” в системе профильного обучения