- Getting value out of the Nissan dataset

Содержание
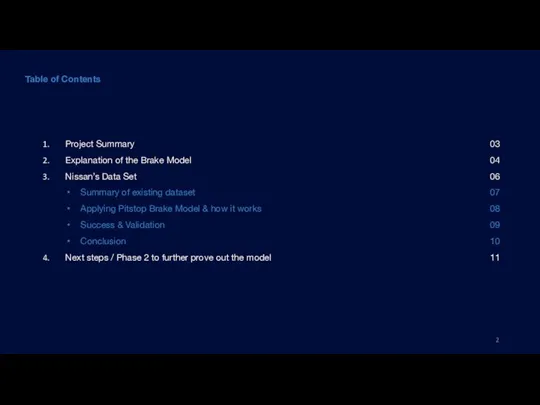
- 2. Table of Contents Project Summary Explanation of the Brake Model Nissan’s Data Set Summary of existing
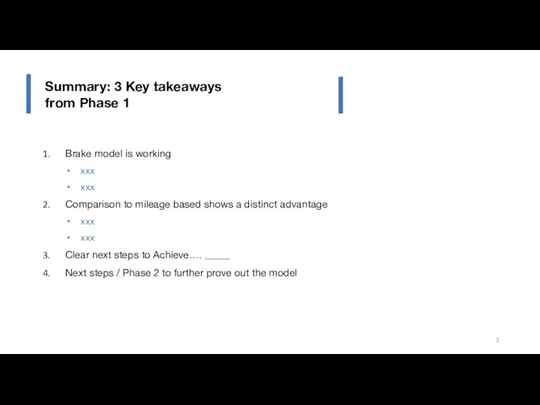
- 3. Summary: 3 Key takeaways from Phase 1 Brake model is working xxx xxx Comparison to mileage
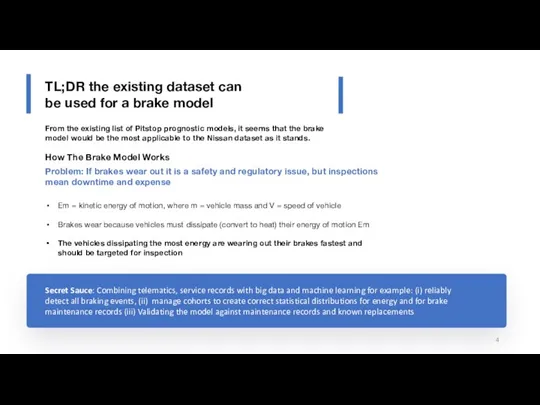
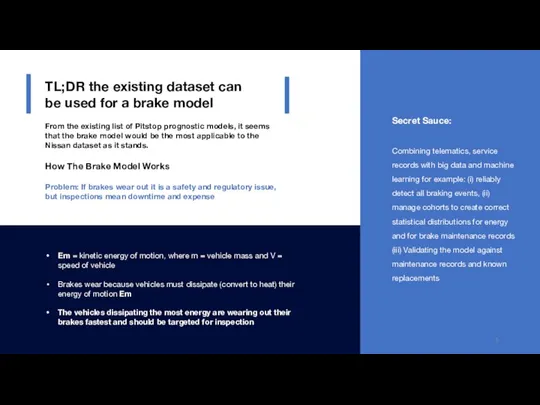
- 4. Secret Sauce: Combining telematics, service records with big data and machine learning for example: (i) reliably
- 5. TL;DR the existing dataset can be used for a brake model From the existing list of
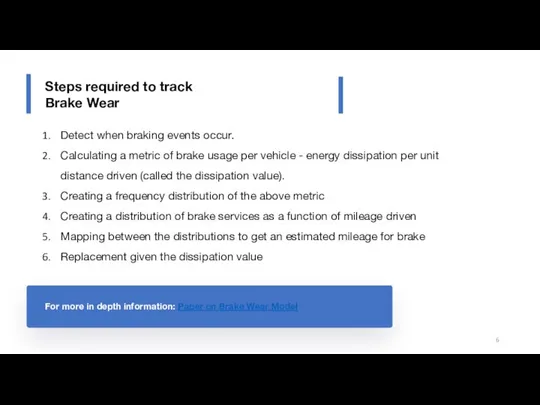
- 6. Steps required to track Brake Wear Detect when braking events occur. Calculating a metric of brake
- 7. Detect when braking events occur. Calculating a metric of brake usage per vehicle - energy dissipation
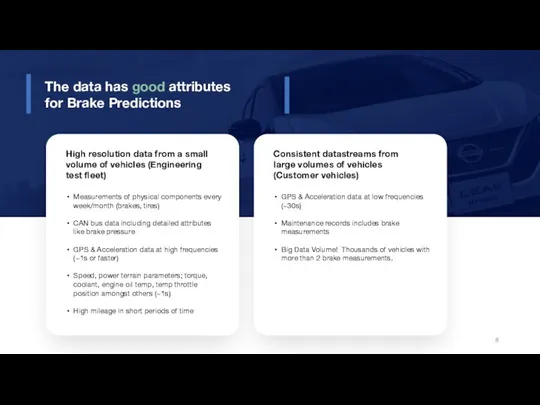
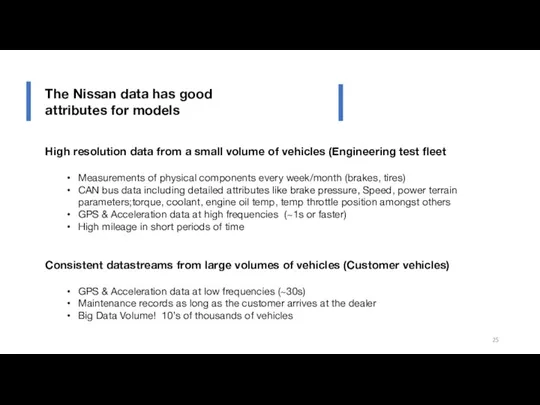
- 8. High resolution data from a small volume of vehicles (Engineering test fleet) Measurements of physical components
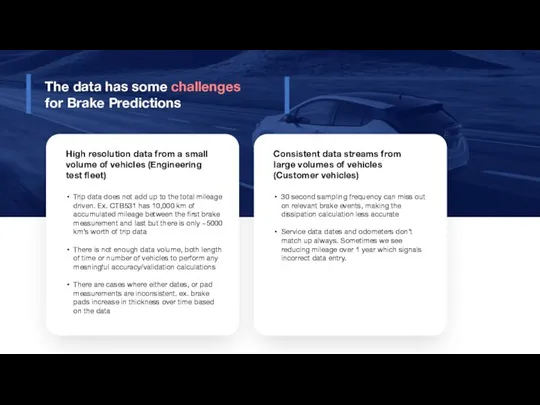
- 9. High resolution data from a small volume of vehicles (Engineering test fleet) Trip data does not
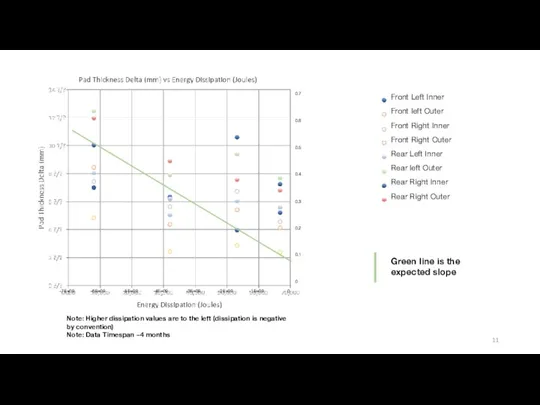
- 10. Expectation is satisfied with engineering test fleet which is that more energy dissipation in brakes =>
- 11. Front Left Inner Front left Outer Front Right Inner Front Right Outer Rear Left Inner Rear
- 12. The brake model is showing Success & validation Showcase accuracies and strong signs of success with
- 13. Next steps to further prove out the brake model High resolution data helps create accurate dissipation
- 14. Step 1: calculate the dissipation for each vehicle and assign it to a cohort Steps to
- 15. Validate the model Step 3: Comparison between each cohort (blue dotted line) and the average (orange
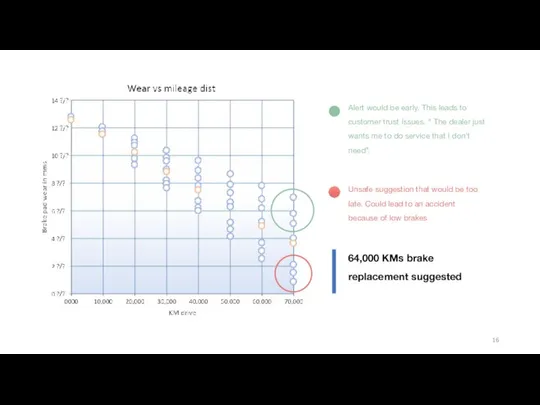
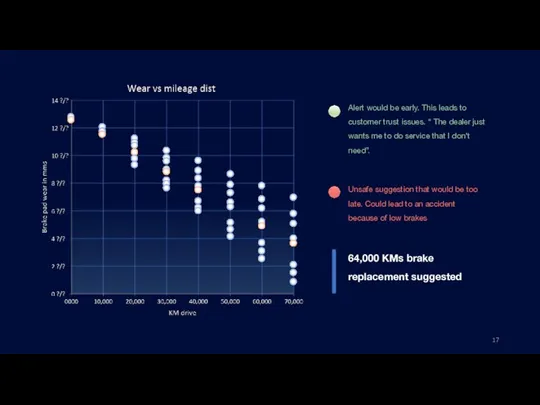
- 16. Alert would be early. This leads to customer trust issues. “ The dealer just wants me
- 17. Alert would be early. This leads to customer trust issues. “ The dealer just wants me
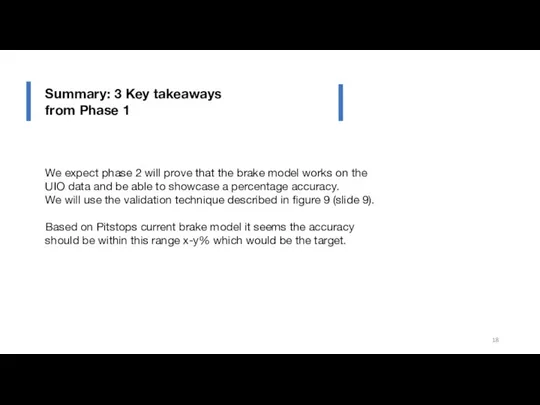
- 18. We expect phase 2 will prove that the brake model works on the UIO data and
- 19. We expect phase 2 will prove that the brake model works on the UIO data and
- 20. Nissan Roadmap to Additional Predictions
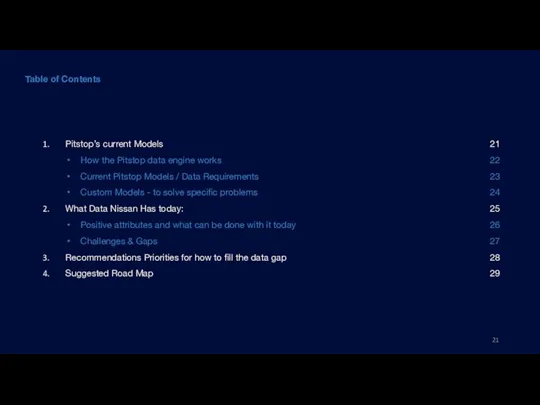
- 21. Table of Contents Pitstop’s current Models How the Pitstop data engine works Current Pitstop Models /
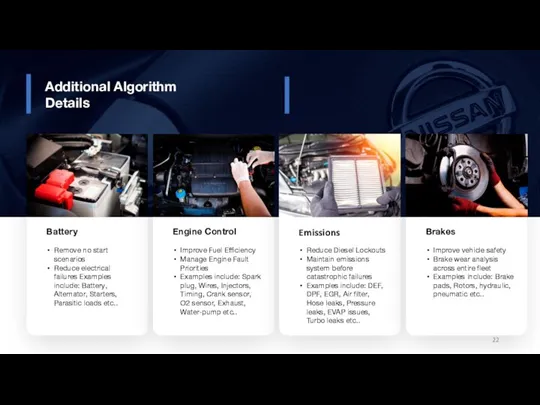
- 22. Battery Remove no start scenarios Reduce electrical failures Examples include: Battery, Alternator, Starters, Parasitic loads etc..
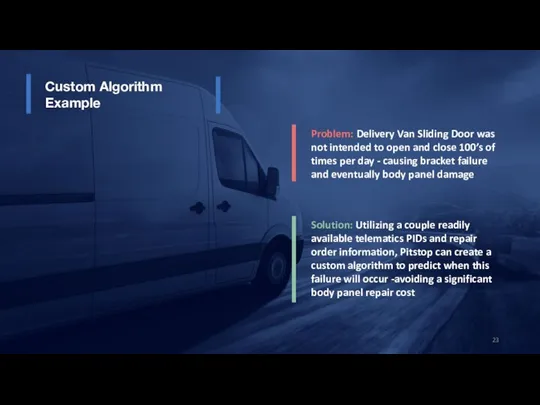
- 23. Custom Algorithm Example Problem: Delivery Van Sliding Door was not intended to open and close 100’s
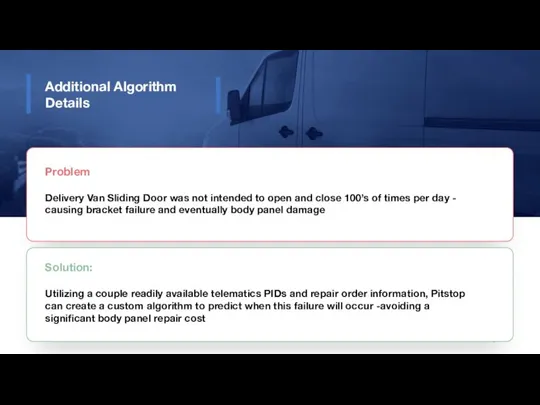
- 24. Additional Algorithm Details Problem Delivery Van Sliding Door was not intended to open and close 100’s
- 25. High resolution data from a small volume of vehicles (Engineering test fleet Measurements of physical components
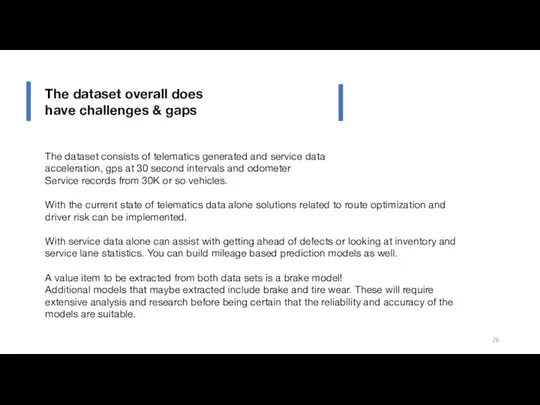
- 26. The dataset consists of telematics generated and service data acceleration, gps at 30 second intervals and
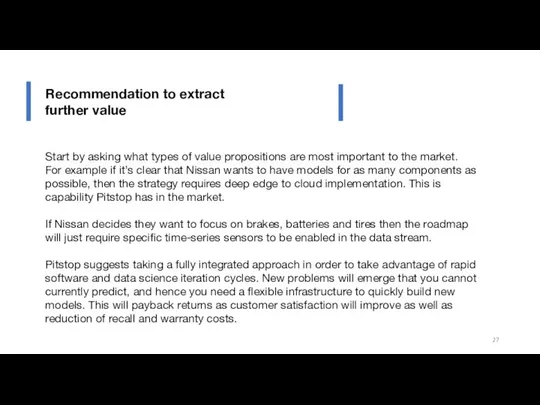
- 27. Start by asking what types of value propositions are most important to the market. For example
- 28. Start by asking what types of value propositions are most important to the market. For example
- 29. Start by asking what types of value propositions are most important to the market. For example
- 30. Recommendation to extract further value 67%
- 31. Start by asking what types of value propositions are most important to the market. For example
- 32. Start by asking what types of value propositions are most important to the market. For example
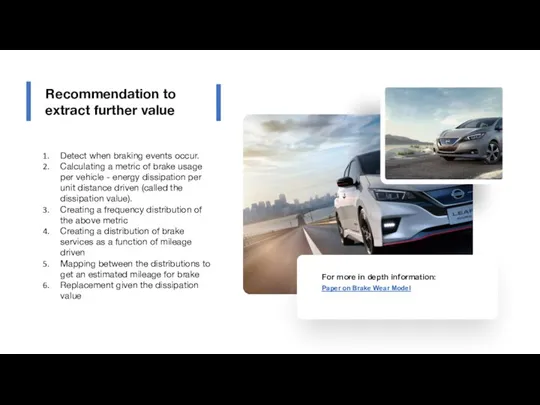
- 33. Recommendation to extract further value
- 34. Recommendation to extract further value
- 36. Скачать презентацию
Слайд 3Summary: 3 Key takeaways from Phase 1
Brake model is working
xxx
xxx
Comparison to mileage
Summary: 3 Key takeaways from Phase 1
Brake model is working
xxx
xxx
Comparison to mileage
Слайд 4Secret Sauce: Combining telematics, service records with big data and machine learning
Secret Sauce: Combining telematics, service records with big data and machine learning
Слайд 5TL;DR the existing dataset can be used for a brake model
From the
TL;DR the existing dataset can be used for a brake model
From the
Слайд 6Steps required to track Brake Wear
Detect when braking events occur.
Calculating a metric
Steps required to track Brake Wear
Detect when braking events occur.
Calculating a metric
Слайд 7Detect when braking events occur.
Calculating a metric of brake usage per vehicle
Detect when braking events occur.
Calculating a metric of brake usage per vehicle
Слайд 8High resolution data from a small volume of vehicles (Engineering test fleet)
Measurements
High resolution data from a small volume of vehicles (Engineering test fleet)
Measurements
Слайд 9High resolution data from a small volume of vehicles (Engineering test fleet)
Trip
High resolution data from a small volume of vehicles (Engineering test fleet)
Trip
Слайд 10Expectation is satisfied with engineering test fleet which is that more energy
Expectation is satisfied with engineering test fleet which is that more energy
Слайд 11Front Left Inner
Front left Outer
Front Right Inner
Front Right Outer
Rear Left Inner
Rear left
Front Left Inner
Front left Outer
Front Right Inner
Front Right Outer
Rear Left Inner
Rear left
Слайд 12The brake model is showing Success & validation
Showcase accuracies and strong signs
The brake model is showing Success & validation
Showcase accuracies and strong signs
Слайд 13Next steps to further prove out the brake model
High resolution data helps
Next steps to further prove out the brake model
High resolution data helps
Слайд 14Step 1: calculate the dissipation for each vehicle and assign it to
Step 1: calculate the dissipation for each vehicle and assign it to
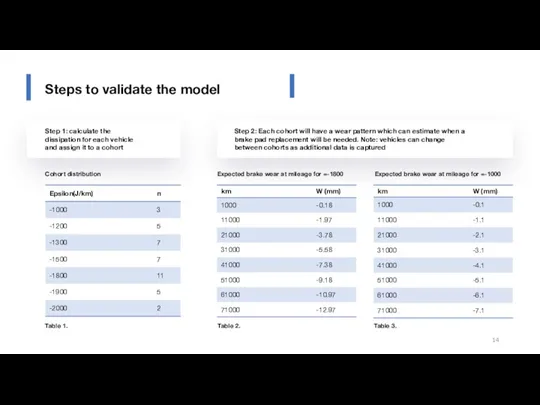
Слайд 15Validate the model
Step 3: Comparison between each cohort (blue dotted line) and
Validate the model
Step 3: Comparison between each cohort (blue dotted line) and

Слайд 16Alert would be early. This leads to customer trust issues. “ The
Alert would be early. This leads to customer trust issues. “ The
Слайд 17Alert would be early. This leads to customer trust issues. “ The
Alert would be early. This leads to customer trust issues. “ The
Слайд 18We expect phase 2 will prove that the brake model works on
We expect phase 2 will prove that the brake model works on
Слайд 19We expect phase 2 will prove that the brake model works on
We expect phase 2 will prove that the brake model works on

Слайд 20Nissan Roadmap to Additional Predictions
Nissan Roadmap to Additional Predictions
Слайд 21Table of Contents
Pitstop’s current Models
How the Pitstop data engine works
Current Pitstop Models
Table of Contents
Pitstop’s current Models
How the Pitstop data engine works
Current Pitstop Models
Слайд 22Battery
Remove no start scenarios
Reduce electrical failures Examples include: Battery, Alternator, Starters, Parasitic
Battery
Remove no start scenarios
Reduce electrical failures Examples include: Battery, Alternator, Starters, Parasitic
Слайд 23Custom Algorithm Example
Problem: Delivery Van Sliding Door was not intended to open
Custom Algorithm Example
Problem: Delivery Van Sliding Door was not intended to open
Слайд 24Additional Algorithm Details
Problem
Delivery Van Sliding Door was not intended to open and
Additional Algorithm Details
Problem
Delivery Van Sliding Door was not intended to open and
Слайд 25High resolution data from a small volume of vehicles (Engineering test fleet
Measurements
High resolution data from a small volume of vehicles (Engineering test fleet
Measurements
Слайд 26The dataset consists of telematics generated and service data
acceleration, gps at 30
The dataset consists of telematics generated and service data
acceleration, gps at 30
Слайд 27Start by asking what types of value propositions are most important to
Start by asking what types of value propositions are most important to
Слайд 28Start by asking what types of value propositions are most important to
Start by asking what types of value propositions are most important to
Слайд 29Start by asking what types of value propositions are most important to
Start by asking what types of value propositions are most important to
Слайд 30Recommendation to extract further value
67%
Recommendation to extract further value
67%
Слайд 31Start by asking what types of value propositions are most important to
Start by asking what types of value propositions are most important to
Слайд 32Start by asking what types of value propositions are most important to
Start by asking what types of value propositions are most important to
Слайд 33Recommendation to extract further value
Recommendation to extract further value
Слайд 34Recommendation to extract further value
Recommendation to extract further value
 ASP Page Data Binding
 Оформление бланков ЕГЭ
 Презентация на тему А.П.Чехов «Злоумышленник»
  Презентация на тему Культура Древней Греции
  Синхронные машины. (Лекция 1)
 Итоговая аттестация выпускников старшей школы. ГОУСОШ №820
 Хрущев Никита Сергеевич
 Промысел зайца в зимний период
 1
1 20 тема
 Disadvantages of photos to record crime scenes
 Комунальна установа “Методично-консалтинговий центр Маріупольської міської ради Донецької області”. Подяки вчителям
 Обучение и методическая поддержка учителей по использованию ЭОР в образовательной деятельности, в том числе с применением дистан
 Простейшее экспериментирование как целостное исследование
 Матрёшка – душа России
 Социальный проект«Изменим мир к лучшему!»
 Элементы логики
 Система профориентации и основные её направления
 Кредитная политика. Банк Русский стандарт
 Создание условий для воспитания человека, гражданина, патриота средствами дополнительного образования. Шаблон
 Оценочные кулинарные системы мира
 Стандартизация. Виды стандартов
 Валеологическое образование
 Сокращение дробей
 Железобетонные мосты
  The Finnish Mythology
 Методы, приемы, средства организации и управления педагогическим процессом
 Основы боевых действий частей авиации