- !!!HSE GCII 2022 methodology 25.05.2022

Содержание
- 2. AGENDA Challenges of measuring innovation at the city level Theoretical framework for measuring innovations used by
- 3. CHALLENGES OF MEASURING INNOVATION AT THE CITY LEVEL Lack of reliable data sources for international comparisons
- 4. OUR APPROACH IS BASED ON THE CONCEPT OF THE SUPERSTAR ECONOMY Relatively small numbers of people
- 5. CITY INNOVATIONS SHOULD BE MEASURED USING AN ECOSYSTEM APPROACH Innovation ecosystem of a global city involves
- 6. HSE GCII 2020
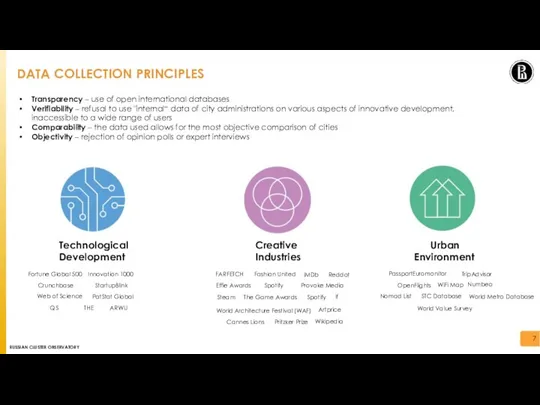
- 7. Transparency – use of open international databases Verifiability – refusal to use "internal“ data of city
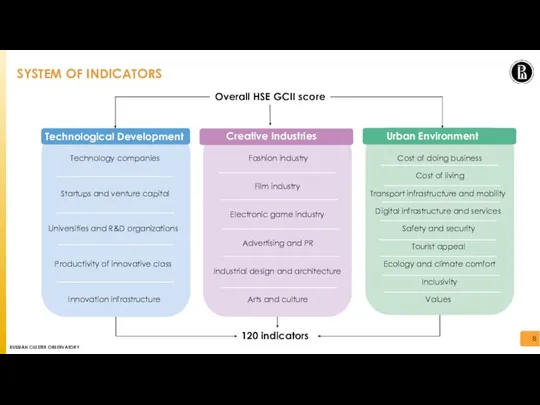
- 8. SYSTEM OF INDICATORS Overall HSE GCII score Creative Industries Urban Environment Technological Development Technology companies Startups
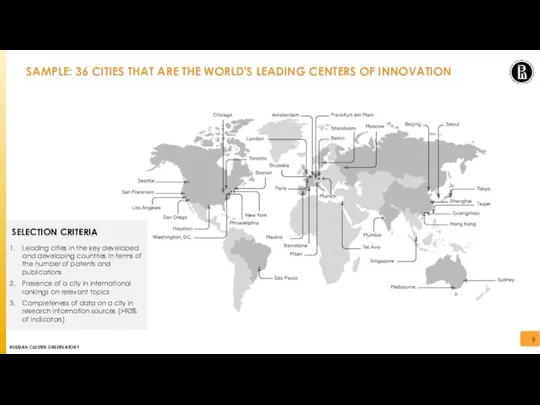
- 9. SAMPLE: 36 CITIES THAT ARE THE WORLD'S LEADING CENTERS OF INNOVATION SELECTION CRITERIA Leading cities in
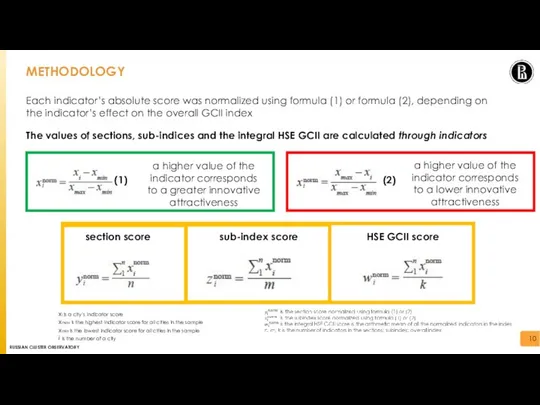
- 10. METHODOLOGY Each indicator’s absolute score was normalized using formula (1) or formula (2), depending on the
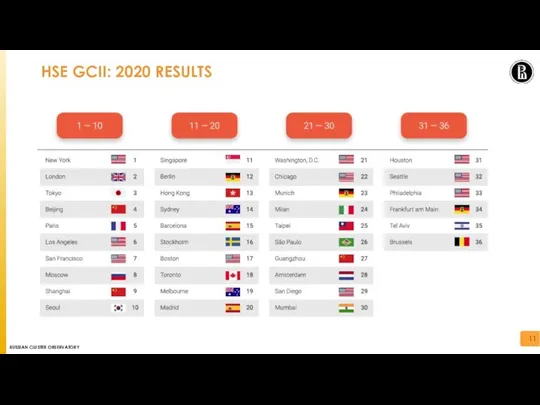
- 11. HSE GCII: 2020 RESULTS
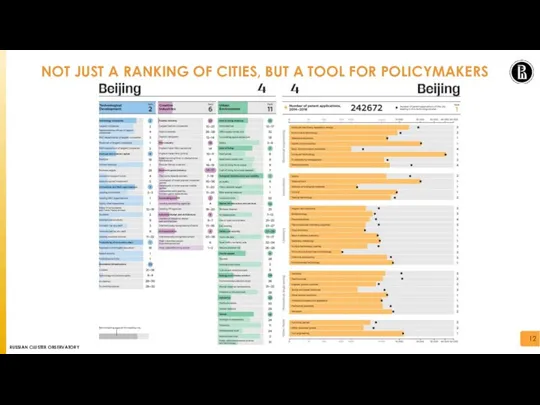
- 12. NOT JUST A RANKING OF CITIES, BUT A TOOL FOR POLICYMAKERS
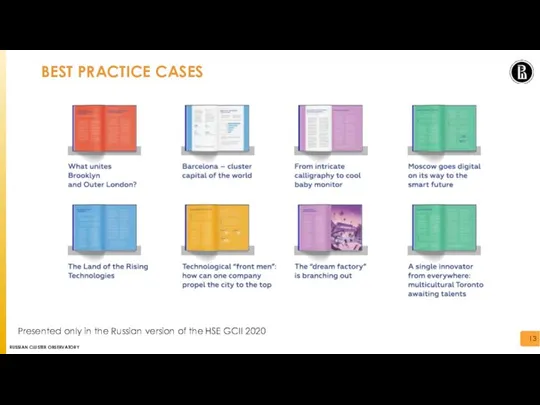
- 13. BEST PRACTICE CASES Presented only in the Russian version of the HSE GCII 2020
- 14. HSE GCII 2022
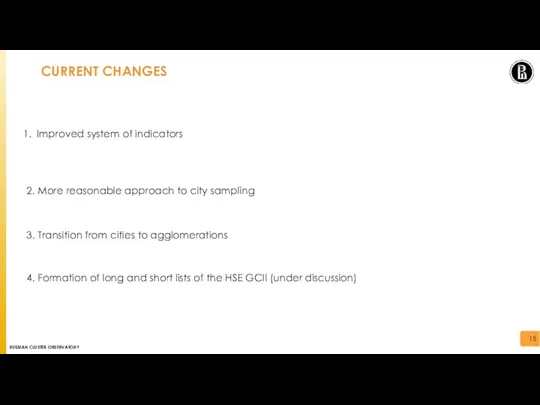
- 15. CURRENT CHANGES Improved system of indicators 2. More reasonable approach to city sampling 3. Transition from
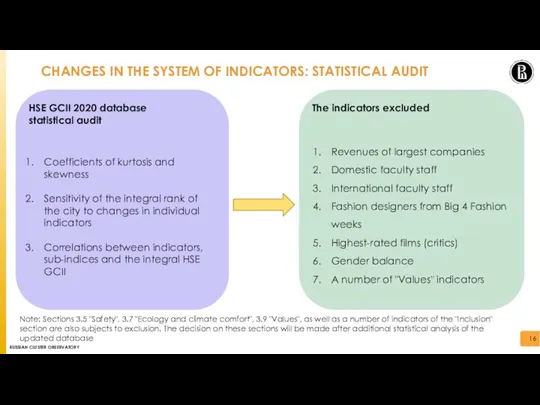
- 16. CHANGES IN THE SYSTEM OF INDICATORS: STATISTICAL AUDIT Coefficients of kurtosis and skewness Sensitivity of the
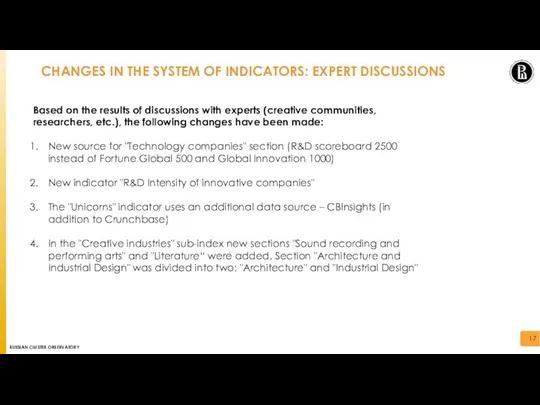
- 17. CHANGES IN THE SYSTEM OF INDICATORS: EXPERT DISCUSSIONS Based on the results of discussions with experts
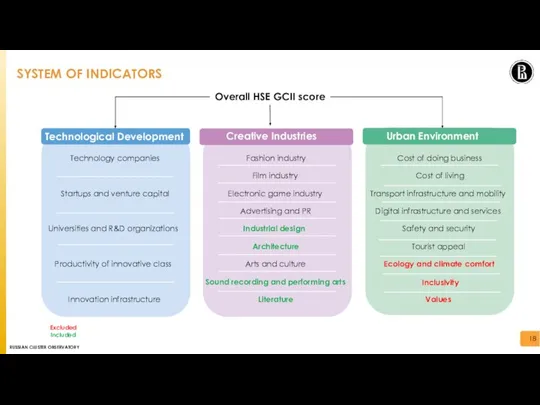
- 18. SYSTEM OF INDICATORS Overall HSE GCII score Creative Industries Urban Environment Technological Development Technology companies Startups
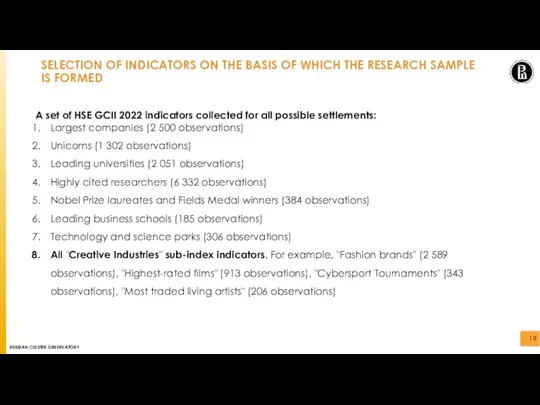
- 19. SELECTION OF INDICATORS ON THE BASIS OF WHICH THE RESEARCH SAMPLE IS FORMED A set of
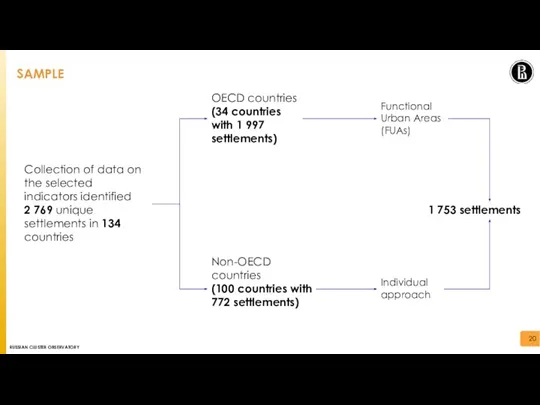
- 20. SAMPLE Collection of data on the selected indicators identified 2 769 unique settlements in 134 countries
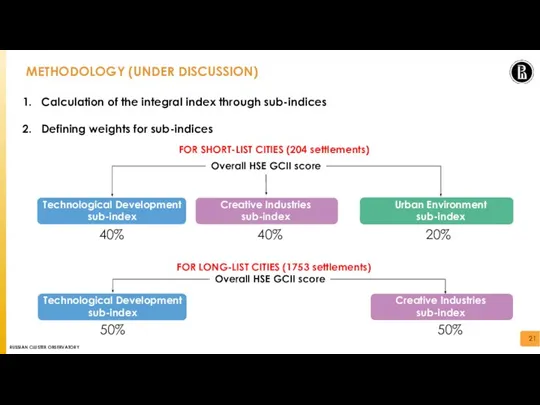
- 21. METHODOLOGY (UNDER DISCUSSION) Calculation of the integral index through sub-indices Defining weights for sub-indices Overall HSE
- 22. PUBLICATION ACTIVITY ANALYSIS: BASIC PRINCIPLES Database for analysis: Scopus Time period: 2010-2021 Document types included: articles,
- 23. SEARCH FOR PUBLICATIONS OF A SPECIFIC CITY: HOW DOES IT WORK Take Beijing as example: Scopus
- 24. PUBLICATION ACTIVITY ANALYSIS: METHODOLOGICAL ASPECT OF SEARCH OF CITIES When we have two cities with the
- 25. PATENT ANALYSIS: SEARCHING STRATEGIES Database: PatStat Global Time period: 2010-2021 We counted patent applications which, unlike
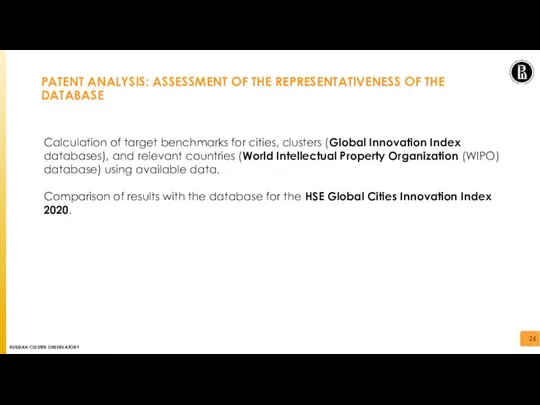
- 26. PATENT ANALYSIS: ASSESSMENT OF THE REPRESENTATIVENESS OF THE DATABASE Calculation of target benchmarks for cities, clusters
- 27. Q&A
- 29. Скачать презентацию
Слайд 2AGENDA
Challenges of measuring innovation at the city level
Theoretical framework for measuring innovations
AGENDA
Challenges of measuring innovation at the city level
Theoretical framework for measuring innovations
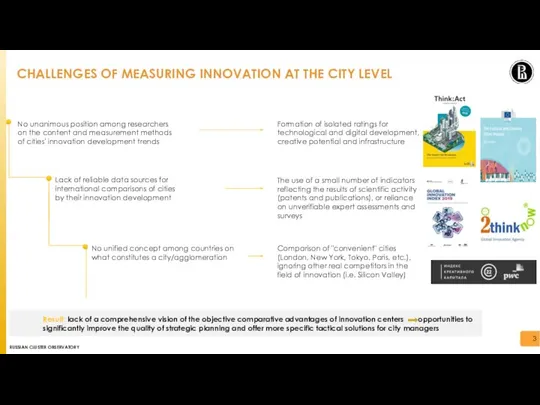
Слайд 3CHALLENGES OF MEASURING INNOVATION AT THE CITY LEVEL
Lack of reliable data sources
CHALLENGES OF MEASURING INNOVATION AT THE CITY LEVEL
Lack of reliable data sources
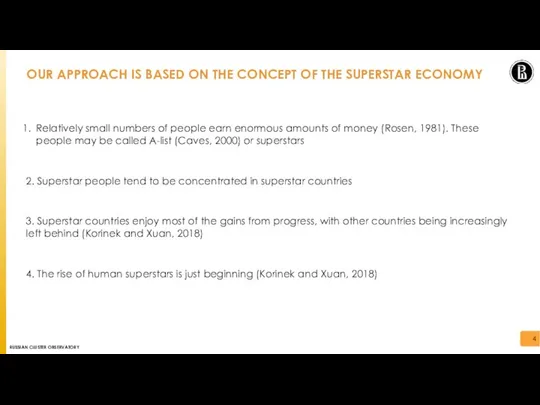
Слайд 4OUR APPROACH IS BASED ON THE CONCEPT OF THE SUPERSTAR ECONOMY
Relatively small
OUR APPROACH IS BASED ON THE CONCEPT OF THE SUPERSTAR ECONOMY
Relatively small
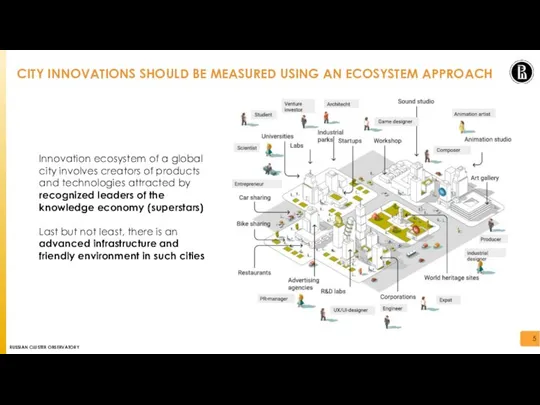
Слайд 5CITY INNOVATIONS SHOULD BE MEASURED USING AN ECOSYSTEM APPROACH
Innovation ecosystem of a
CITY INNOVATIONS SHOULD BE MEASURED USING AN ECOSYSTEM APPROACH
Innovation ecosystem of a
Слайд 6HSE GCII 2020
HSE GCII 2020
Слайд 7Transparency – use of open international databases
Verifiability – refusal to use "internal“
Transparency – use of open international databases
Verifiability – refusal to use "internal“
Слайд 8SYSTEM OF INDICATORS
Overall HSE GCII score
Creative Industries
Urban Environment
Technological Development
Technology companies
Startups and venture
SYSTEM OF INDICATORS
Overall HSE GCII score
Creative Industries
Urban Environment
Technological Development
Technology companies
Startups and venture
Слайд 9SAMPLE: 36 CITIES THAT ARE THE WORLD'S LEADING CENTERS OF INNOVATION
SELECTION CRITERIA
Leading
SAMPLE: 36 CITIES THAT ARE THE WORLD'S LEADING CENTERS OF INNOVATION
SELECTION CRITERIA
Leading
Слайд 10METHODOLOGY
Each indicator’s absolute score was normalized using formula (1) or formula (2),
METHODOLOGY
Each indicator’s absolute score was normalized using formula (1) or formula (2),
Слайд 11HSE GCII: 2020 RESULTS
HSE GCII: 2020 RESULTS
Слайд 12NOT JUST A RANKING OF CITIES, BUT A TOOL FOR POLICYMAKERS
NOT JUST A RANKING OF CITIES, BUT A TOOL FOR POLICYMAKERS
Слайд 13BEST PRACTICE CASES
Presented only in the Russian version of the HSE GCII
BEST PRACTICE CASES
Presented only in the Russian version of the HSE GCII
Слайд 14HSE GCII 2022
HSE GCII 2022
Слайд 15CURRENT CHANGES
Improved system of indicators
2. More reasonable approach to city sampling
3. Transition
CURRENT CHANGES
Improved system of indicators
2. More reasonable approach to city sampling
3. Transition
Слайд 16CHANGES IN THE SYSTEM OF INDICATORS: STATISTICAL AUDIT
Coefficients of kurtosis and skewness
Sensitivity
CHANGES IN THE SYSTEM OF INDICATORS: STATISTICAL AUDIT
Coefficients of kurtosis and skewness
Sensitivity
Слайд 17CHANGES IN THE SYSTEM OF INDICATORS: EXPERT DISCUSSIONS
Based on the results of
CHANGES IN THE SYSTEM OF INDICATORS: EXPERT DISCUSSIONS
Based on the results of
Слайд 18SYSTEM OF INDICATORS
Overall HSE GCII score
Creative Industries
Urban Environment
Technological Development
Technology companies
Startups and venture
SYSTEM OF INDICATORS
Overall HSE GCII score
Creative Industries
Urban Environment
Technological Development
Technology companies
Startups and venture
Слайд 19SELECTION OF INDICATORS ON THE BASIS OF WHICH THE RESEARCH SAMPLE
IS
SELECTION OF INDICATORS ON THE BASIS OF WHICH THE RESEARCH SAMPLE IS
Слайд 20SAMPLE
Collection of data on the selected indicators identified
2 769 unique settlements
SAMPLE
Collection of data on the selected indicators identified 2 769 unique settlements
Слайд 21METHODOLOGY (UNDER DISCUSSION)
Calculation of the integral index through sub-indices
Defining weights for sub-indices
Overall
METHODOLOGY (UNDER DISCUSSION)
Calculation of the integral index through sub-indices
Defining weights for sub-indices
Overall
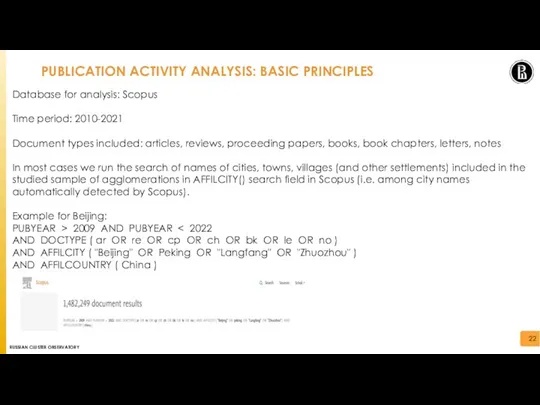
Слайд 22PUBLICATION ACTIVITY ANALYSIS: BASIC PRINCIPLES
Database for analysis: Scopus
Time period: 2010-2021
Document types included:
PUBLICATION ACTIVITY ANALYSIS: BASIC PRINCIPLES
Database for analysis: Scopus
Time period: 2010-2021
Document types included:
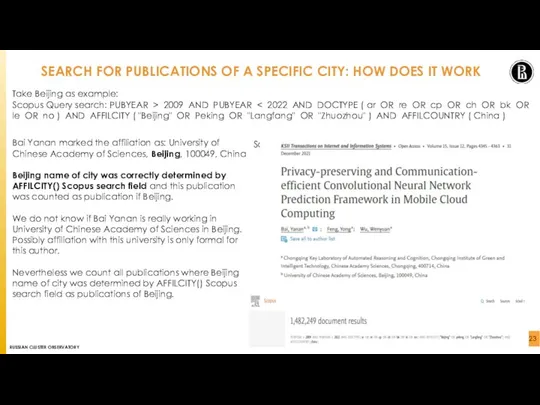
Слайд 23SEARCH FOR PUBLICATIONS OF A SPECIFIC CITY: HOW DOES IT WORK
Take Beijing
SEARCH FOR PUBLICATIONS OF A SPECIFIC CITY: HOW DOES IT WORK
Take Beijing
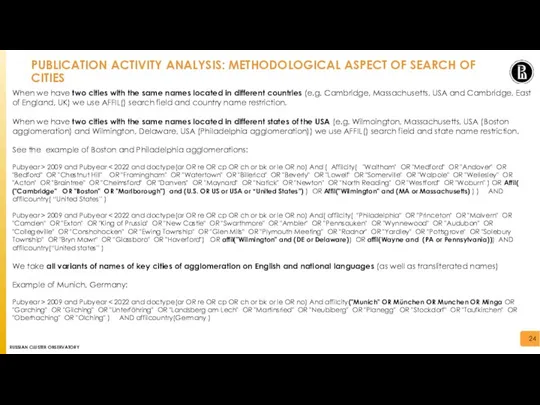
Слайд 24PUBLICATION ACTIVITY ANALYSIS: METHODOLOGICAL ASPECT OF SEARCH OF CITIES
When we have two
PUBLICATION ACTIVITY ANALYSIS: METHODOLOGICAL ASPECT OF SEARCH OF CITIES
When we have two
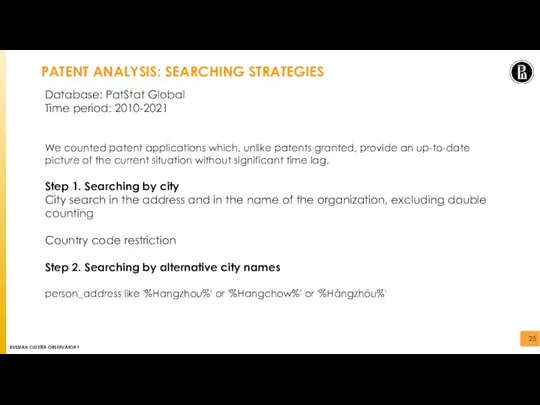
Слайд 25PATENT ANALYSIS: SEARCHING STRATEGIES
Database: PatStat Global
Time period: 2010-2021
We counted patent applications which,
PATENT ANALYSIS: SEARCHING STRATEGIES
Database: PatStat Global
Time period: 2010-2021
We counted patent applications which,
Слайд 26PATENT ANALYSIS: ASSESSMENT OF THE REPRESENTATIVENESS OF THE DATABASE
Calculation of target benchmarks
PATENT ANALYSIS: ASSESSMENT OF THE REPRESENTATIVENESS OF THE DATABASE
Calculation of target benchmarks
Слайд 27Q&A
Q&A

 Определение безэквивалентной лексики
 Позициониране на Схемата за екомаркировка в държавната политика за устойчив туризъм ДЪРЖАВНА АГЕНЦИЯ ПО ТУРИЗЪМ Десислава Михалкова – Станимирова Гл. експерт в дирекция “Туристическа политика” 20 октомври, 2008 г, гр. София
 Презентация на тему Просто сказочные вопросы
  Я Гражданин России
 Же-Ким
 Корпоративный мессенджер для брейнштормов
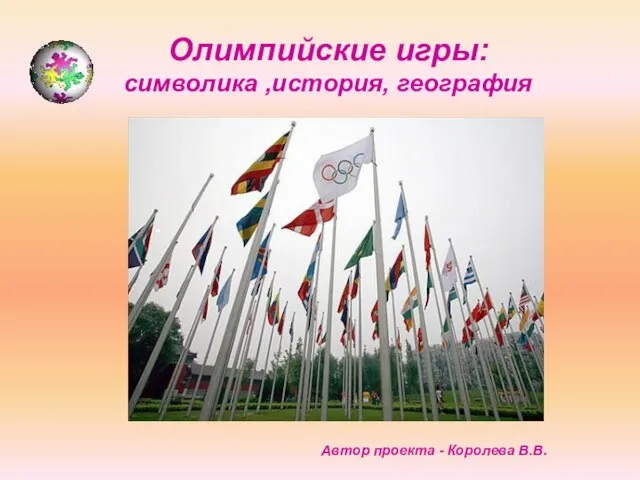 Олимпийские игры: символика ,история, география
 Чичиков – беда или надежда России? Образ Чичикова в поэме Николая Васильевича Гоголя «Мёртвые души»
 Событийные мероприятия
 Трение в нашей жизни
 О повышении эффективности и безопасного использования отраслевого парка исследовательских ядерных установок
 Всероссийский инженерный конкурс. Лесопосадочные машины
 Презентация на тему Значение птиц в природе и жизни человека
 Презентация на тему Экстремумы функции
 Джинсы
 Презентация к методической разработке для спецкурса: «Обратные тригонометрические функции» (10-11 кл.).
 Хороших знаний и отличного настроения!
 Поддержка стандарта OpenGIS в СУБД ЛИНТЕР
 Презентация на тему Транспорт
 Три вида бизнеса, востребованные в г. Кострома
 Обработка юбки после первой примерки
 Конкурс среди социально ориентированных некоммерческих организаций на право получения субсидий из бюджета города Екатеринбурга
 Fun Activities (Развлечения)
 Мониторинг направлений актуального профессионального развития научно-педагогических, руководящих кадров, сотрудников ПетрГУ
 КУБА – УКРАЙНА 1990 – 2011
 Презентация на тему Дифракция света
 Родители трудолюбивы и дети не ленивы
 Ліпікар. Очищувальний гель