- Managerial economics

Содержание
- 2. Modeling in Managerial Economics Types of models in Managerial Economics Graphical models in Managerial Economics Mathematical
- 3. Types of models in Managerial Economics Modeling in management helps to: take into account main factors
- 4. Types of models in Managerial Economics Model is a simplified imagination of a modeling object, which
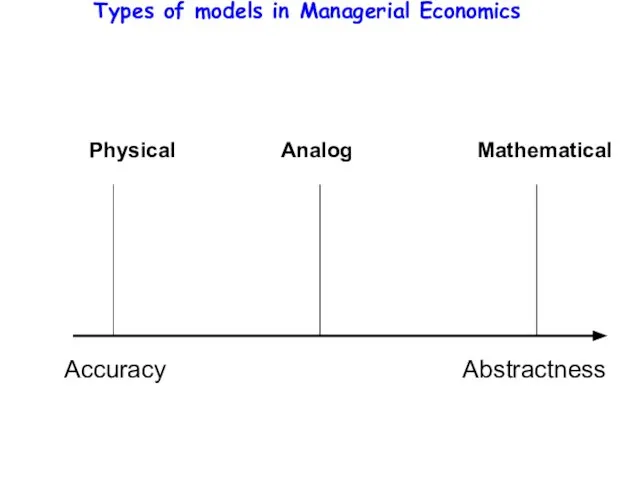
- 5. Types of models in Managerial Economics Accuracy Abstractness Physical Analog Mathematical
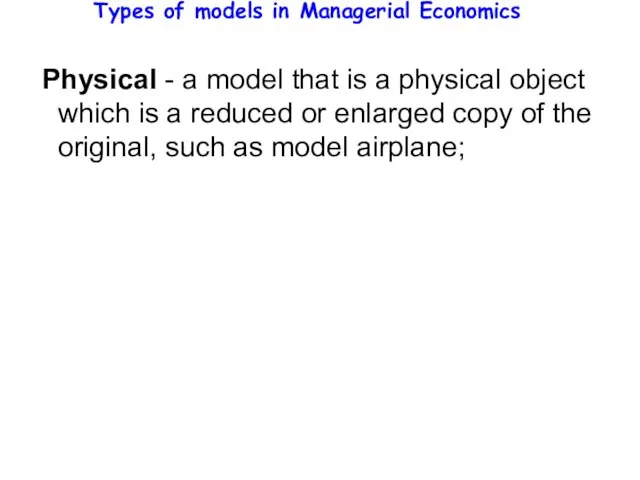
- 6. Types of models in Managerial Economics Physical - a model that is a physical object which
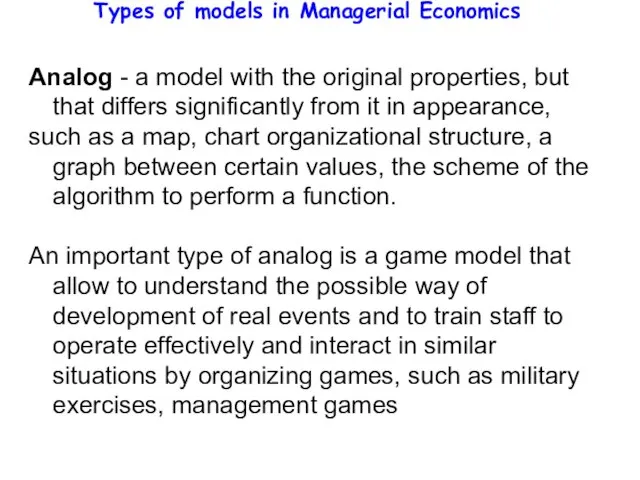
- 7. Types of models in Managerial Economics Analog - a model with the original properties, but that
- 8. Types of models in Managerial Economics Mathematical - a model that uses mathematical symbols and methods
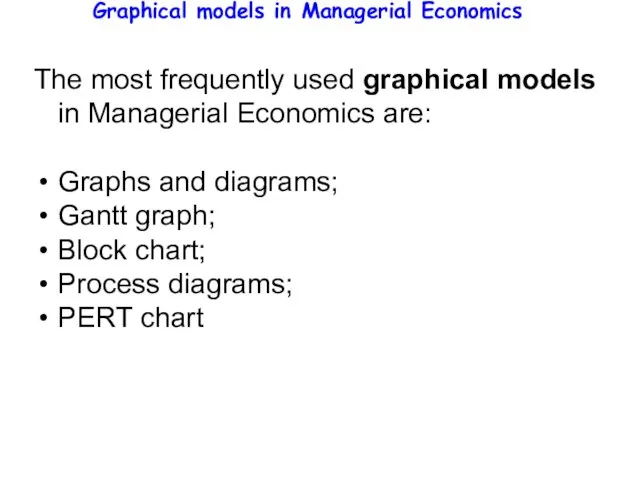
- 9. Graphical models in Managerial Economics The most frequently used graphical models in Managerial Economics are: Graphs
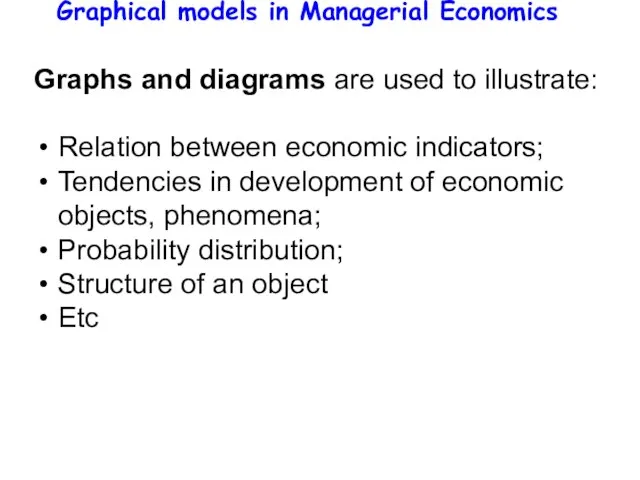
- 10. Graphical models in Managerial Economics Graphs and diagrams are used to illustrate: Relation between economic indicators;
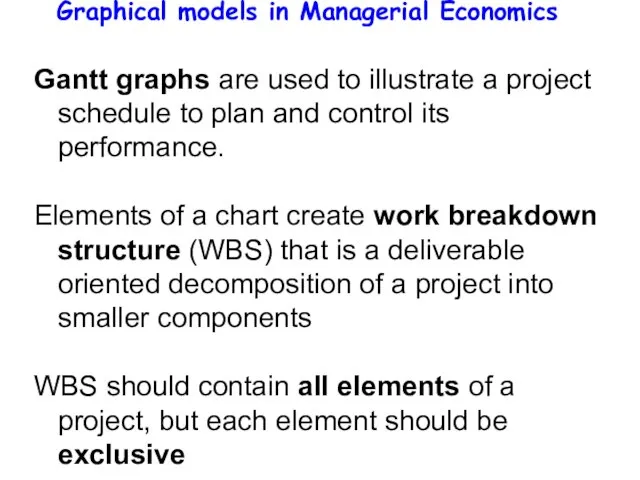
- 11. Graphical models in Managerial Economics Gantt graphs are used to illustrate a project schedule to plan
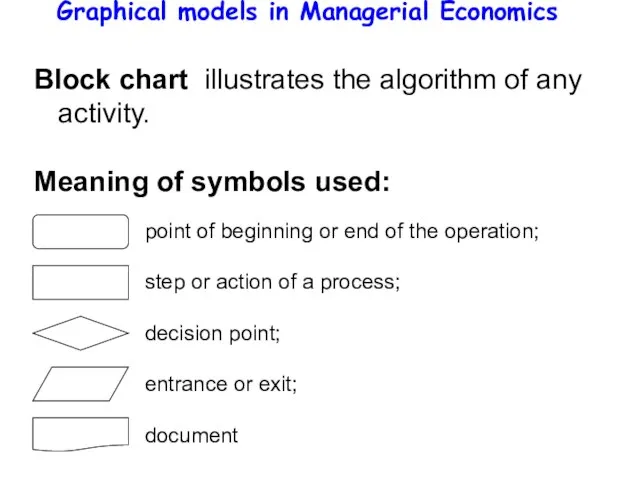
- 12. Graphical models in Managerial Economics Block chart illustrates the algorithm of any activity. Meaning of symbols
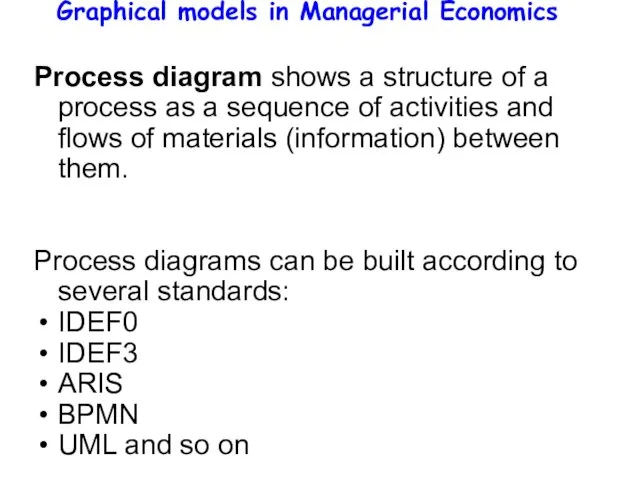
- 13. Graphical models in Managerial Economics Process diagram shows a structure of a process as a sequence
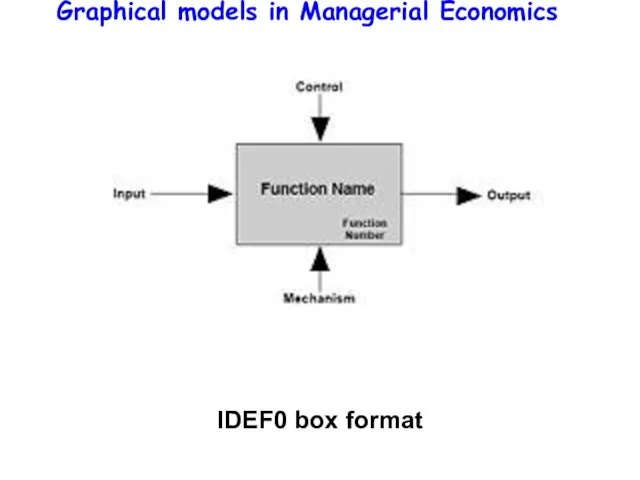
- 14. Graphical models in Managerial Economics IDEF0 box format
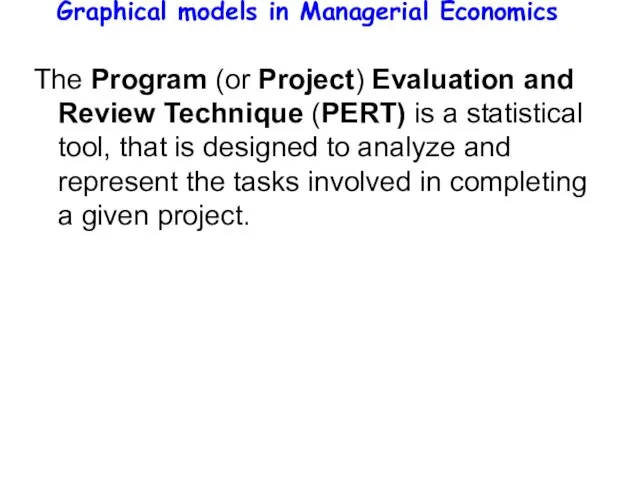
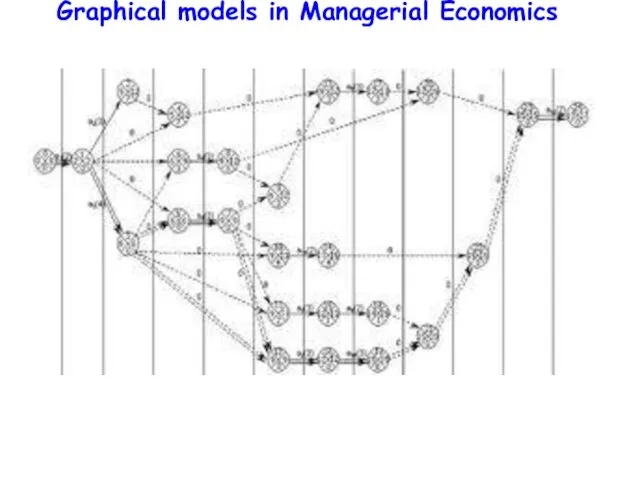
- 15. Graphical models in Managerial Economics The Program (or Project) Evaluation and Review Technique (PERT) is a
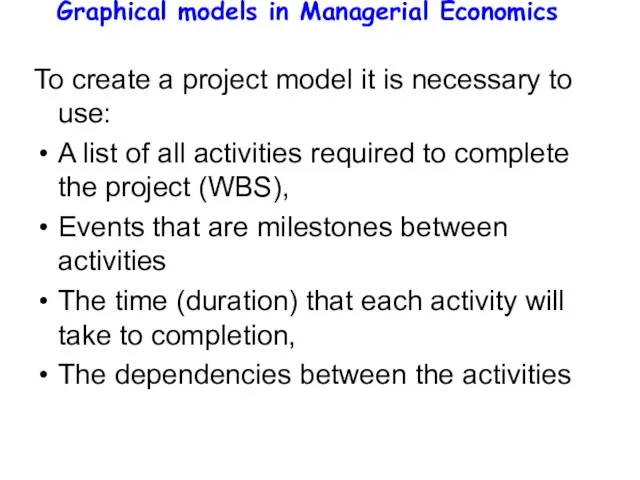
- 16. Graphical models in Managerial Economics To create a project model it is necessary to use: A
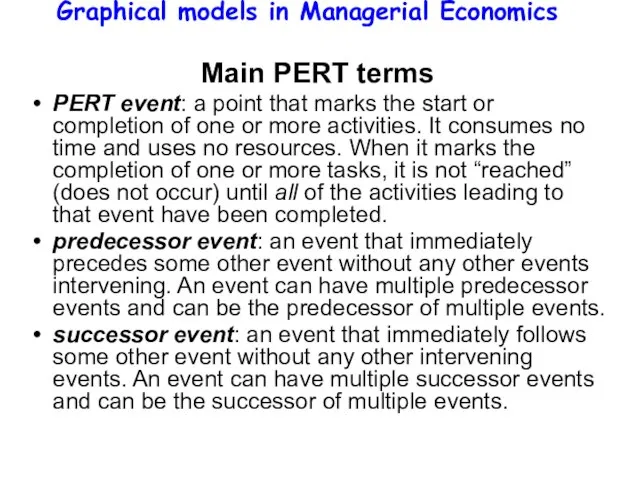
- 17. Graphical models in Managerial Economics Main PERT terms PERT event: a point that marks the start
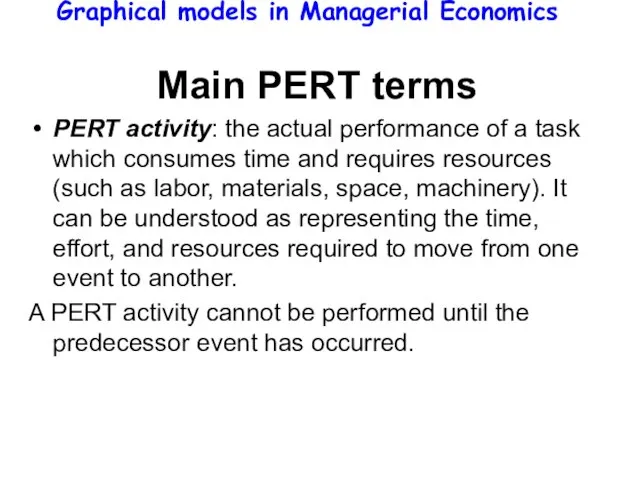
- 18. Graphical models in Managerial Economics Main PERT terms PERT activity: the actual performance of a task
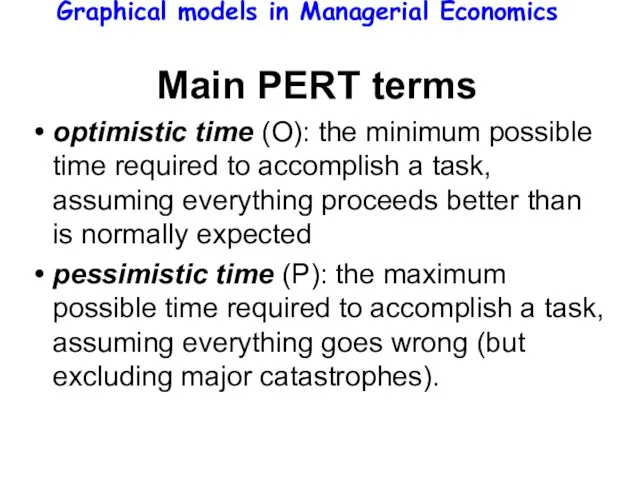
- 19. Graphical models in Managerial Economics Main PERT terms optimistic time (O): the minimum possible time required
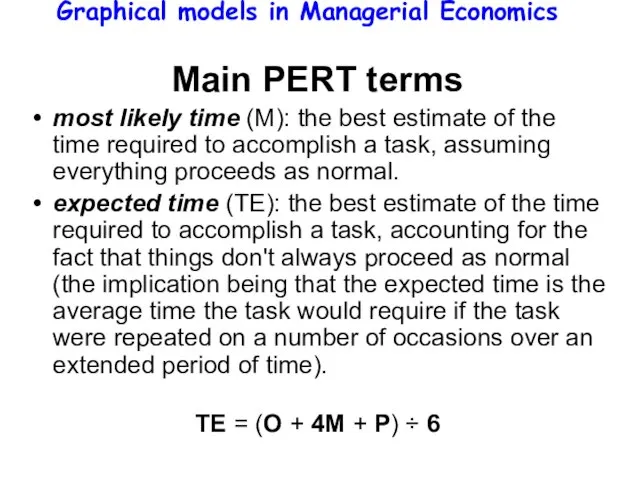
- 20. Graphical models in Managerial Economics Main PERT terms most likely time (M): the best estimate of
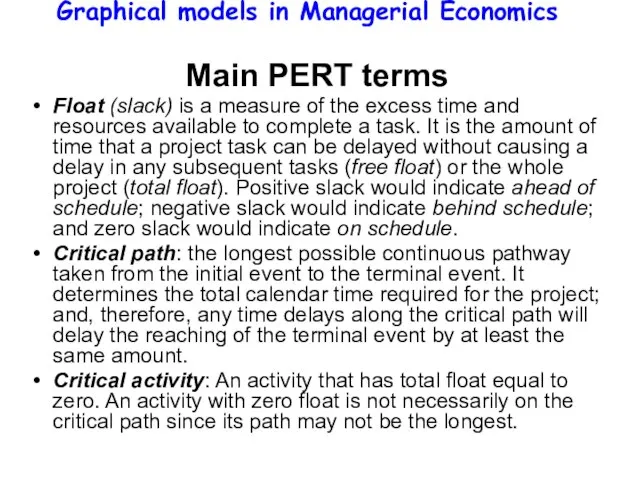
- 21. Graphical models in Managerial Economics Main PERT terms Float (slack) is a measure of the excess
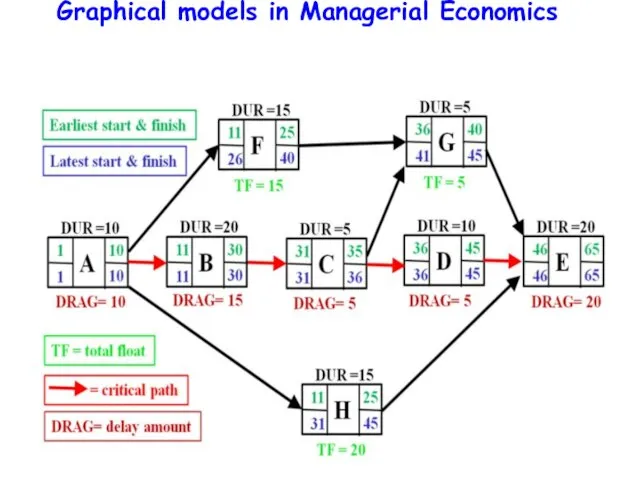
- 22. Graphical models in Managerial Economics
- 23. Graphical models in Managerial Economics
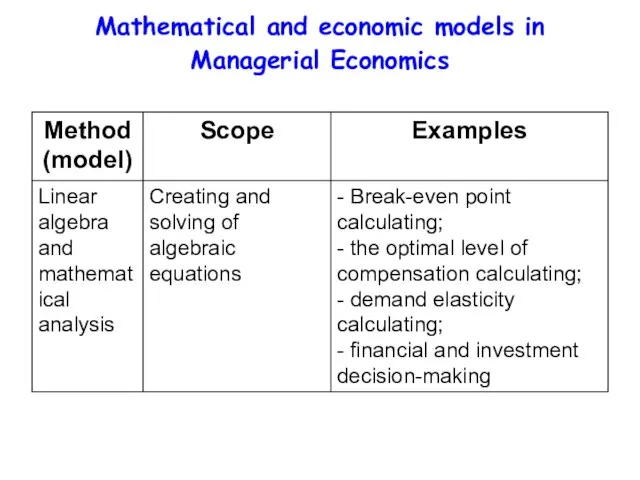
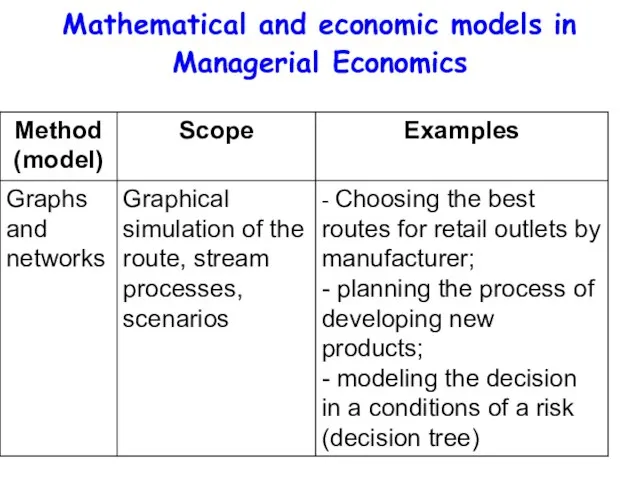
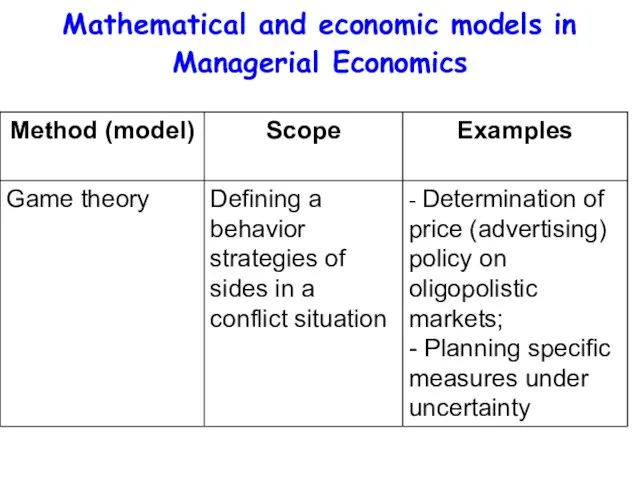
- 24. Mathematical and economic models in Managerial Economics
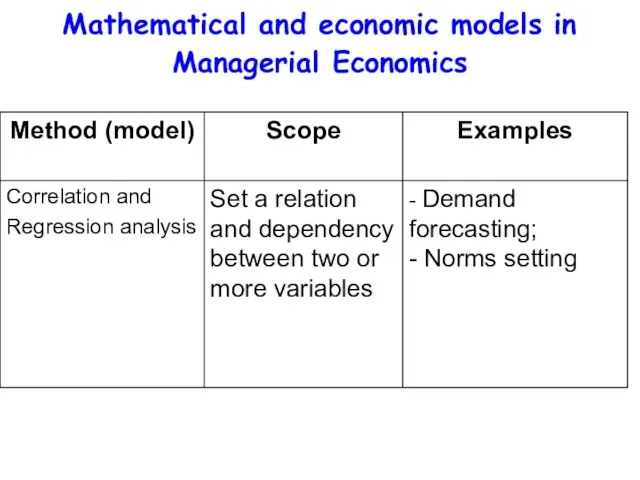
- 25. Mathematical and economic models in Managerial Economics
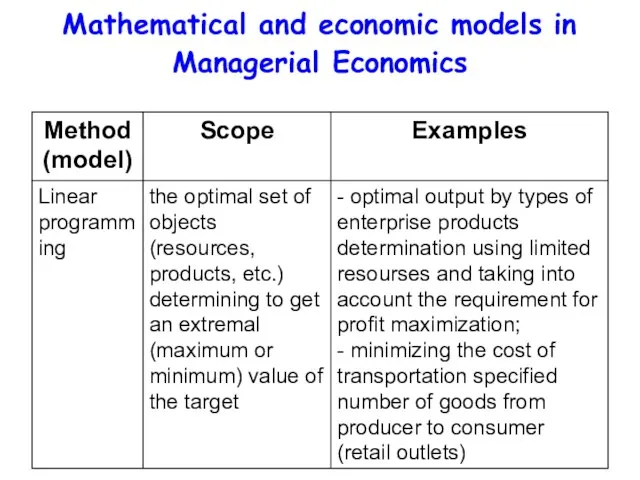
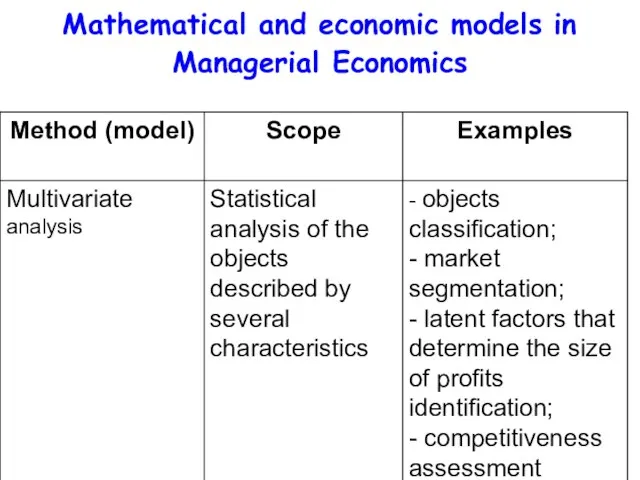
- 26. Mathematical and economic models in Managerial Economics
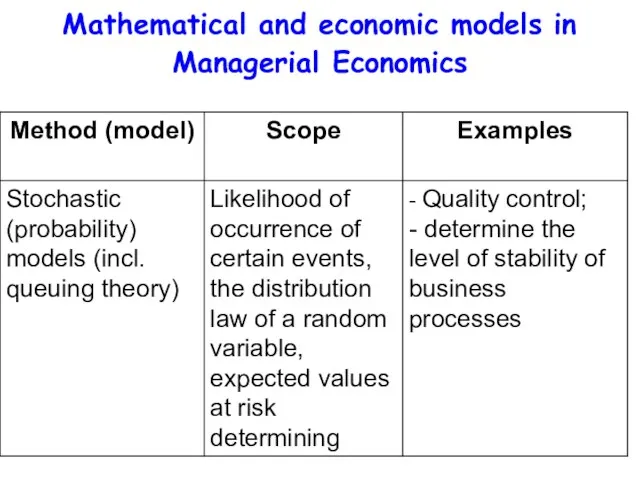
- 27. Mathematical and economic models in Managerial Economics
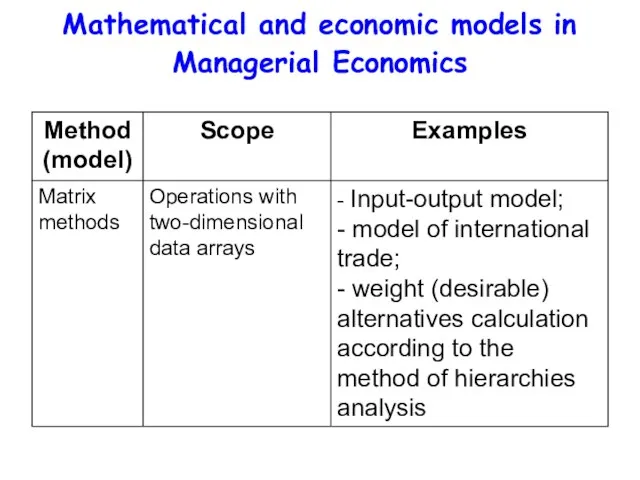
- 28. Mathematical and economic models in Managerial Economics
- 29. Mathematical and economic models in Managerial Economics
- 30. Mathematical and economic models in Managerial Economics
- 31. Mathematical and economic models in Managerial Economics
- 33. Скачать презентацию
Слайд 2Modeling in Managerial Economics
Types of models in Managerial Economics
Graphical models in Managerial
Modeling in Managerial Economics
Types of models in Managerial Economics
Graphical models in Managerial
Слайд 3Types of models in Managerial Economics
Modeling in management helps to:
take into
Types of models in Managerial Economics
Modeling in management helps to:
take into
Слайд 4Types of models in Managerial Economics
Model is a simplified imagination of
Types of models in Managerial Economics
Model is a simplified imagination of
Слайд 5Types of models in Managerial Economics
Accuracy
Abstractness
Physical
Analog
Mathematical
Types of models in Managerial Economics
Accuracy
Abstractness
Physical
Analog
Mathematical
Слайд 6Types of models in Managerial Economics
Physical - a model that
Types of models in Managerial Economics
Physical - a model that
Слайд 7Types of models in Managerial Economics
Analog - a model with the
Types of models in Managerial Economics
Analog - a model with the
Слайд 8Types of models in Managerial Economics
Mathematical - a model that uses
Types of models in Managerial Economics
Mathematical - a model that uses

Слайд 9Graphical models in Managerial Economics
The most frequently used graphical models in
Graphical models in Managerial Economics
The most frequently used graphical models in
Слайд 10Graphical models in Managerial Economics
Graphs and diagrams are used to illustrate:
Relation
Graphical models in Managerial Economics
Graphs and diagrams are used to illustrate:
Relation
Слайд 11Graphical models in Managerial Economics
Gantt graphs are used to illustrate a
Graphical models in Managerial Economics
Gantt graphs are used to illustrate a
Слайд 12Graphical models in Managerial Economics
Block chart illustrates the algorithm of any
Graphical models in Managerial Economics
Block chart illustrates the algorithm of any
Слайд 13Graphical models in Managerial Economics
Process diagram shows a structure of a
Graphical models in Managerial Economics
Process diagram shows a structure of a
Слайд 14Graphical models in Managerial Economics
IDEF0 box format
Graphical models in Managerial Economics
IDEF0 box format
Слайд 15Graphical models in Managerial Economics
The Program (or Project) Evaluation and Review
Graphical models in Managerial Economics
The Program (or Project) Evaluation and Review
Слайд 16Graphical models in Managerial Economics
To create a project model it is
Graphical models in Managerial Economics
To create a project model it is
Слайд 17Graphical models in Managerial Economics
Main PERT terms
PERT event: a point
Graphical models in Managerial Economics
Main PERT terms
PERT event: a point
Слайд 18Graphical models in Managerial Economics
Main PERT terms
PERT activity: the actual
Graphical models in Managerial Economics
Main PERT terms
PERT activity: the actual
Слайд 19Graphical models in Managerial Economics
Main PERT terms
optimistic time (O): the
Graphical models in Managerial Economics
Main PERT terms
optimistic time (O): the
Слайд 20Graphical models in Managerial Economics
Main PERT terms
most likely time (M):
Graphical models in Managerial Economics
Main PERT terms
most likely time (M):
Слайд 21Graphical models in Managerial Economics
Main PERT terms
Float (slack) is a
Graphical models in Managerial Economics
Main PERT terms
Float (slack) is a
Слайд 22Graphical models in Managerial Economics
Graphical models in Managerial Economics
Слайд 23Graphical models in Managerial Economics
Graphical models in Managerial Economics
Слайд 24Mathematical and economic models in Managerial Economics
Mathematical and economic models in Managerial Economics
Слайд 25Mathematical and economic models in Managerial Economics
Mathematical and economic models in Managerial Economics
Слайд 26Mathematical and economic models in Managerial Economics
Mathematical and economic models in Managerial Economics
Слайд 27Mathematical and economic models in Managerial Economics
Mathematical and economic models in Managerial Economics
Слайд 28Mathematical and economic models in Managerial Economics
Mathematical and economic models in Managerial Economics
Слайд 29Mathematical and economic models in Managerial Economics
Mathematical and economic models in Managerial Economics
Слайд 30Mathematical and economic models in Managerial Economics
Mathematical and economic models in Managerial Economics
Слайд 31Mathematical and economic models in Managerial Economics
Mathematical and economic models in Managerial Economics
 ИКБ Лизинг. Решение для бизнеса
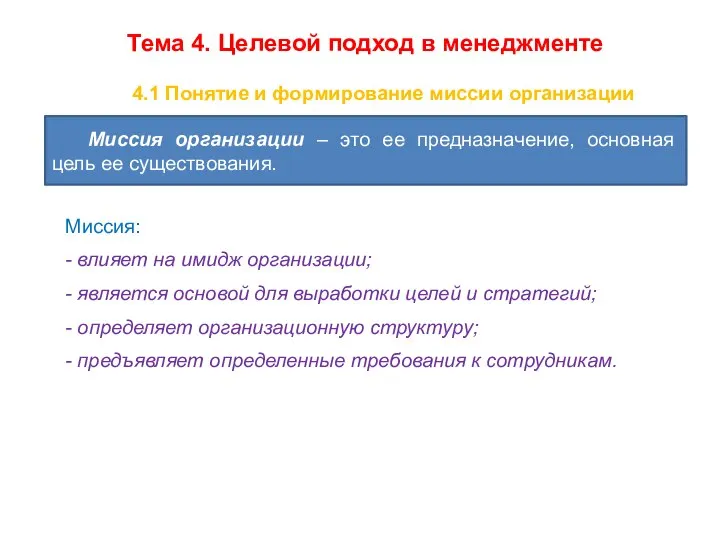 Целевой подход в менеджменте. Понятие и формирование миссии организации. (Тема 4)
 Устойчивое развитие социо-эколого-экономической системы
 Применение новых образовательных технологий в 1 ступени МОУ Крюковской оош.
 Свойства параллельных прямых
 Культура СССР
 Автостереограммы
 Химия - страна чудес
 Презентация на тему Своя игра К Юбилею Ломоносова
  Хочешь свой бизнес?
 Orientation
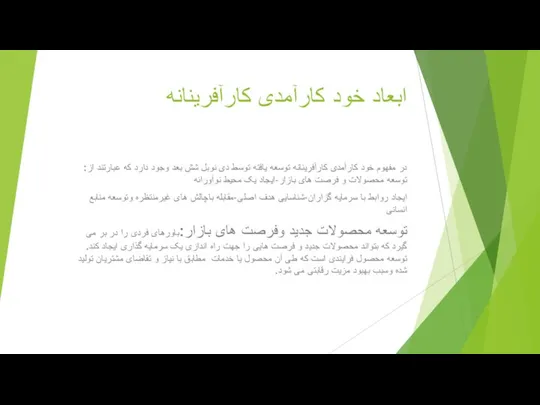 ابعاد خود کارآمدی کارآفرینانه
 Презентация на тему Ракообразные
  CASUAL - Современная городская одежда
 Модель гражданско-патриотического воспитания школьников в условиях сельской малокомплектной школы
 Кредитно-денежная система и кредитно-денежная политика
 Нефтепродукты
 Основные тенденции развития российской экономики: от рецессии к стагнации
 Університети Середньовіччя
 Emergency Medical Services
 НИКТО НЕ ДОЛЖЕН СТЫДИТЬСЯ УЧИТЬСЯ Альбрехт Дюрерхудожник эпохи Возрождения
 Искусство Рококо. Ватто
 Проект. Введение
 птицы
птицы Презентация Семенов (3) (1)
 Вирусы, Трояны и как от них защититься.
 Основные направления взаимодействия промышленных и эксплуатационных предприятий авиационного комплекса России в рамках системы
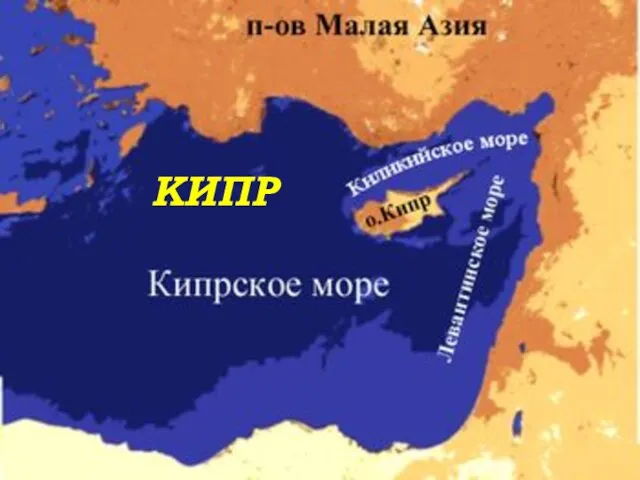 Кипр
Кипр