- MS Project Example

Содержание
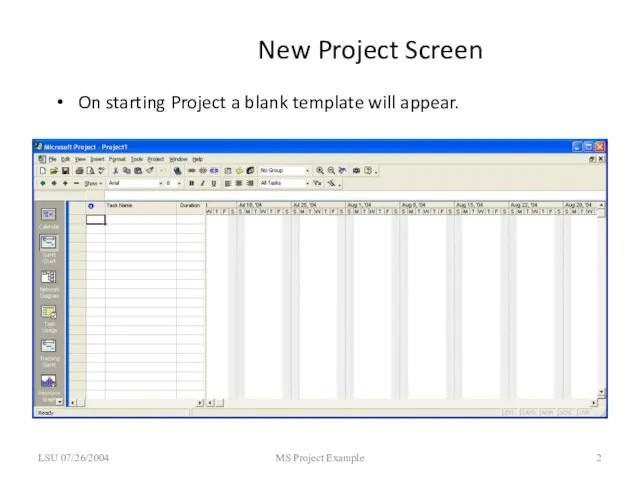
- 2. New Project Screen On starting Project a blank template will appear. LSU 07/26/2004 MS Project Example
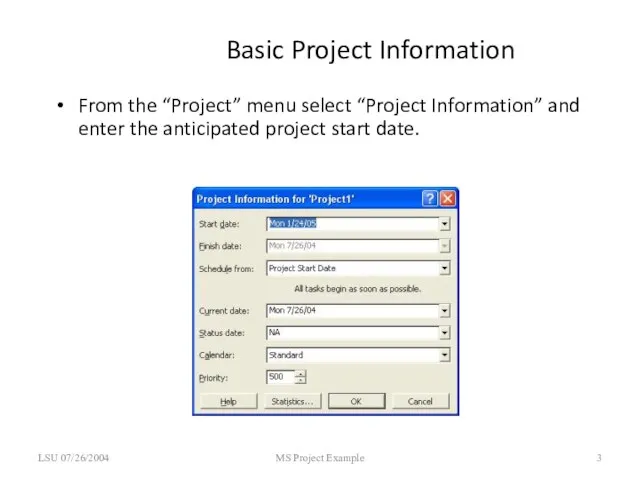
- 3. Basic Project Information From the “Project” menu select “Project Information” and enter the anticipated project start
- 4. Enter the major tasks Type in the major tasks (WBS level 1) in the “Task Name”
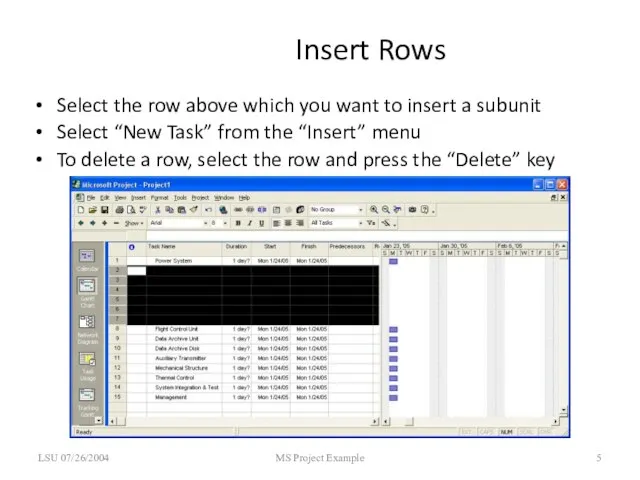
- 5. Insert Rows Select the row above which you want to insert a subunit Select “New Task”
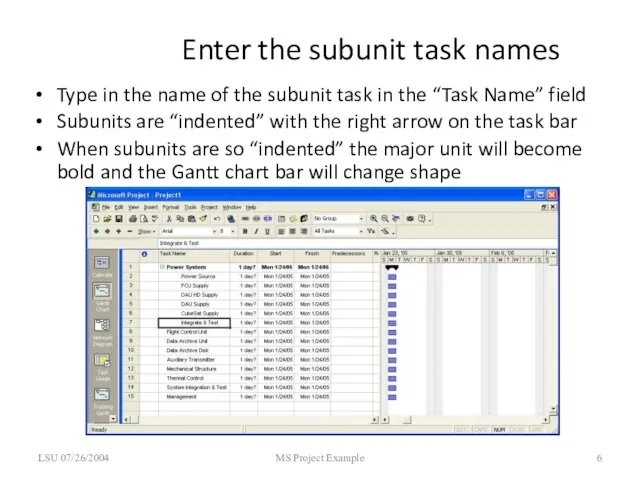
- 6. Enter the subunit task names Type in the name of the subunit task in the “Task
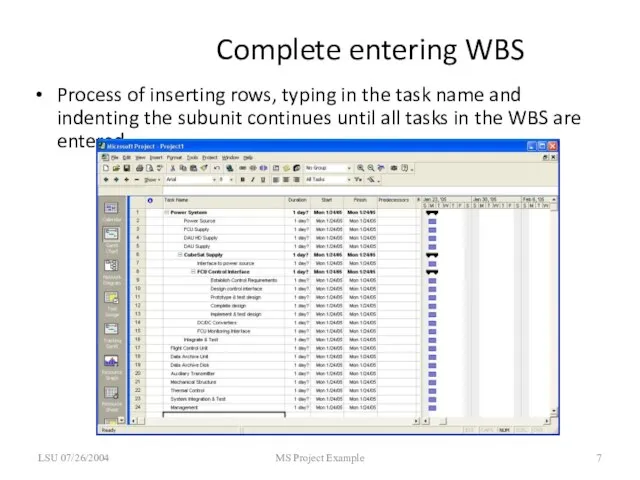
- 7. Complete entering WBS Process of inserting rows, typing in the task name and indenting the subunit
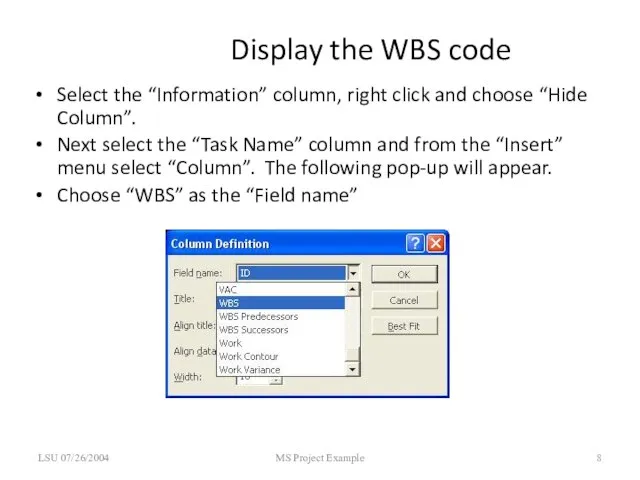
- 8. Display the WBS code Select the “Information” column, right click and choose “Hide Column”. Next select
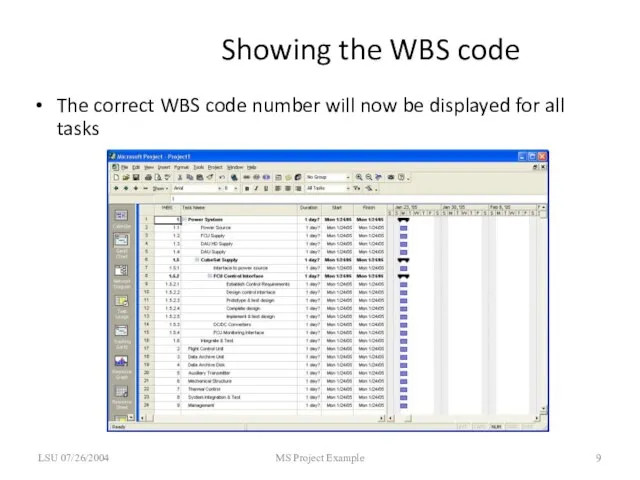
- 9. Showing the WBS code The correct WBS code number will now be displayed for all tasks
- 10. Task bars With all subunits inserted the lowest level will be blue rectangles and higher levels
- 11. Distinguishing different levels You can change the color of the task bar to distinguish between the
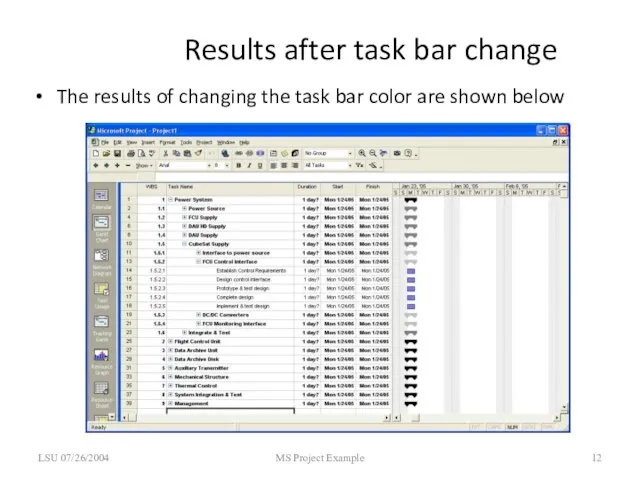
- 12. Results after task bar change The results of changing the task bar color are shown below
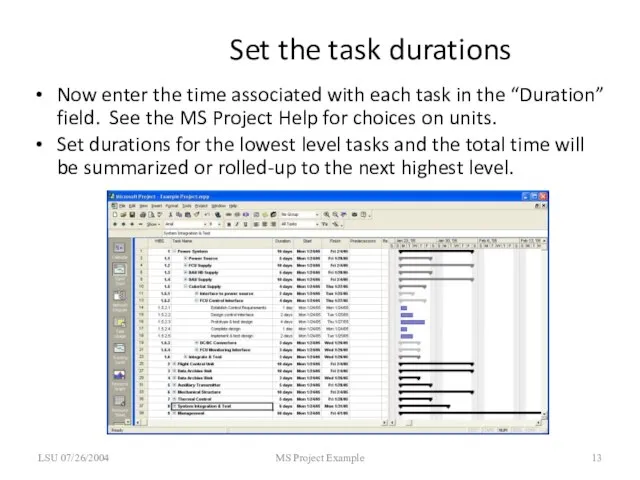
- 13. Set the task durations Now enter the time associated with each task in the “Duration” field.
- 14. Set the task predecessors Enter the task dependence (i.e. which tasks must be complete prior to
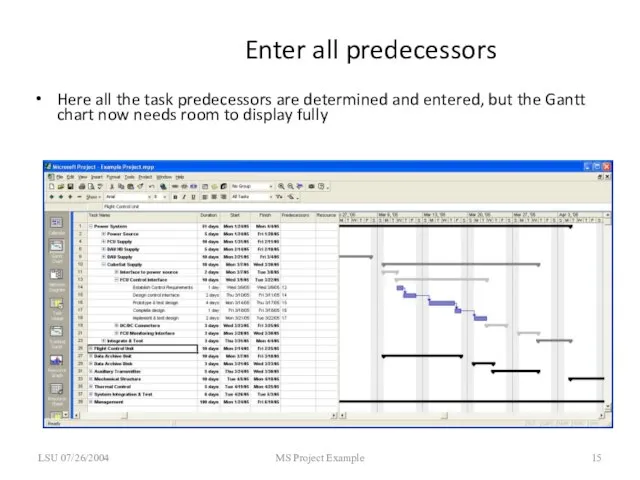
- 15. Enter all predecessors Here all the task predecessors are determined and entered, but the Gantt chart
- 16. Set the timescale of the chart From the “Format” menu select “Timescale” Set the Major Scale
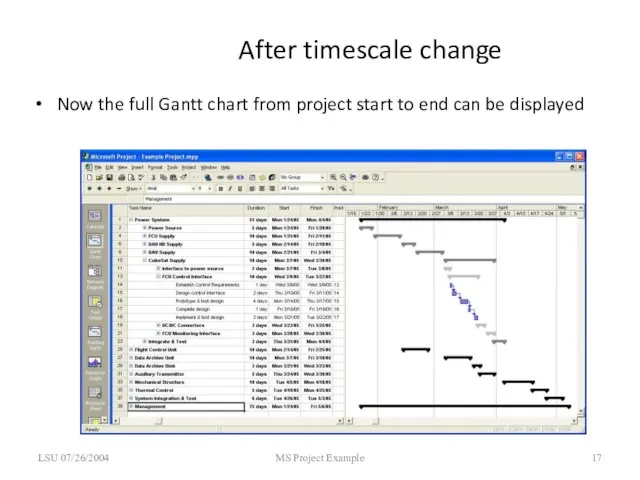
- 17. After timescale change Now the full Gantt chart from project start to end can be displayed
- 18. Make an image for documents To make a GIF image that can be inserted into documents,
- 20. Скачать презентацию
Слайд 3Basic Project Information
From the “Project” menu select “Project Information” and enter the
Basic Project Information
From the “Project” menu select “Project Information” and enter the
Слайд 4Enter the major tasks
Type in the major tasks (WBS level 1) in
Enter the major tasks
Type in the major tasks (WBS level 1) in

Слайд 5Insert Rows
Select the row above which you want to insert a subunit
Select
Insert Rows
Select the row above which you want to insert a subunit
Select
Слайд 6Enter the subunit task names
Type in the name of the subunit task
Enter the subunit task names
Type in the name of the subunit task
Слайд 7Complete entering WBS
Process of inserting rows, typing in the task name and
Complete entering WBS
Process of inserting rows, typing in the task name and
Слайд 8Display the WBS code
Select the “Information” column, right click and choose “Hide
Display the WBS code
Select the “Information” column, right click and choose “Hide
Слайд 9Showing the WBS code
The correct WBS code number will now be displayed
Showing the WBS code
The correct WBS code number will now be displayed
Слайд 10Task bars
With all subunits inserted the lowest level will be blue rectangles
Task bars
With all subunits inserted the lowest level will be blue rectangles

Слайд 11Distinguishing different levels
You can change the color of the task bar to
Distinguishing different levels
You can change the color of the task bar to

Слайд 12Results after task bar change
The results of changing the task bar color
Results after task bar change
The results of changing the task bar color
Слайд 13Set the task durations
Now enter the time associated with each task in
Set the task durations
Now enter the time associated with each task in
Слайд 14Set the task predecessors
Enter the task dependence (i.e. which tasks must be
Set the task predecessors
Enter the task dependence (i.e. which tasks must be

Слайд 15Enter all predecessors
Here all the task predecessors are determined and entered, but
Enter all predecessors
Here all the task predecessors are determined and entered, but
Слайд 16Set the timescale of the chart
From the “Format” menu select “Timescale”
Set the
Set the timescale of the chart
From the “Format” menu select “Timescale”
Set the

Слайд 17After timescale change
Now the full Gantt chart from project start to end
After timescale change
Now the full Gantt chart from project start to end
Слайд 18Make an image for documents
To make a GIF image that can be
Make an image for documents
To make a GIF image that can be

 Применение оптических волоконных световодов для сверхплотной и сверхбыстройпередачи информации
 Презентация на тему Образы животных во фразеологизмах
  Моё хобби
 Кометы и астероиды. Пояс Койпера и облако Оорта
 Багаж
Багаж Что такое наркомания? «Нарке» на древнегреческом означает «ступор», «неподвижность», «беспамятство». Лекарства - наркотики дают т
 Презентация Вид1. Ред3 (3)
 Презентация на тему Скорость прямолинейного равноускоренного движения
 Семья Барановских
 Урок-практикум.Обобщение изученного материала. Подготовка к ЕГЭ.«Это непростое простое повторение?!...» 11 класс.
 Художественный музей имени Радищева
 Советское искусство от 1917 до 1932 года. Живопись, графика, скульптура, архитектура
 Комплексные соединения
 Помогите ребенку быть всегда здоровым!
 Архитектура первой половины XIX века
 ISO/TS 22002-1. Программы предварительных условий для безопасности пищевых продуктов. Производство пищевых продуктов
 Резонанс
 Методы финансовой оценки при M&A сделках на примере DCF (Discounted Cash Flow) анализа
 Управление торговлей и складской учет онлайн
 Українські, російські, білоруські, грузинські народні костюми
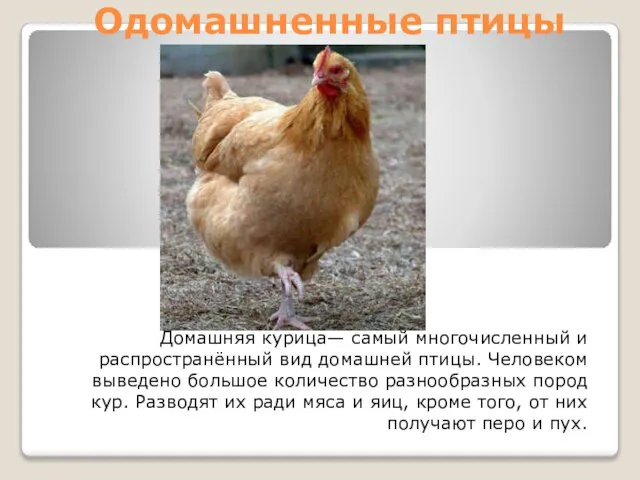 Одомашненные птицы
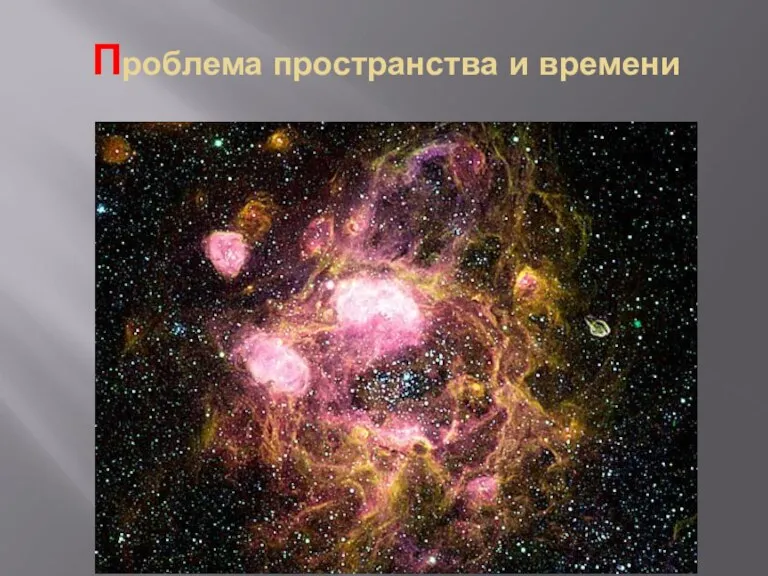 Проблема пространства и времени
 Презентация по английскому HOLIDAYS IN U.S.A
  Презентация на тему И.С.Никитин "Русь"
 ПРАВА РЕБЕНКА
 Русская народная вышивка
 Преобразования фигур в пространстве
 Презентация на тему ТКАНИ И ОРГАНЫ ЧЕЛОВЕКА биология 8 класс