Слайд 2 IMPORTANT NOTICE (Дисклэймер)
This presentation has been prepared by OAO Protek (the
"Company"). By attending the meeting where the presentation is made, or by reading the presentation slides, you agree to the following limitations and notifications.
This presentation is strictly confidential to the recipient, may not be distributed to the press or any other person, and may not be reproduced in any form, in whole or in part. Failure to comply with this restriction may constitute a violation of applicable securities laws.
This presentation does not constitute or form part of an offer, solicitation, or invitation to subscribe for, underwrite or otherwise acquire, and should not be construed as an advertisement for, any securities of the Company or any of its subsidiaries in any jurisdiction or an inducement to enter into investment activity in any jurisdiction. Neither this presentation nor any part thereof, nor the fact of its distribution, shall form the basis of, or be relied on in connection with, any contract or commitment or investment decision whatsoever.
The information contained in this presentation has not been independently verified. The information in this presentation is subject to verification, completion and change without notice and the Company is not under any obligation to update or keep current the information contained herein. Accordingly, no representation, warranty or undertaking, express or implied, is made by the Company, directors, officers or employees as to, and no reliance should be placed on, the fairness, accuracy, completeness or correctness of the information or the opinions contained herein. The Company, directors, officers, employees, affiliates, advisers or representatives shall have no liability whatsoever (in negligence or otherwise) for any loss howsoever arising from any use of this presentation or its contents or otherwise arising in connection with the presentation.
In any member state of the European Economic Area, this presentation is made to and directed only at persons who are qualified investors within the meaning of article 2 (1)(e) of the Prospectus Directive (2003/71/EC) ("Qualified Investors"). In addition, in the United Kingdom, this presentation is made to and directed only at: (i) investment professionals falling within article 19(5) of the Financial Services and Markets Act 2000 (Financial Promotion) Order 2005 (the "Order") and (ii) high net worth individuals, and other persons to whom it may lawfully be communicated, falling within article 49(2)(A) to (D) of the Order (such persons together with Qualified Investors, being "Relevant Persons"). In these jurisdictions, persons who are not Relevant Persons must not rely on or act upon the information contained in this presentation or any of its contents. Any investment or investment activity to which this presentation relates is only available to Relevant Persons and will be engaged in only with Relevant Persons.
This presentation does not constitute an offer of securities for sale in the United States of America, its territories or possessions (the “United States”). Accordingly, neither this presentation nor any part or copy of it may be taken or transmitted into the United States or distributed, directly or indirectly, in the United States or to any “US person” (as that term is defined in the US Securities Act of 1933, as amended (the “Securities Act”)) except in reliance on an exemption from the registration requirements of the Securities Act. Any failure to comply with this restriction may constitute a violation of United States securities laws. The Company’s securities have not been and will not be registered under the Securities Act and may not be offered or sold in the United States of America except pursuant to an exemption from, or a transaction not subject to, the registration requirements of the Securities Act.
Neither this presentation nor any part or copy of it may be taken or transmitted into Canada, Australia or Japan or distributed directly or indirectly in Canada or distributed or redistributed in Japan or to Canadian persons or to any securities analyst or other person resident in any of those jurisdictions. Any failure to comply with this restriction may constitute a violation of Canadian, Australian or Japanese securities law. The distribution of this presentation in other jurisdictions may be restricted by law and persons into whose possession this presentation comes should inform themselves about, and observe, any such restrictions. The Company has not registered and does not intend to register any of its securities under the applicable securities laws of Canada, Australia or Japan.
This presentation does not constitute an offer to the public or an advertisement of any securities in the Russian Federation, and is not an offer or an invitation to make offers to purchase securities in the Russian Federation, and must not be passed on to third parties or otherwise made publicly available in the Russian Federation.
This presentation is not directed at, or intended for distribution to or use by, any person or entity that is a citizen or resident or located in any locality, state, country or other jurisdiction where such distribution, publication, availability or use would be contrary to law or regulation or which would require any registration or licensing within such jurisdiction. The information contained in this presentation does not constitute a public offer under any applicable legislation, or an offer to sell or solicitation of an offer to buy any securities.
Matters discussed in this presentation may constitute forward-looking statements. Forward-looking statements include statements concerning plans, objectives, goals, strategies, future events or performance, and underlying assumptions and other statements, which are other than statements of historical facts. The words “believe”, “expect”, “anticipate”, “intends”, “plan”, “estimate”, “aim”, “forecast”, “project”, “will”, “may”, “might”, “should”, “could” and similar expressions (or their negative) identify certain of these forward-looking statements. Forward-looking statements include statements regarding: strategies, outlook and growth prospects; future plans and potential for future growth; liquidity, capital resources and capital expenditures; growth in demand for products; economic outlook and industry trends; developments of markets; the impact of regulatory initiatives; and the strength of competitors.
The forward-looking statements in this presentation are based upon various assumptions, many of which are based, in turn, upon further assumptions, including without limitation, management’s examination of historical operating trends, data contained in the Company’s records and other data available from third parties. These assumptions are inherently subject to significant uncertainties and contingencies which are difficult or impossible to predict and are beyond the Company’s control and it may not achieve or accomplish these expectations, beliefs or projections. In addition, important factors that, in the view of the Company, could cause actual results to differ materially from those discussed in the forward-looking statements include the achievement of the anticipated levels of profitability, growth, cost and its recent acquisitions, the timely development of new projects, the impact of competitive pricing, the ability to obtain necessary regulatory approvals, and the impact of general business and global economic conditions. Past performance should not be taken as an indication or guarantee of future results, and no representation or warranty, express or implied, is made regarding future performance.
These forward looking statements speak only as at the date as of which they are made, and none of the Company, directors, officers, employees, affiliates, advisers or representatives intend or have any duty or obligation to supplement, amend, update or revise any of the forward-looking statements contained in this presentation, or to reflect any change in the Company's expectations with regard thereto or any change in events, conditions, or circumstances on which any such statements are based or to update or to keep current any other information contained in this presentation.
Some of the information in the presentation is still in draft form and will only be finalised at the time of the Offering. The information and opinions contained in this presentation are provided as at the date of this presentation and are subject to change without notice.

 Гестационнный сахарный диабет
 Будова Атома
 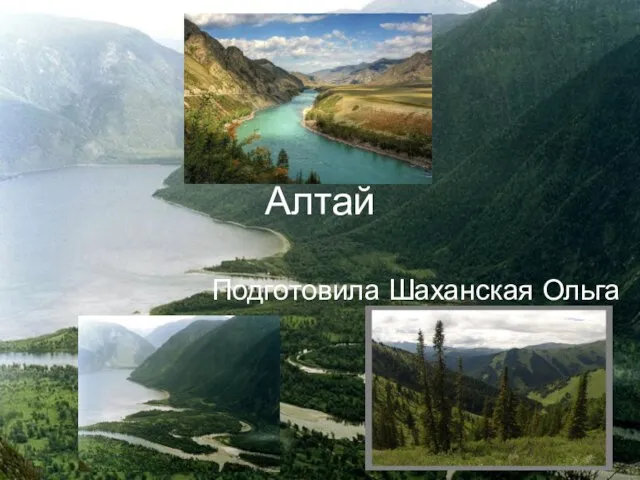 Презентация на тему Алтай
 Понятие и формы реализации права
 Самоуправление
 Наш Пушкин
 Обзор программ CCNA v.4.0
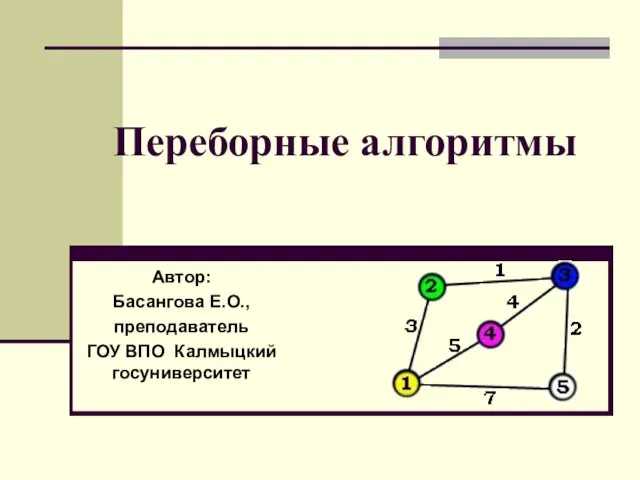 Переборные алгоритмы
 Конструирование из строительного материала в младшей группе
 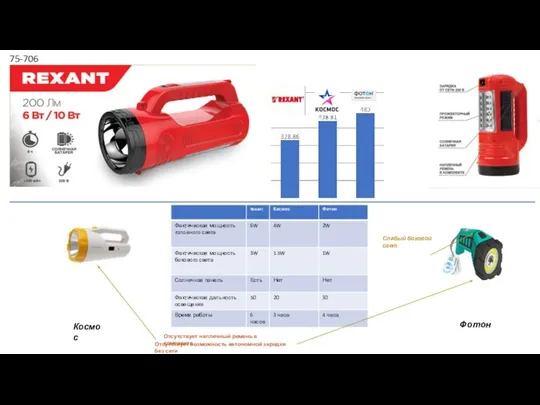 Фонари
 Омонимы и омографы
 Соломинки. Делаем своими руками
 Инструкция по оформлению витрин ППО рекламной продукцией A1
 Выбирай банк смолоду
 Расчет электрических цепей
 РОЗНИЧНАЯ ТОРГОВЛЯ
 мужчины и женщины - такие похожие и такие разные?
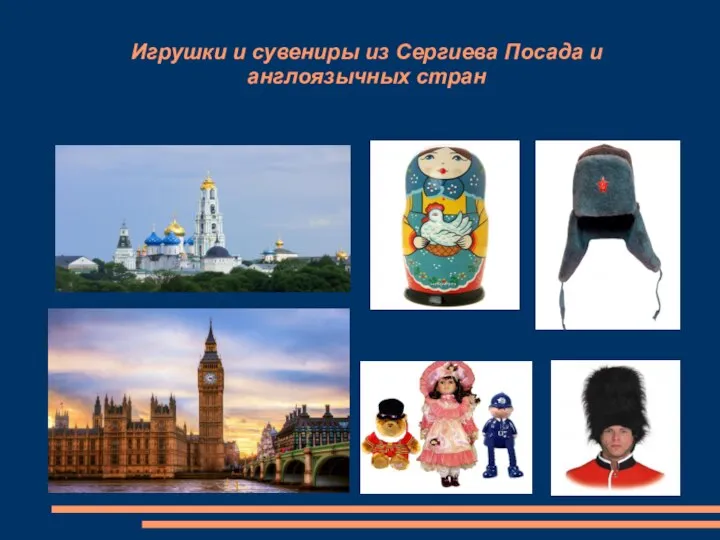 Игрушки и сувениры из Сергиева Посада и англоязычных стран
 Потому что знает:выйти из нее можно только одним способом.И нормальному человеку он не годится.
 Выдающиеся деятели культуры. Генри Мур (1898-1986)
 И.Бунин Современная политическая ситуация в России: основные проблемы
 Видеопрезентация рисунков учеников 2а класса
 Субъекты и участники обязательного медицинского страхования: понятие и различие правового статуса
 ЧТО ИЗУЧАЮТ СИНТАКСИС И ПУНКТУАЦИЯ
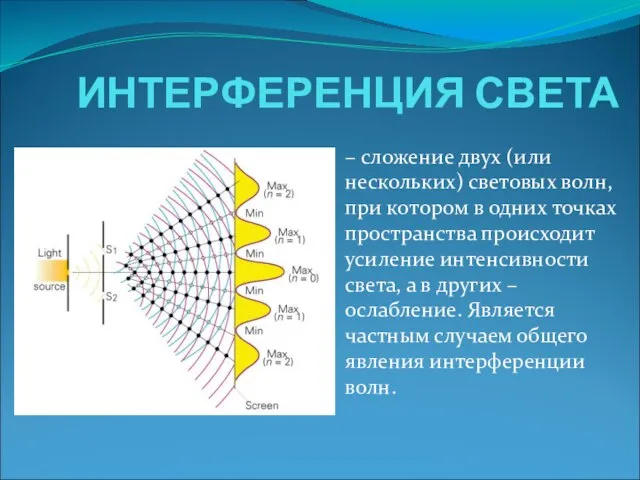 Интерференция света
  Единый государственный экзамен: проблемы содержания и организации
 Теория организации. Классические виды организационных структур. (Тема 2)
 КООРДИНАЦИЯ МЕЖДУНАРОДНОГО СОТРУДНИЧЕСТВА МЕЖДУ РОССИЙСКОЙ ТП И ЕВРОПЕЙСКИМИ СТИ В ОБЛАСТИ АЭРОНАВТИКИ