- Survey Research

Содержание
- 2. Outline Introduction Classification of surveys Steps in survey research Some problems in survey research References
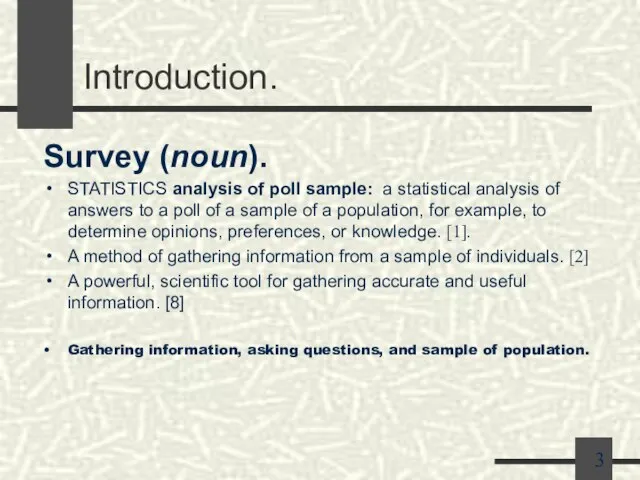
- 3. Introduction. Survey (noun). STATISTICS analysis of poll sample: a statistical analysis of answers to a poll
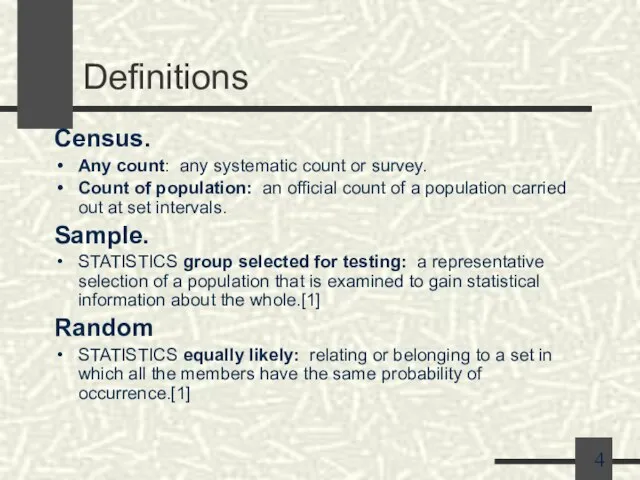
- 4. Definitions Census. Any count: any systematic count or survey. Count of population: an official count of
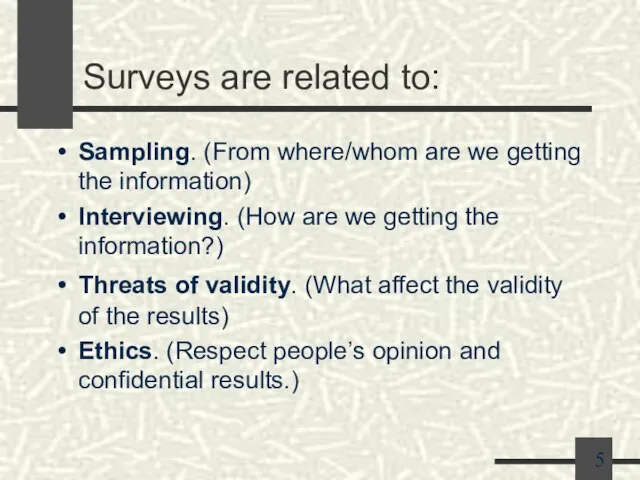
- 5. Surveys are related to: Sampling. (From where/whom are we getting the information) Interviewing. (How are we
- 6. Why Are Surveys Conducted? Surveys provide an important source of basic scientific knowledge. Who may conducts
- 7. Requirements for Accurate Estimates[8] The sample is large enough to yield the desired level of precision.
- 8. Classification of Surveys By size (social, community and school surveys).[9] By result type (quantitative or qualitative).
- 9. Types of Survey [6] (Qualitative or Quantitative) Descriptive surveys are used to gather information largely on
- 10. Qualitative vs Quantitative Focus group [2] Provide qualitative information A wide range of information can be
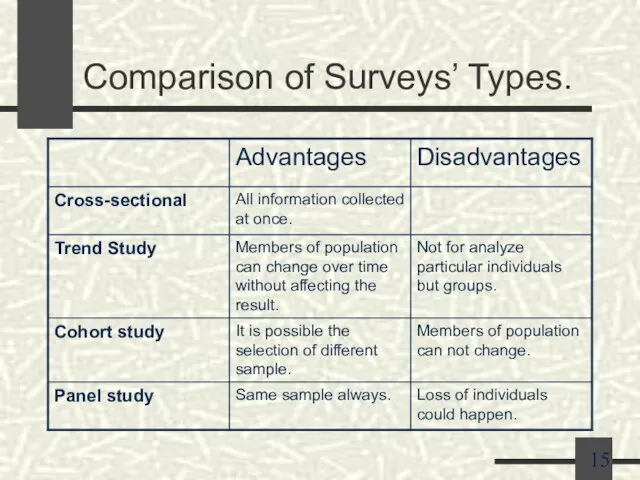
- 11. Types of Surveys[4] (Time and Population) Cross-sectional surveys. Collect information from the sample at the same
- 12. Types of Longitudinal Surveys Trend study. Members of the population can change, sample many times over
- 13. Types of Longitudinal Surveys Cohort study. Members of the population do not change, but maybe members
- 14. Types of Longitudinal Surveys Panel study. Always survey the SAME sample. Example. At the beginning of
- 15. Comparison of Surveys’ Types.
- 16. Steps in Survey Research[3] State the objectives of the survey Define the target population Define the
- 17. Steps in Survey Research 1. State the objectives of the survey. You have to define specifically
- 18. Steps in Survey Research 2. Define the target population. Defining the target population can be relatively
- 19. Steps in Survey Research 3. Define the data to be collected. What new information do you
- 20. Steps in Survey Research 4. Define the required precision and accuracy The most subjective stage is
- 21. Steps in Survey Research 5. Define the measurement `instrument‘. The measurement instrument is the method -
- 22. Define what kind of information Clarify what kind of information you are looking for. What people
- 23. Analyze the Different Ways of Communication. Visual (mail). Hear (telephone). All forms (face to face interview).
- 24. Kind of Question Structure. Which kind of question structure to use? Open-ended. Close-ended with ordered choices.
- 25. The Questionnaire[5] A effective questionnaire will follow this rules: It should be as brief as possible.
- 26. Problems in Questions. [8 Pp 97] What percentage of your weekly grocery bill is spent on
- 27. Problems in Questions. [8 pp 99] How many hours a day did you work last week?
- 28. Problems in Questions.[8 pp 97] Do you favor protecting U.S. textile manufacturers from foreign competition but
- 29. Steps in Survey Research 6. Define the sample frame, sample size and sampling method. The sample
- 30. Steps in Survey Research 7. Select the sample. The sample is selected, using the sample method
- 31. Types of Errors. Coverage error occurs when the list (or frame) from which a sample is
- 32. Errors Examples. Prior to the 1936 united states presidential election, pollsters for the magazine Literary Digest
- 33. Errors Examples. Interviewer: The President recently increased the number of U.S. troops in the Persian Gulf.
- 34. Errors examples. When asked about “welfare,” a majority of Americans in one survey said that the
- 35. NBC/wall Street Journal Poll Do you favor cutting programs such as social security, medicare, medicaid, and
- 36. Steps in Survey Research 8. Collect the data. Apply the instrument to collect the information. There
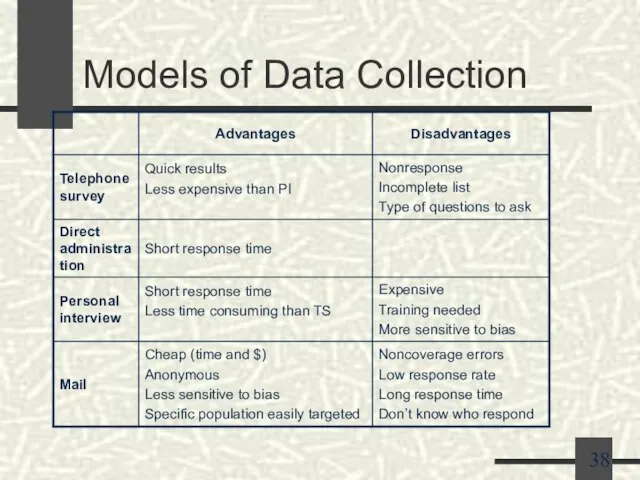
- 37. Models of Data Collection[4]
- 38. Models of Data Collection
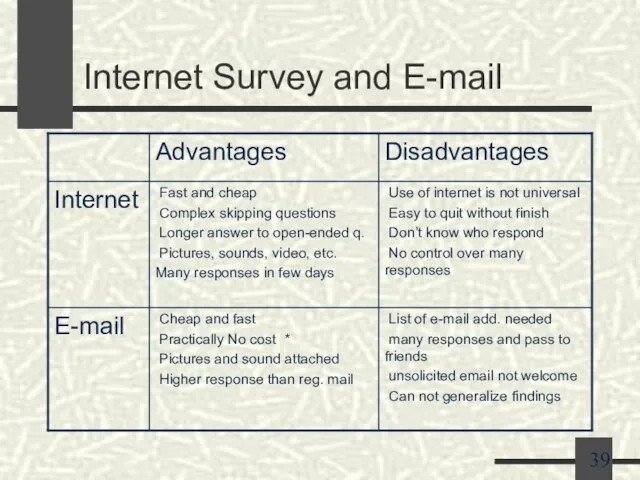
- 39. Internet Survey and E-mail
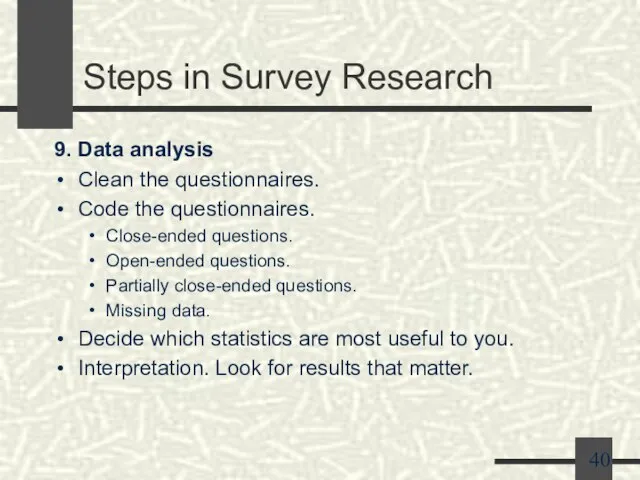
- 40. Steps in Survey Research 9. Data analysis Clean the questionnaires. Code the questionnaires. Close-ended questions. Open-ended
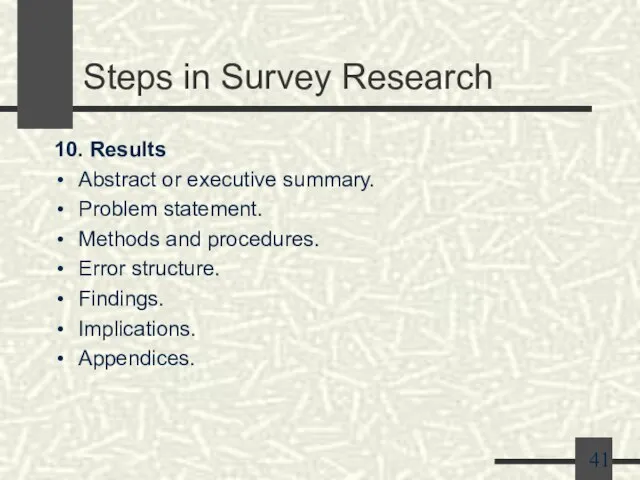
- 41. Steps in Survey Research 10. Results Abstract or executive summary. Problem statement. Methods and procedures. Error
- 42. Some Problems in Survey Research. Nonresponse. Why is this a problem? Those that do not respond
- 43. Suggestions for increasing response rate: Use multiple contacts including: Send a preliminary announcing the survey. Mali
- 44. Some Problems in Survey Research. Problems in the Instrumentation Process in SR Several threats to the
- 45. Some Problems in Survey Research. Threats to Internal Validity Mortality.- Arise in longitudinal studies. Location.- Arise
- 47. Скачать презентацию
Слайд 2Outline
Introduction
Classification of surveys
Steps in survey research
Some problems in survey research
References
Outline
Introduction
Classification of surveys
Steps in survey research
Some problems in survey research
References
Слайд 3Introduction.
Survey (noun).
STATISTICS analysis of poll sample: a statistical analysis of answers to
Introduction.
Survey (noun).
STATISTICS analysis of poll sample: a statistical analysis of answers to
Слайд 4Definitions
Census.
Any count: any systematic count or survey.
Count of population: an official count
Definitions
Census.
Any count: any systematic count or survey.
Count of population: an official count
Слайд 5Surveys are related to:
Sampling. (From where/whom are we getting the information)
Interviewing. (How
Surveys are related to:
Sampling. (From where/whom are we getting the information)
Interviewing. (How
Слайд 6Why Are Surveys Conducted?
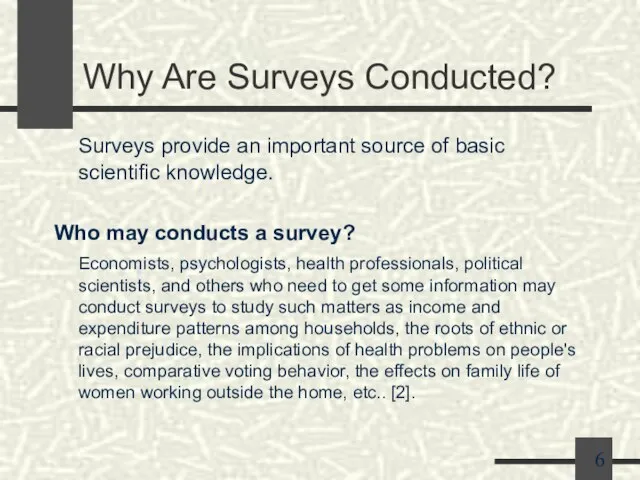
Surveys provide an important source of basic scientific knowledge.
Who
Why Are Surveys Conducted?
Surveys provide an important source of basic scientific knowledge.
Who
Слайд 7Requirements for Accurate Estimates[8]
The sample is large enough to yield the desired
Requirements for Accurate Estimates[8]
The sample is large enough to yield the desired
![Requirements for Accurate Estimates[8] The sample is large enough to yield the](/_ipx/f_webp&q_80&fit_contain&s_1440x1080/imagesDir/jpg/378769/slide-6.jpg)
Слайд 8Classification of Surveys
By size (social, community and school surveys).[9]
By result type (quantitative
Classification of Surveys
By size (social, community and school surveys).[9]
By result type (quantitative
![Classification of Surveys By size (social, community and school surveys).[9] By result](/_ipx/f_webp&q_80&fit_contain&s_1440x1080/imagesDir/jpg/378769/slide-7.jpg)
Слайд 9Types of Survey [6] (Qualitative or Quantitative)
Descriptive surveys are used to gather
Types of Survey [6] (Qualitative or Quantitative)
Descriptive surveys are used to gather
![Types of Survey [6] (Qualitative or Quantitative) Descriptive surveys are used to](/_ipx/f_webp&q_80&fit_contain&s_1440x1080/imagesDir/jpg/378769/slide-8.jpg)
Слайд 10Qualitative vs Quantitative
Focus group [2]
Provide qualitative information
A wide range of information can
Qualitative vs Quantitative
Focus group [2]
Provide qualitative information
A wide range of information can
![Qualitative vs Quantitative Focus group [2] Provide qualitative information A wide range](/_ipx/f_webp&q_80&fit_contain&s_1440x1080/imagesDir/jpg/378769/slide-9.jpg)
Слайд 11Types of Surveys[4]
(Time and Population)
Cross-sectional surveys. Collect information from the sample at the
Types of Surveys[4]
(Time and Population)
Cross-sectional surveys. Collect information from the sample at the
![Types of Surveys[4] (Time and Population) Cross-sectional surveys. Collect information from the](/_ipx/f_webp&q_80&fit_contain&s_1440x1080/imagesDir/jpg/378769/slide-10.jpg)
Слайд 12Types of Longitudinal Surveys
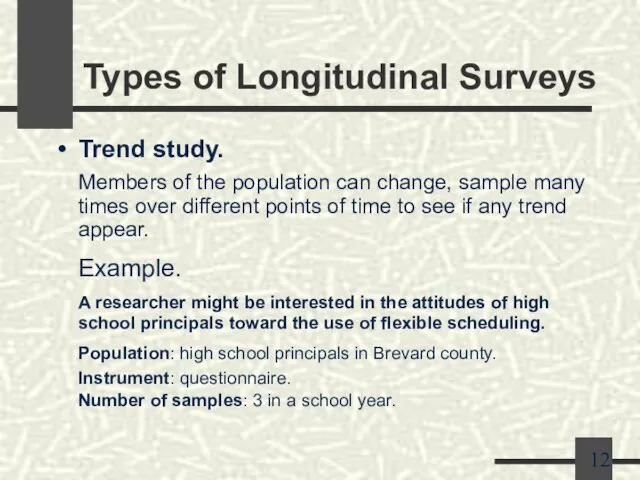
Trend study.
Members of the population can change, sample many
Types of Longitudinal Surveys
Trend study.
Members of the population can change, sample many
Слайд 13Types of Longitudinal Surveys
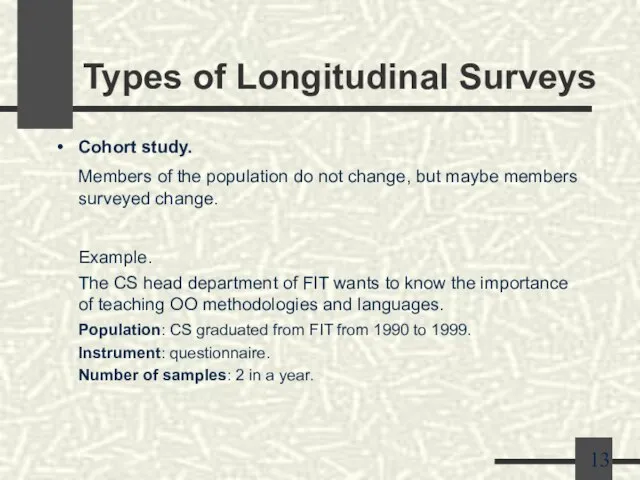
Cohort study.
Members of the population do not change, but
Types of Longitudinal Surveys
Cohort study.
Members of the population do not change, but
Слайд 14Types of Longitudinal Surveys
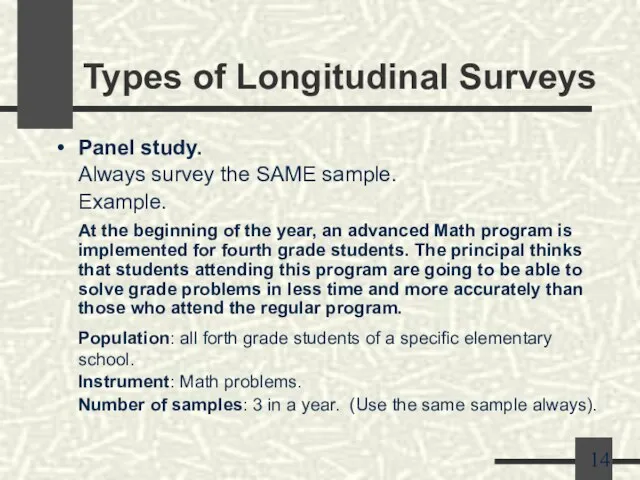
Panel study.
Always survey the SAME sample.
Example.
At the beginning of
Types of Longitudinal Surveys
Panel study.
Always survey the SAME sample.
Example.
At the beginning of
Слайд 15Comparison of Surveys’ Types.
Comparison of Surveys’ Types.
Слайд 16Steps in Survey Research[3]
State the objectives of the survey
Define the target population
Define
Steps in Survey Research[3]
State the objectives of the survey
Define the target population
Define
![Steps in Survey Research[3] State the objectives of the survey Define the](/_ipx/f_webp&q_80&fit_contain&s_1440x1080/imagesDir/jpg/378769/slide-15.jpg)
Слайд 17Steps in Survey Research
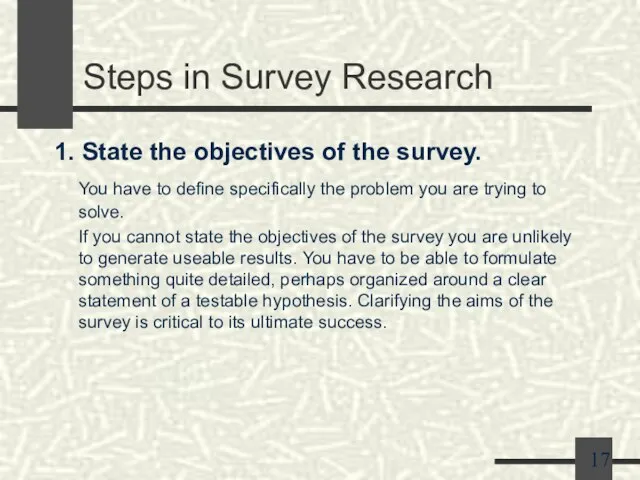
1. State the objectives of the survey.
You have to
Steps in Survey Research
1. State the objectives of the survey.
You have to
Слайд 18Steps in Survey Research
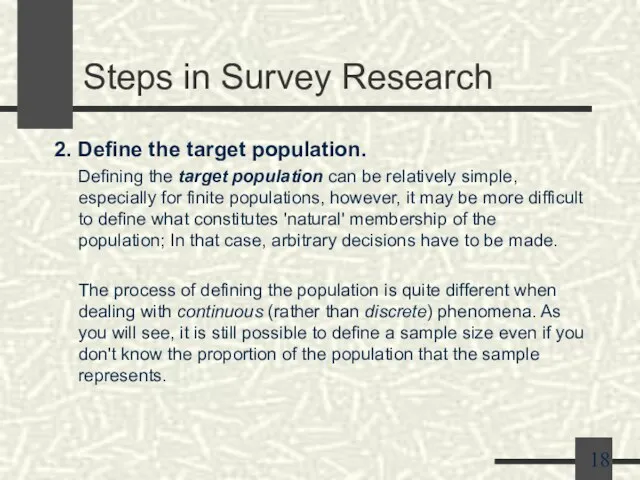
2. Define the target population.
Defining the target population can
Steps in Survey Research
2. Define the target population.
Defining the target population can
Слайд 19Steps in Survey Research
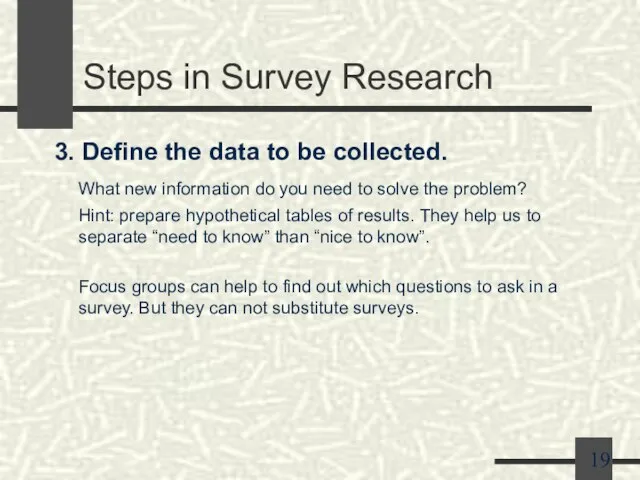
3. Define the data to be collected.
What new information
Steps in Survey Research
3. Define the data to be collected.
What new information
Слайд 20Steps in Survey Research
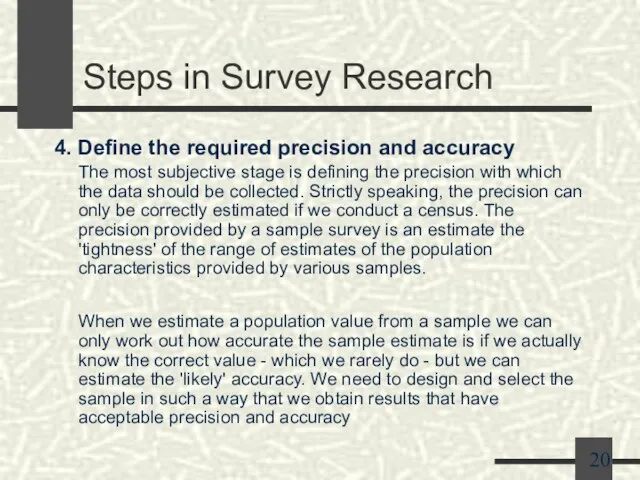
4. Define the required precision and accuracy
The most subjective
Steps in Survey Research
4. Define the required precision and accuracy
The most subjective
Слайд 21Steps in Survey Research
5. Define the measurement `instrument‘.
The measurement instrument is the
Steps in Survey Research
5. Define the measurement `instrument‘.
The measurement instrument is the
Слайд 22Define what kind of information
Clarify what kind of information you are looking
Define what kind of information
Clarify what kind of information you are looking
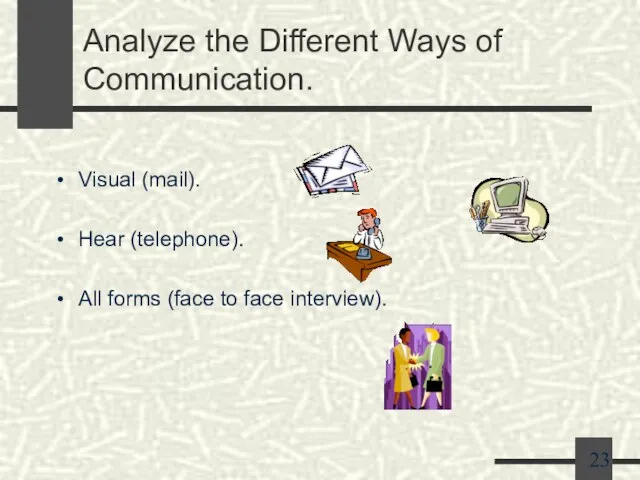
Слайд 23Analyze the Different Ways of Communication.
Visual (mail).
Hear (telephone).
All forms (face to face
Analyze the Different Ways of Communication.
Visual (mail).
Hear (telephone).
All forms (face to face
Слайд 24Kind of Question Structure.
Which kind of question structure to use?
Open-ended.
Close-ended with ordered
Kind of Question Structure.
Which kind of question structure to use?
Open-ended.
Close-ended with ordered
Слайд 25The Questionnaire[5]
A effective questionnaire will follow this rules:
It should be as brief
The Questionnaire[5]
A effective questionnaire will follow this rules:
It should be as brief
![The Questionnaire[5] A effective questionnaire will follow this rules: It should be](/_ipx/f_webp&q_80&fit_contain&s_1440x1080/imagesDir/jpg/378769/slide-24.jpg)
Слайд 26Problems in Questions. [8 Pp 97]
What percentage of your weekly grocery bill
Problems in Questions. [8 Pp 97]
What percentage of your weekly grocery bill
![Problems in Questions. [8 Pp 97] What percentage of your weekly grocery](/_ipx/f_webp&q_80&fit_contain&s_1440x1080/imagesDir/jpg/378769/slide-25.jpg)
Слайд 27Problems in Questions. [8 pp 99]
How many hours a day did you
Problems in Questions. [8 pp 99]
How many hours a day did you
![Problems in Questions. [8 pp 99] How many hours a day did](/_ipx/f_webp&q_80&fit_contain&s_1440x1080/imagesDir/jpg/378769/slide-26.jpg)
Слайд 28Problems in Questions.[8 pp 97]
Do you favor protecting U.S. textile manufacturers from
Problems in Questions.[8 pp 97]
Do you favor protecting U.S. textile manufacturers from
![Problems in Questions.[8 pp 97] Do you favor protecting U.S. textile manufacturers](/_ipx/f_webp&q_80&fit_contain&s_1440x1080/imagesDir/jpg/378769/slide-27.jpg)
Слайд 29Steps in Survey Research
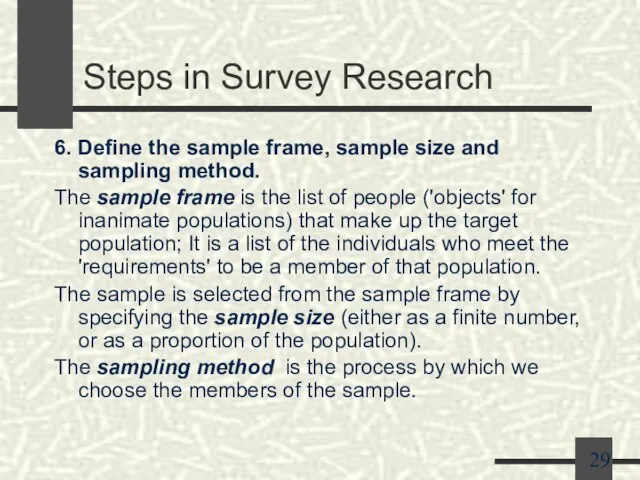
6. Define the sample frame, sample size and sampling
Steps in Survey Research
6. Define the sample frame, sample size and sampling
Слайд 30Steps in Survey Research
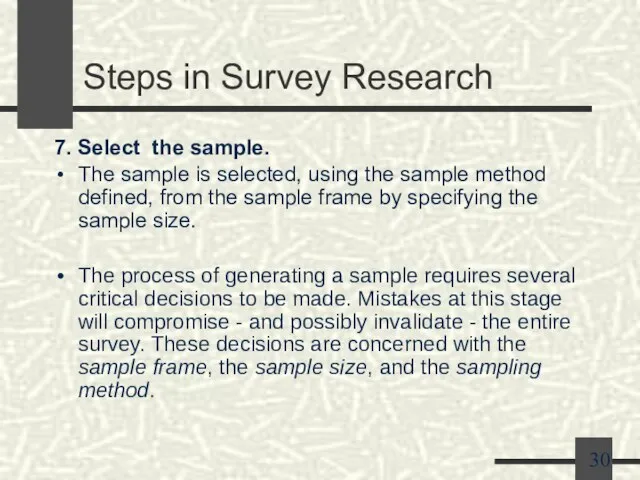
7. Select the sample.
The sample is selected, using the
Steps in Survey Research
7. Select the sample.
The sample is selected, using the
Слайд 31Types of Errors.
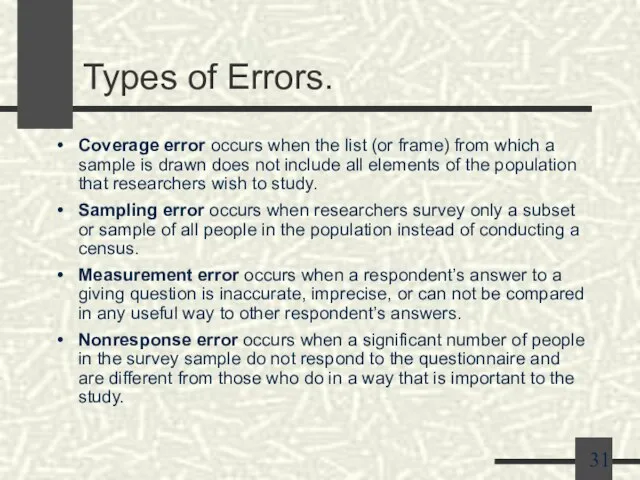
Coverage error occurs when the list (or frame) from which
Types of Errors.
Coverage error occurs when the list (or frame) from which
Слайд 32Errors Examples.
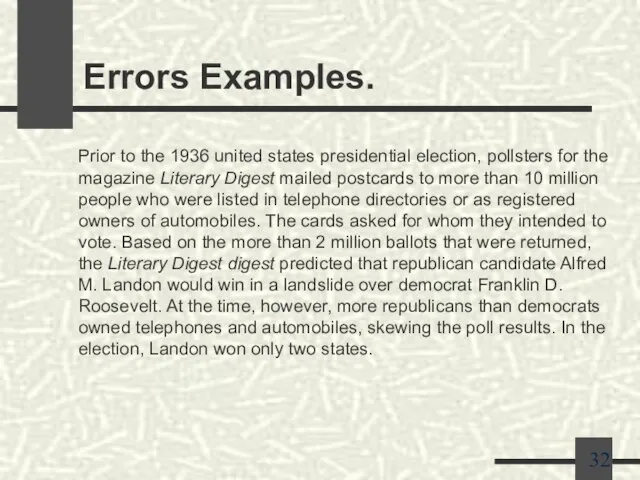
Prior to the 1936 united states presidential election, pollsters for the
Errors Examples.
Prior to the 1936 united states presidential election, pollsters for the
Слайд 33Errors Examples.
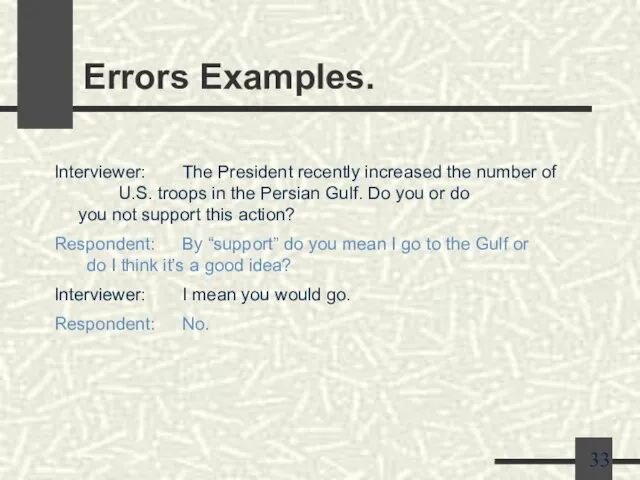
Interviewer: The President recently increased the number of U.S. troops in
Errors Examples.
Interviewer: The President recently increased the number of U.S. troops in
Слайд 34Errors examples.
When asked about “welfare,” a majority of Americans in one survey
Errors examples.
When asked about “welfare,” a majority of Americans in one survey

Слайд 35NBC/wall Street Journal Poll
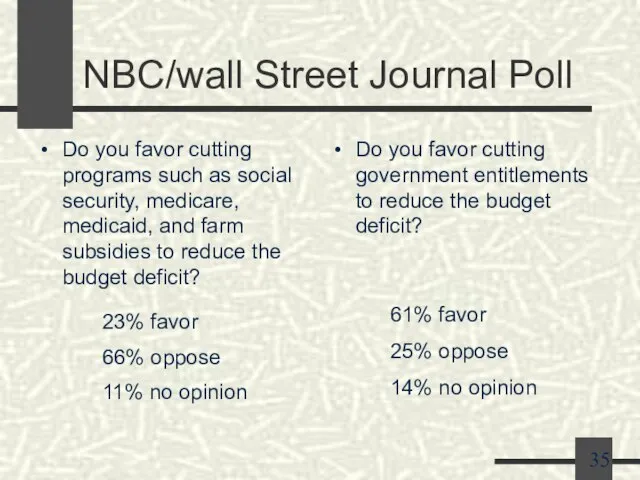
Do you favor cutting programs such as social security,
NBC/wall Street Journal Poll
Do you favor cutting programs such as social security,
Слайд 36Steps in Survey Research
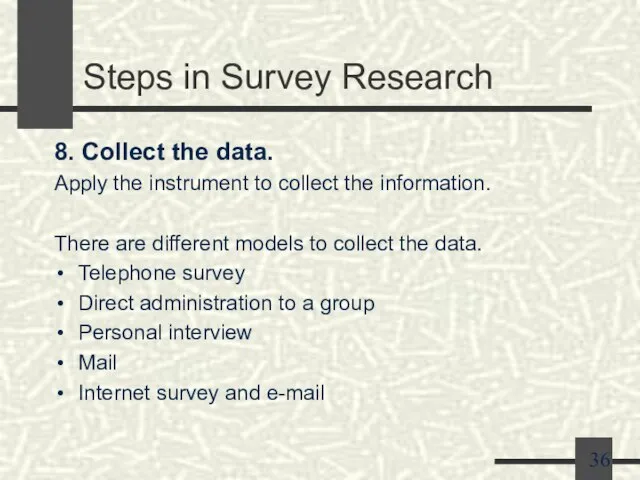
8. Collect the data.
Apply the instrument to collect the
Steps in Survey Research
8. Collect the data.
Apply the instrument to collect the
Слайд 37Models of Data Collection[4]
Models of Data Collection[4]
![Models of Data Collection[4]](/_ipx/f_webp&q_80&fit_contain&s_1440x1080/imagesDir/jpg/378769/slide-36.jpg)
Слайд 38Models of Data Collection
Models of Data Collection
Слайд 39Internet Survey and E-mail
Internet Survey and E-mail
Слайд 40Steps in Survey Research
9. Data analysis
Clean the questionnaires.
Code the questionnaires.
Close-ended
Steps in Survey Research
9. Data analysis
Clean the questionnaires.
Code the questionnaires.
Close-ended
Слайд 41Steps in Survey Research
10. Results
Abstract or executive summary.
Problem statement.
Methods and procedures.
Error structure.
Findings.
Implications.
Appendices.
Steps in Survey Research
10. Results
Abstract or executive summary.
Problem statement.
Methods and procedures.
Error structure.
Findings.
Implications.
Appendices.
Слайд 42Some Problems in Survey Research.
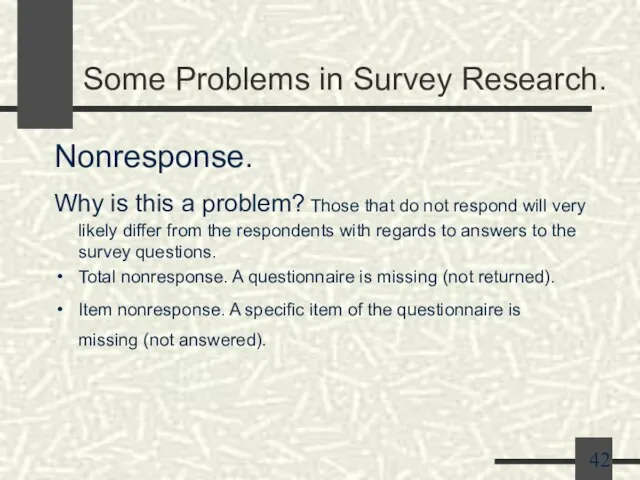
Nonresponse.
Why is this a problem? Those that do not
Some Problems in Survey Research.
Nonresponse.
Why is this a problem? Those that do not
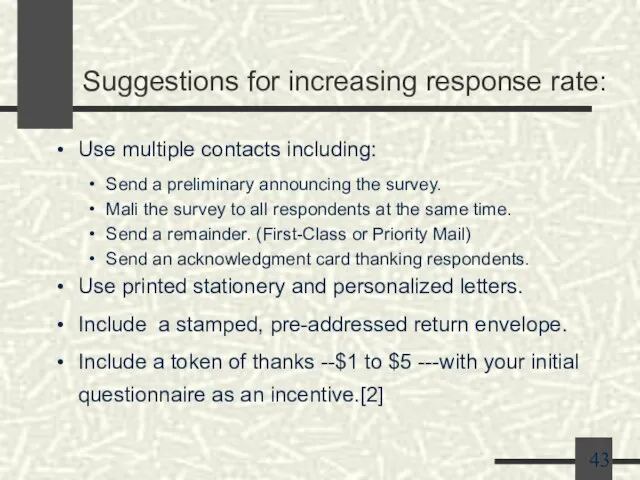
Слайд 43Suggestions for increasing response rate:
Use multiple contacts including:
Send a preliminary announcing the
Suggestions for increasing response rate:
Use multiple contacts including:
Send a preliminary announcing the
Слайд 44Some Problems in Survey Research.
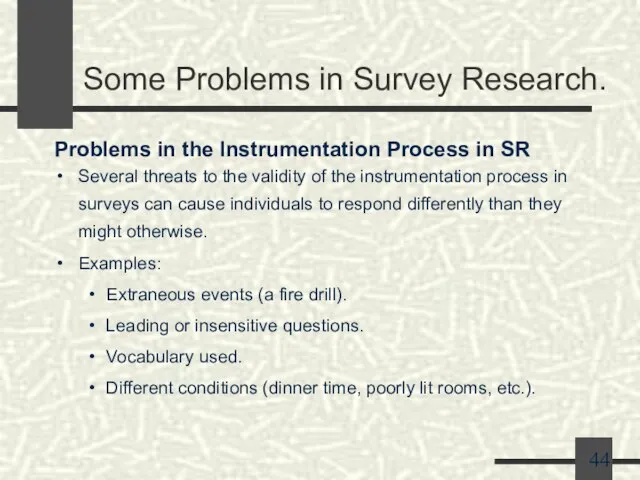
Problems in the Instrumentation Process in SR
Several threats
Some Problems in Survey Research.
Problems in the Instrumentation Process in SR
Several threats
Слайд 45Some Problems in Survey Research.
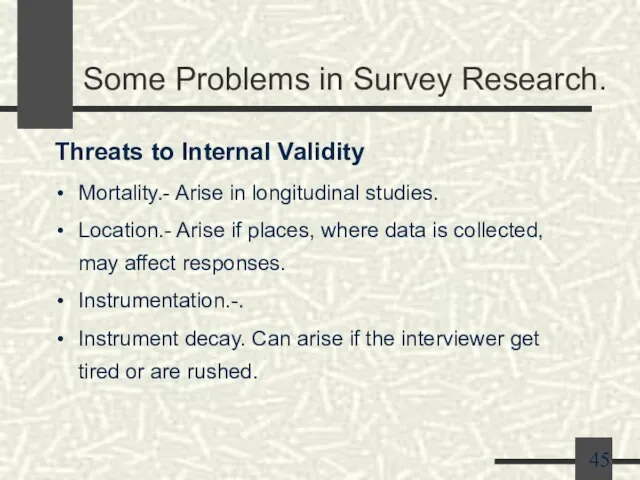
Threats to Internal Validity
Mortality.- Arise in longitudinal studies.
Location.-
Some Problems in Survey Research.
Threats to Internal Validity
Mortality.- Arise in longitudinal studies.
Location.-
 Н.А.Заболоцкий Некрасивая девочка
 Великий потоп
 Роль денег
 Каса-Мила. Антони Гауди
 Понятие, предмет, система конституционного права
 Классификация волокон
 Цветы из кругов
 Продажа непродовольственных товаров
 Станция Мультяшная
 Архитектура малых форм. Монументально-декоративное искусство в оформлении архитектурного пространства
 Муниципальное дошкольное образовательное учреждение «Детский сад №36»
 ВЕЛИКАЯ ОТЕЧЕСТВЕННАЯ ВОЙНА
 ПРОЕКТИРОВАНИЕ ОСНОВНОЙ ОБРАЗОВАТЕЛЬНОЙ ПРОГРАММЫ НАЧАЛЬНОГО ОБЩЕГО ОБРАЗОВАНИЯ. ВНЕУРОЧНАЯ ДЕЯТЕЛЬНОСТЬ: ЗАДАЧИ И ВОЗМОЖНОСТИ
 Рэкамендацыі па падрыхтоўцы прэзентацый
 Сентябрь
 Бюджетная реформа: повышение эффективности и результативности бюджетных расходов
 Танцы народов мира
 Закрашивание замкнутой области и рисование прямоугольника
 Способы и приемы преодоления коммуникативных барьеров
 Жизнь по законам математики
 Пороги и накладки на ступени
 Для фотосалонов. Компания Atlantis
 Аппликации из соломы
 Выполнила: Нуралиева Ж.Н. Т092
  Религия. Тотемизм. Исламизм. Буддизм. Фетишизм
 Особливості вступу до Криворізького національного університету
 Мысли Великих о здоровье
 Статистика зачисления на программу бакалавриата (прямое поступление и переводные студенты) 2014-2019