- Презентация к уроку английского языка "Economic Growth" -

Содержание
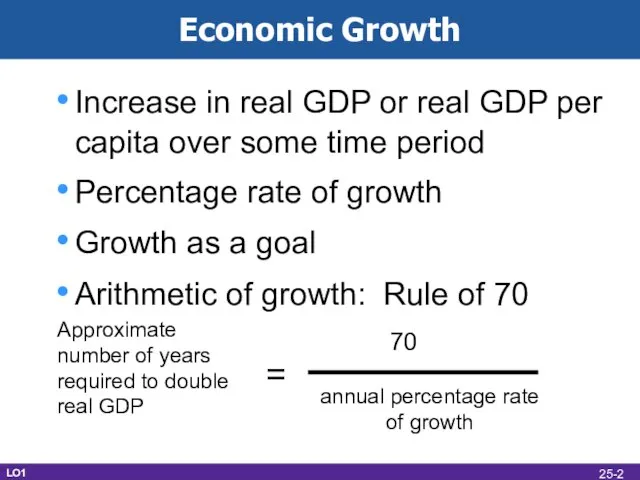
- 2. Economic Growth Increase in real GDP or real GDP per capita over some time period Percentage
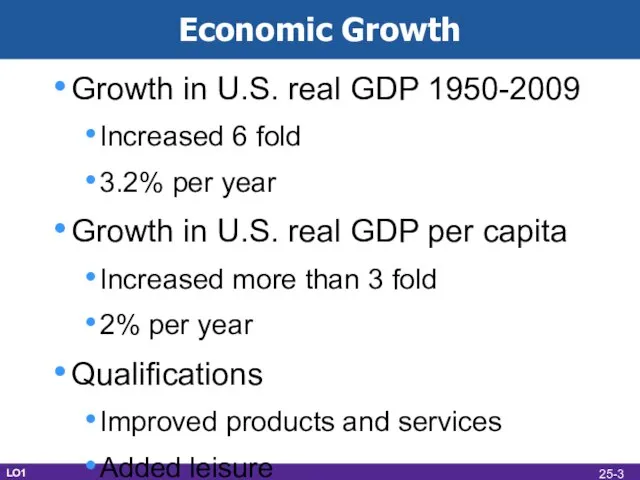
- 3. Economic Growth Growth in U.S. real GDP 1950-2009 Increased 6 fold 3.2% per year Growth in
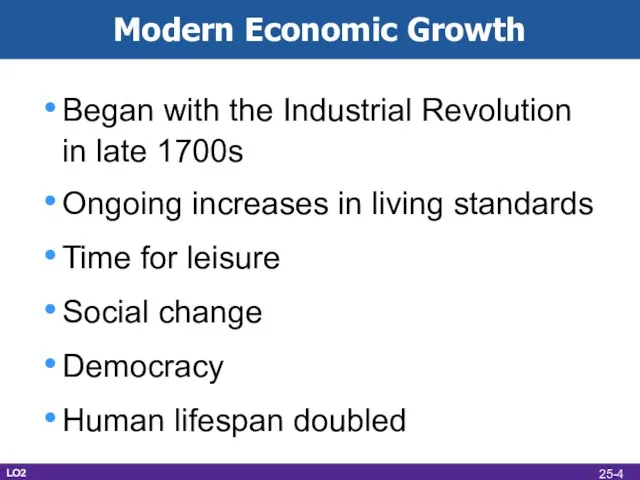
- 4. Modern Economic Growth Began with the Industrial Revolution in late 1700s Ongoing increases in living standards
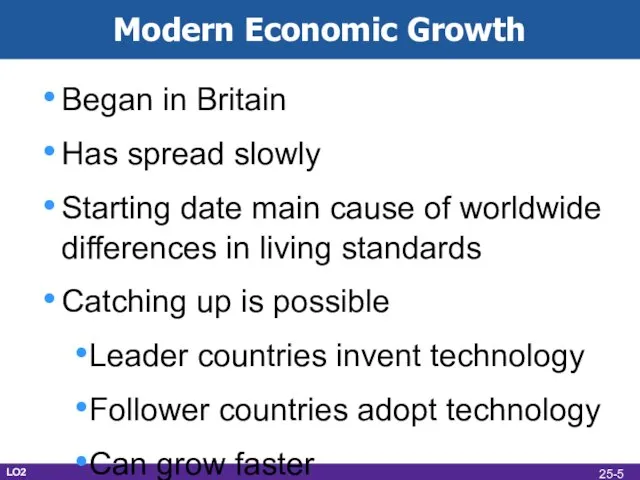
- 5. Modern Economic Growth Began in Britain Has spread slowly Starting date main cause of worldwide differences
- 6. Modern Economic Growth Real GDP Real GDP Average annual per capita, per capita, growth rate, Country
- 7. Modern Economic Growth LO3 25-
- 8. Institutional Structures of Growth Strong property rights Patents and copyrights Efficient financial institutions Literacy and widespread
- 9. Determinants of Growth LO3 25-
- 10. Accounting for Growth Factors affecting productivity growth Technological advance (40%) Quantity of capital (30%) Education and
- 11. Productivity Growth Average rate of growth 1.5% per year 1973-1995 2.8% per year 1995-2009 Affects real
- 12. Productivity Growth Microchip/information technology New firms and increasing returns Sources of increasing returns More specialized inputs
- 13. Economic Growth Is economic growth desirable and sustainable? The antigrowth view Environmental and resource issues In
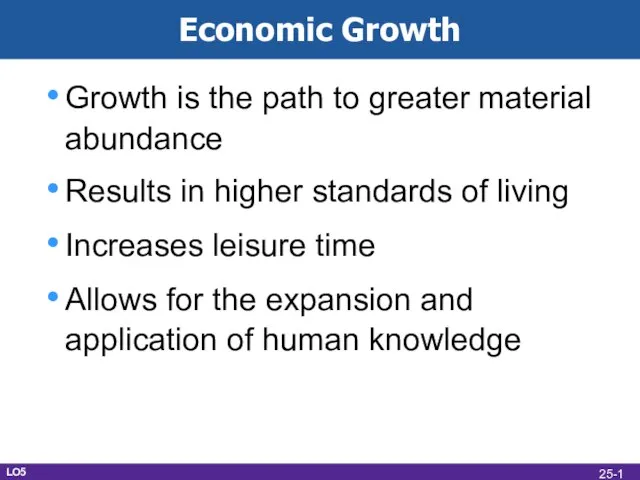
- 14. Economic Growth Growth is the path to greater material abundance Results in higher standards of living
- 16. Скачать презентацию
Слайд 3Economic Growth
Growth in U.S. real GDP 1950-2009
Increased 6 fold
3.2% per year
Economic Growth
Growth in U.S. real GDP 1950-2009
Increased 6 fold
3.2% per year
Слайд 4Modern Economic Growth
Began with the Industrial Revolution in late 1700s
Ongoing increases in
Modern Economic Growth
Began with the Industrial Revolution in late 1700s
Ongoing increases in
Слайд 5Modern Economic Growth
Began in Britain
Has spread slowly
Starting date main cause of worldwide
Modern Economic Growth
Began in Britain
Has spread slowly
Starting date main cause of worldwide
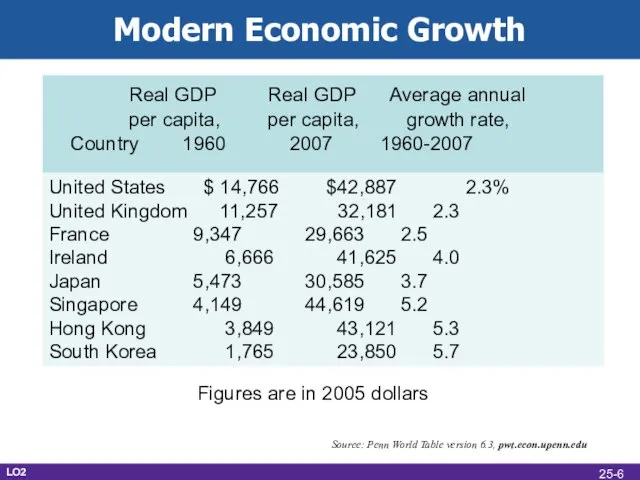
Слайд 6Modern Economic Growth
Real GDP Real GDP Average annual
per capita, per
Modern Economic Growth
Real GDP Real GDP Average annual
per capita, per
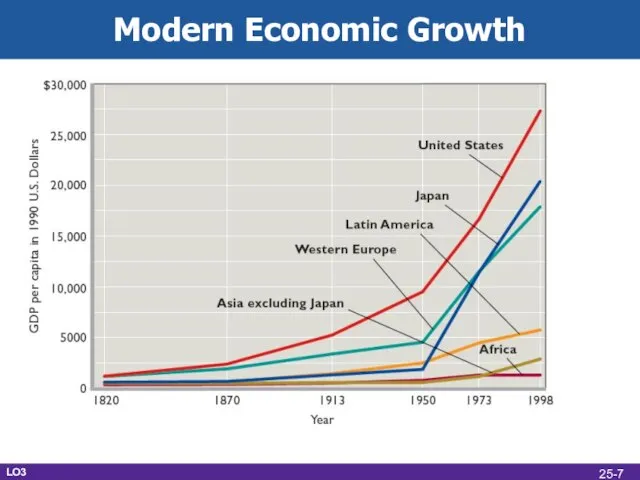
Слайд 7Modern Economic Growth
LO3
25-
Modern Economic Growth
LO3
25-
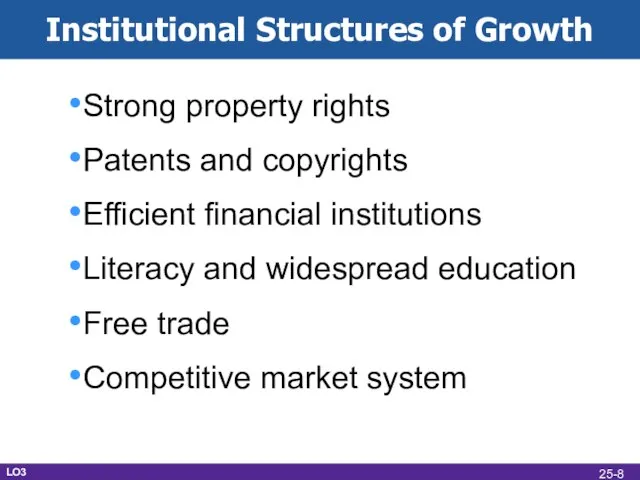
Слайд 8Institutional Structures of Growth
Strong property rights
Patents and copyrights
Efficient financial institutions
Literacy and widespread
Institutional Structures of Growth
Strong property rights
Patents and copyrights
Efficient financial institutions
Literacy and widespread
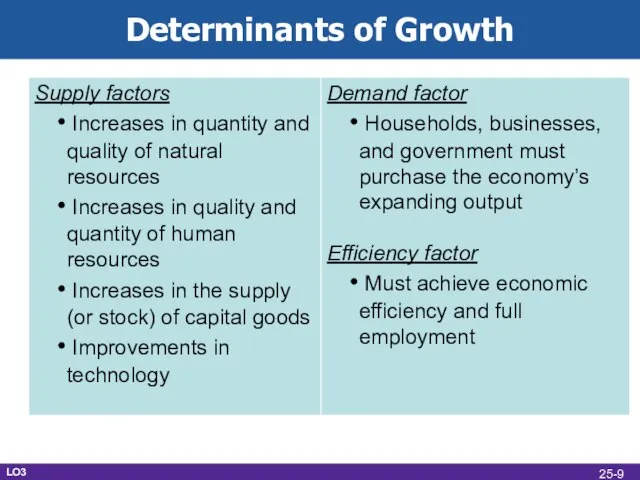
Слайд 9Determinants of Growth
LO3
25-
Determinants of Growth
LO3
25-
Слайд 10Accounting for Growth
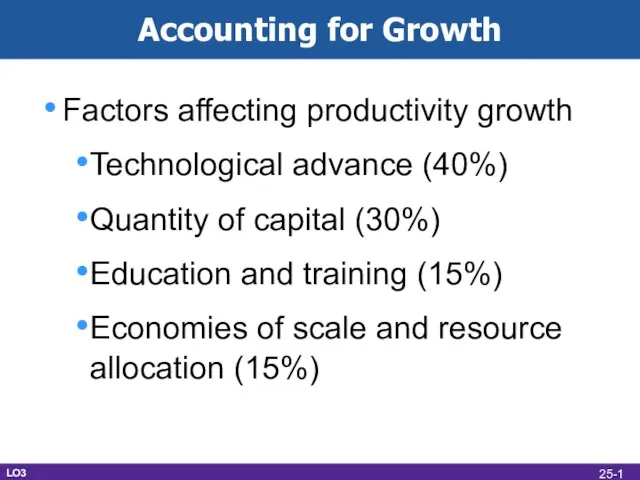
Factors affecting productivity growth
Technological advance (40%)
Quantity of capital (30%)
Education and
Accounting for Growth
Factors affecting productivity growth
Technological advance (40%)
Quantity of capital (30%)
Education and
Слайд 11Productivity Growth
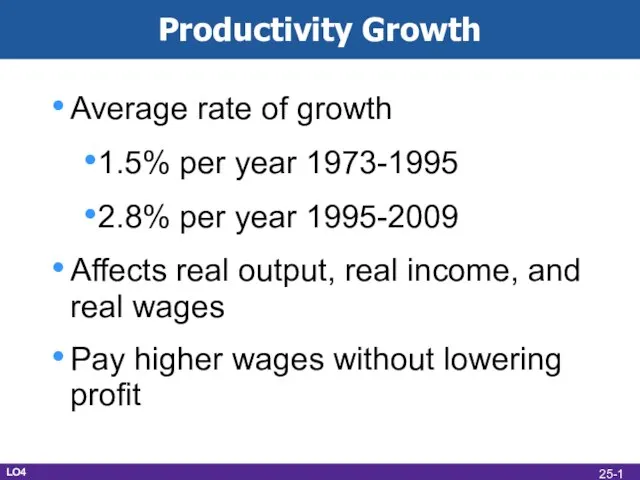
Average rate of growth
1.5% per year 1973-1995
2.8% per year 1995-2009
Affects real
Productivity Growth
Average rate of growth
1.5% per year 1973-1995
2.8% per year 1995-2009
Affects real
Слайд 12Productivity Growth
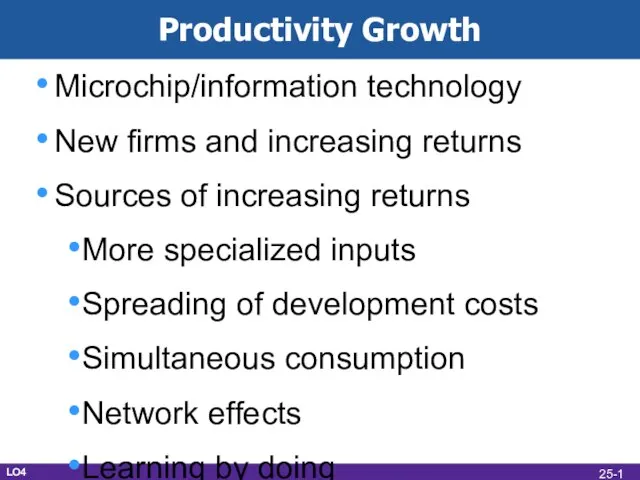
Microchip/information technology
New firms and increasing returns
Sources of increasing returns
More specialized inputs
Spreading
Productivity Growth
Microchip/information technology
New firms and increasing returns
Sources of increasing returns
More specialized inputs
Spreading
Слайд 13Economic Growth
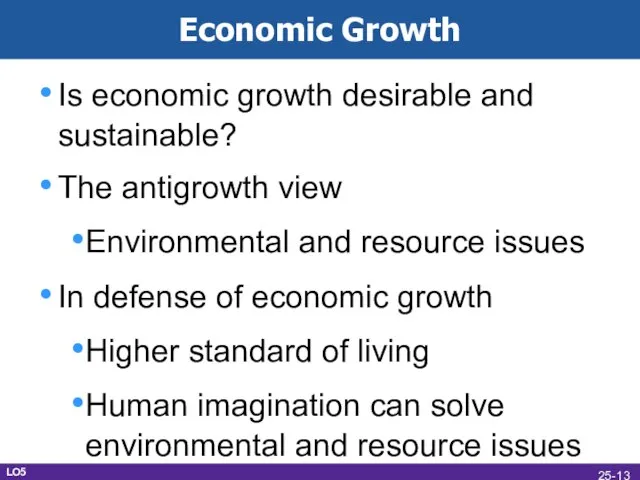
Is economic growth desirable and sustainable?
The antigrowth view
Environmental and resource issues
In
Economic Growth
Is economic growth desirable and sustainable?
The antigrowth view
Environmental and resource issues
In
Слайд 14Economic Growth
Growth is the path to greater material abundance
Results in higher standards
Economic Growth
Growth is the path to greater material abundance
Results in higher standards
 Why Aapple
 ГБОУ ДПО НИРО Система упражнений по формированию и совершенствованию лексических и грамматических навыков Выполнила: Осетрова
  Hello? What’s your name?
 Всероссийская олимпиада школьников по английскому языку
 Тренажёр по английскому языку (3 класс)
 Subject Link. Lesson 10
 Числа
Числа Модальные глаголы
 Моё расписание (Lesson 2. It’s the fifth lesson on Thursday.)
 Present Progressive (1)
 Complex addition
 Movers. Speaking test, part 3
 Going places (unit 7 lesson 7)
 The Geographical Position of Great Britain
 My way of diet
 My name is Tatiana
 Demonstrative pronouns
 Summer in a village
 An adventure holiday
 Friends forever
 Animals
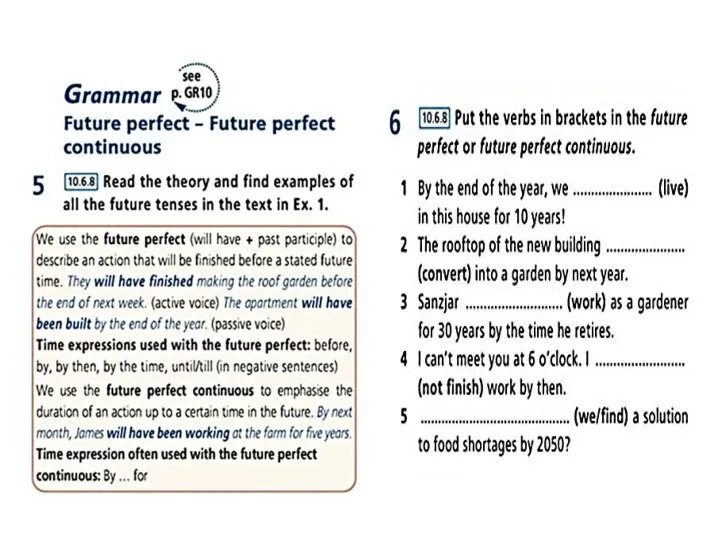 Grammar Future perfect - Future perfect continuous
 The present
 About my hobbies
 Speaking Games. The Extension Pack
 Appearance description
 Billy Elliot by Melvin Burgess
 Color and character