- Ricardian model

Содержание
- 2. Preview Opportunity costs and comparative advantage A one-factor Ricardian model Production possibilities Gains from trade Wages
- 3. Introduction Theories of why trade occurs: Differences across countries in labor, labor skills, physical capital, natural
- 4. Introduction (cont.) Sources of differences across countries that lead to gains from trade: The Ricardian model
- 5. Comparative Advantage and Opportunity Cost The Ricardian model uses the concepts of opportunity cost and comparative
- 6. Comparative Advantage and Opportunity Cost (cont.) For example, a limited number of workers could produce either
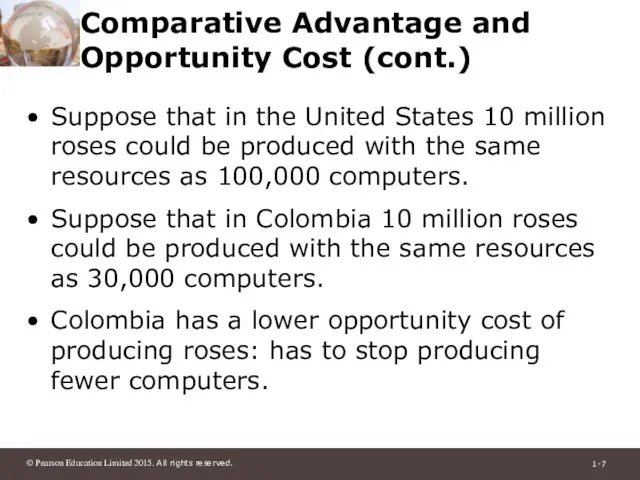
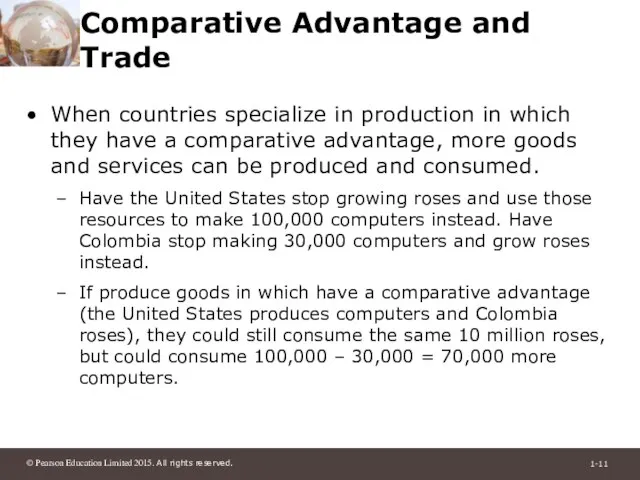
- 7. Comparative Advantage and Opportunity Cost (cont.) Suppose that in the United States 10 million roses could
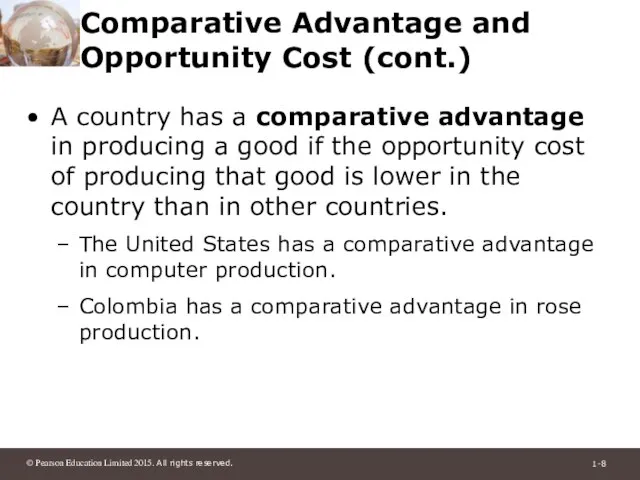
- 8. Comparative Advantage and Opportunity Cost (cont.) A country has a comparative advantage in producing a good
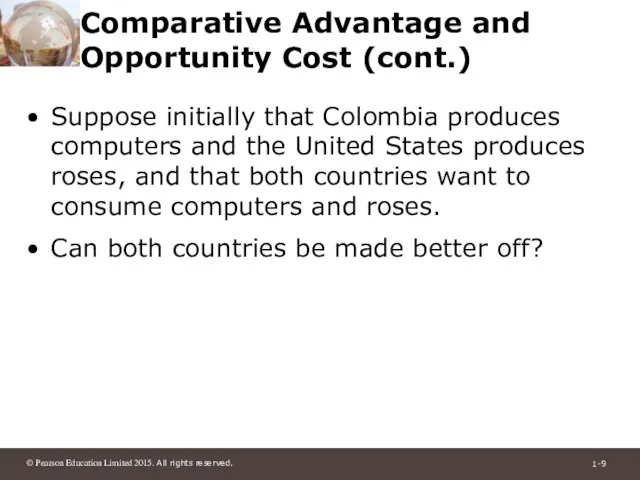
- 9. Comparative Advantage and Opportunity Cost (cont.) Suppose initially that Colombia produces computers and the United States
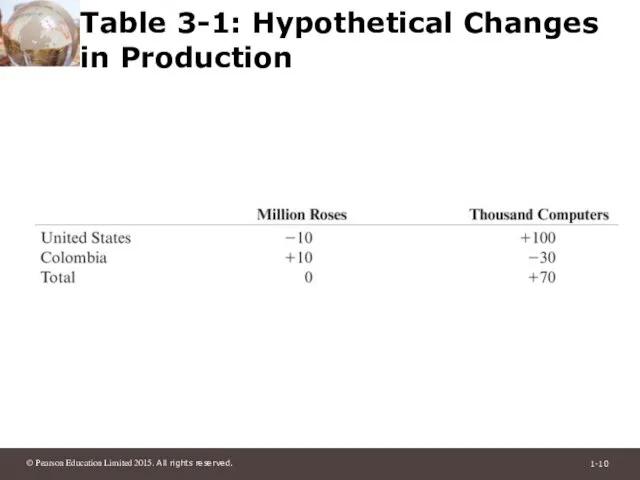
- 10. Table 3-1: Hypothetical Changes in Production
- 11. Comparative Advantage and Trade When countries specialize in production in which they have a comparative advantage,
- 12. A One-Factor Ricardian Model The simple example with roses and computers explains the intuition behind the
- 13. A One-Factor Ricardian Model (cont.) Labor is the only factor of production. Labor productivity varies across
- 14. A One-Factor Ricardian Model (cont.) Two goods: wine and cheese. Competition allows workers to be paid
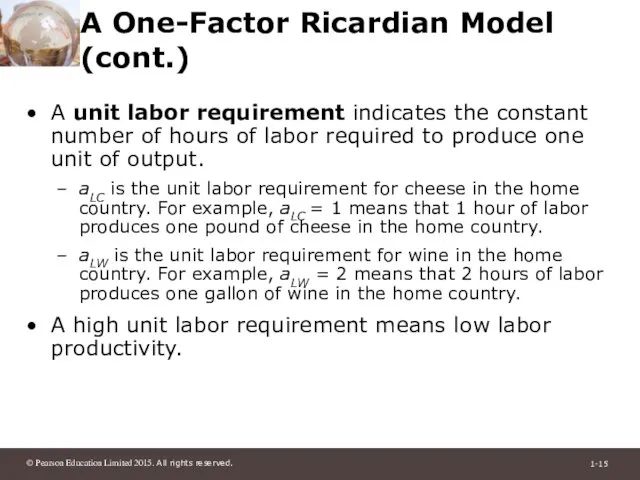
- 15. A One-Factor Ricardian Model (cont.) A unit labor requirement indicates the constant number of hours of
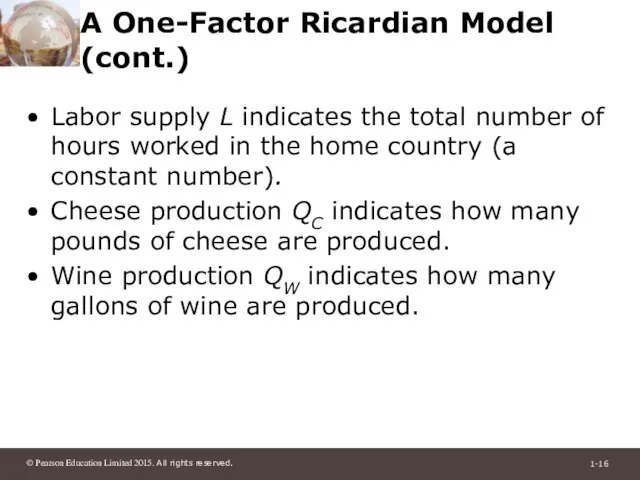
- 16. A One-Factor Ricardian Model (cont.) Labor supply L indicates the total number of hours worked in
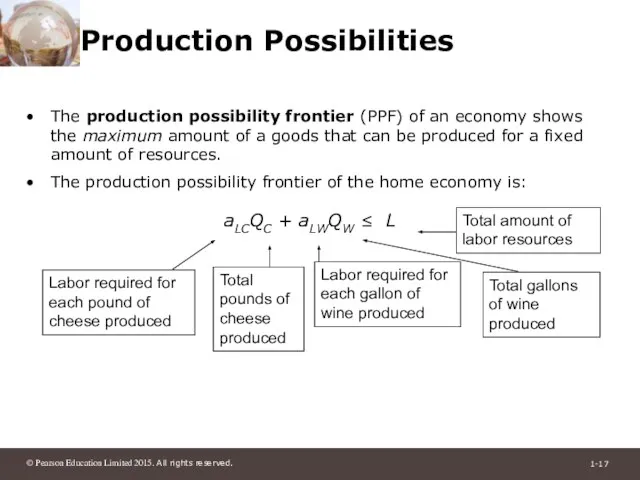
- 17. Production Possibilities The production possibility frontier (PPF) of an economy shows the maximum amount of a
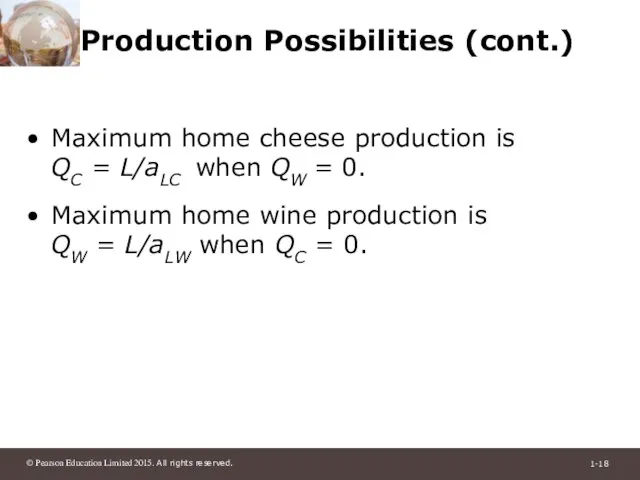
- 18. Production Possibilities (cont.) Maximum home cheese production is QC = L/aLC when QW = 0. Maximum
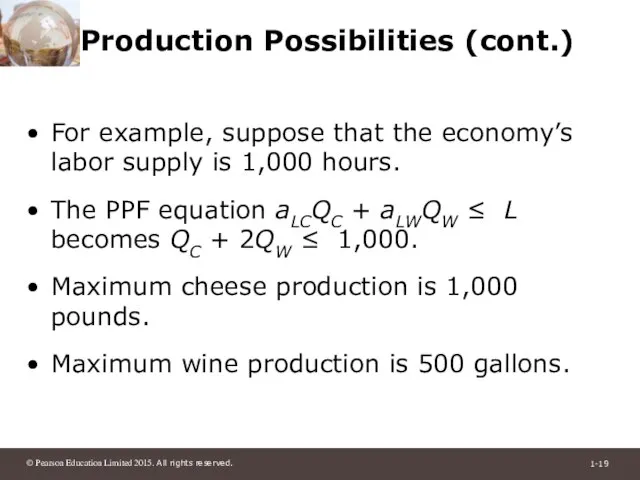
- 19. Production Possibilities (cont.) For example, suppose that the economy’s labor supply is 1,000 hours. The PPF
- 20. Fig. 3-1: Home’s Production Possibility Frontier
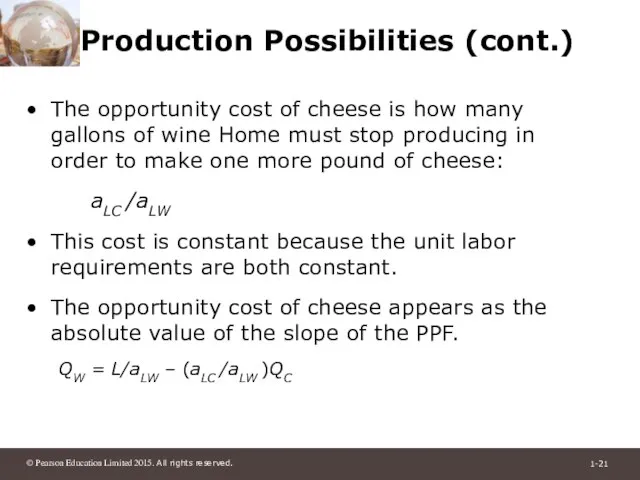
- 21. Production Possibilities (cont.) The opportunity cost of cheese is how many gallons of wine Home must
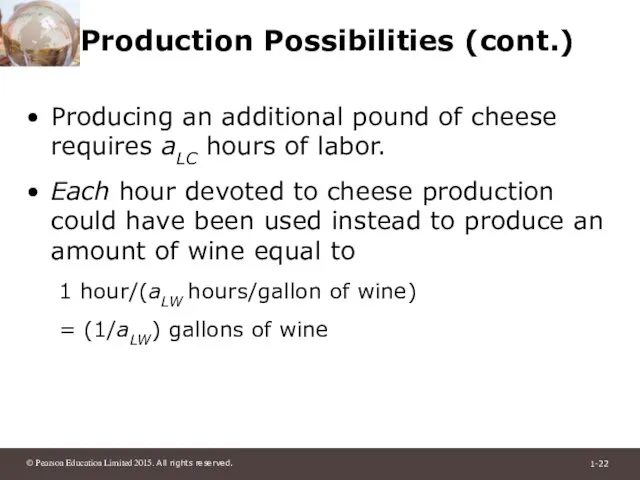
- 22. Production Possibilities (cont.) Producing an additional pound of cheese requires aLC hours of labor. Each hour
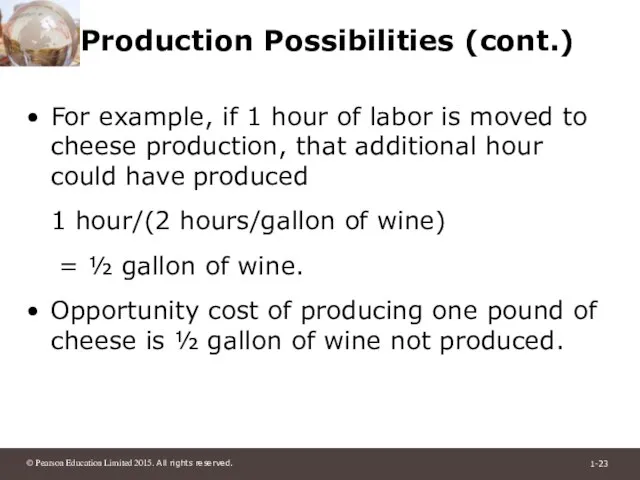
- 23. Production Possibilities (cont.) For example, if 1 hour of labor is moved to cheese production, that
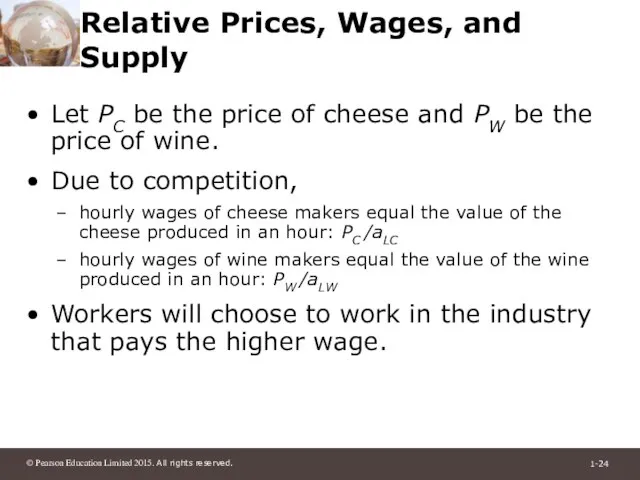
- 24. Relative Prices, Wages, and Supply Let PC be the price of cheese and PW be the
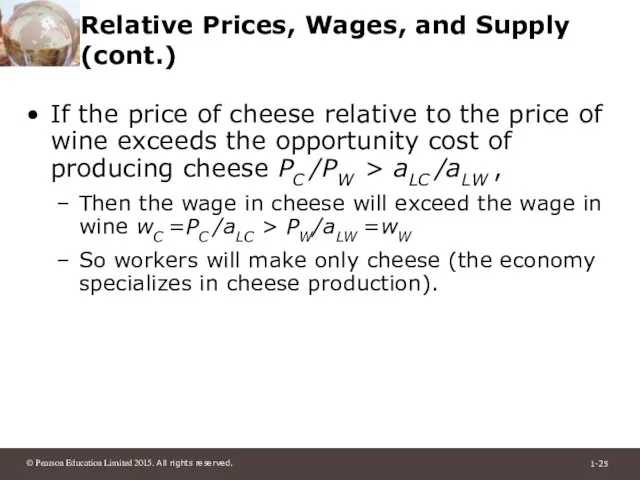
- 25. Relative Prices, Wages, and Supply (cont.) If the price of cheese relative to the price of
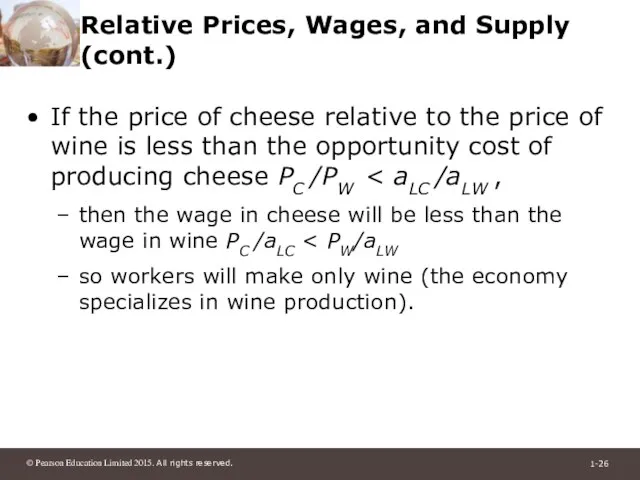
- 26. Relative Prices, Wages, and Supply (cont.) If the price of cheese relative to the price of
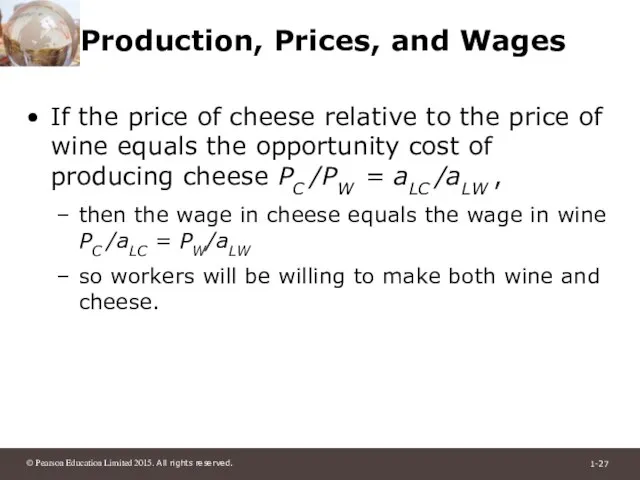
- 27. Production, Prices, and Wages If the price of cheese relative to the price of wine equals
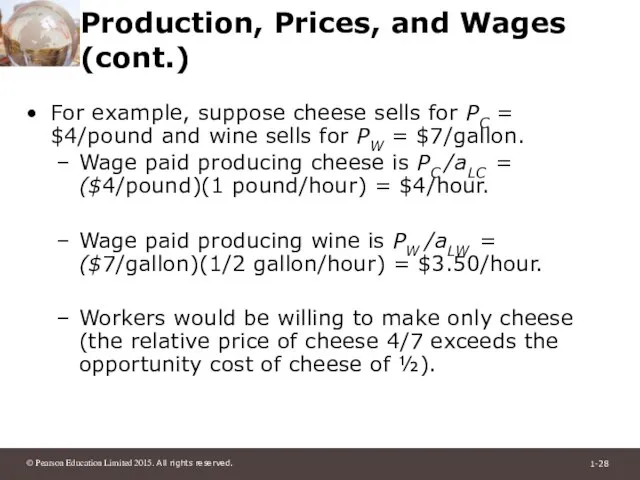
- 28. Production, Prices, and Wages (cont.) For example, suppose cheese sells for PC = $4/pound and wine
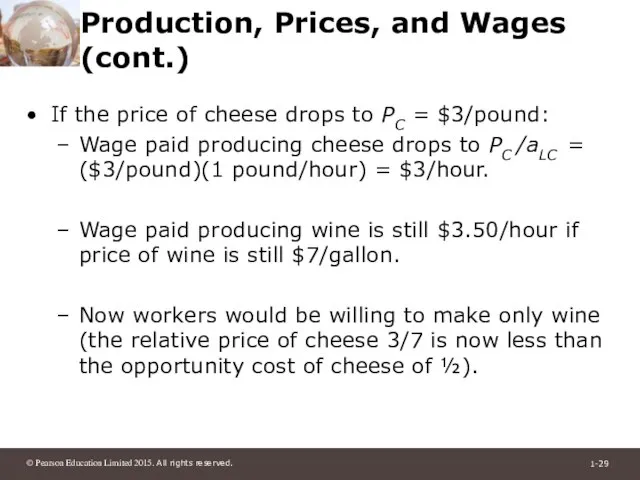
- 29. Production, Prices, and Wages (cont.) If the price of cheese drops to PC = $3/pound: Wage
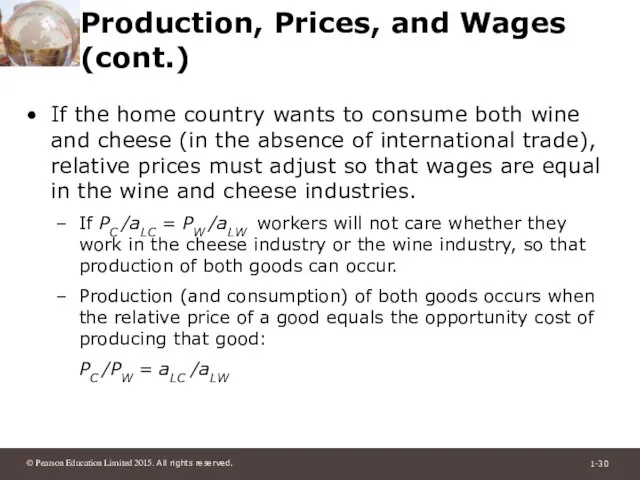
- 30. Production, Prices, and Wages (cont.) If the home country wants to consume both wine and cheese
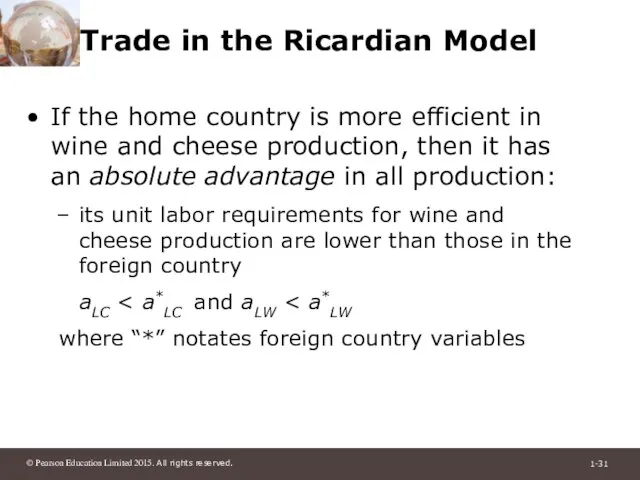
- 31. Trade in the Ricardian Model If the home country is more efficient in wine and cheese
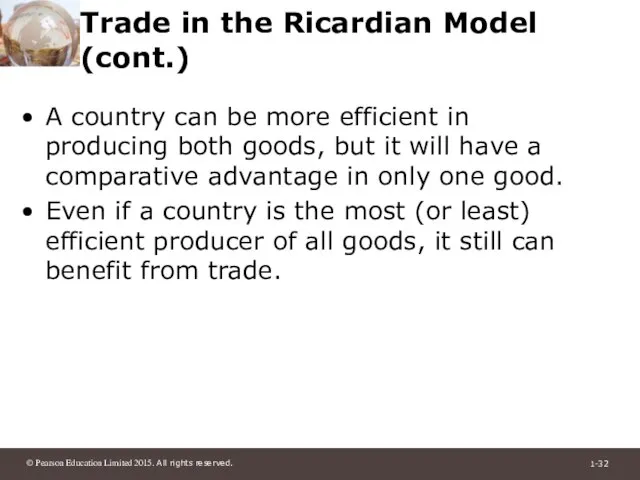
- 32. Trade in the Ricardian Model (cont.) A country can be more efficient in producing both goods,
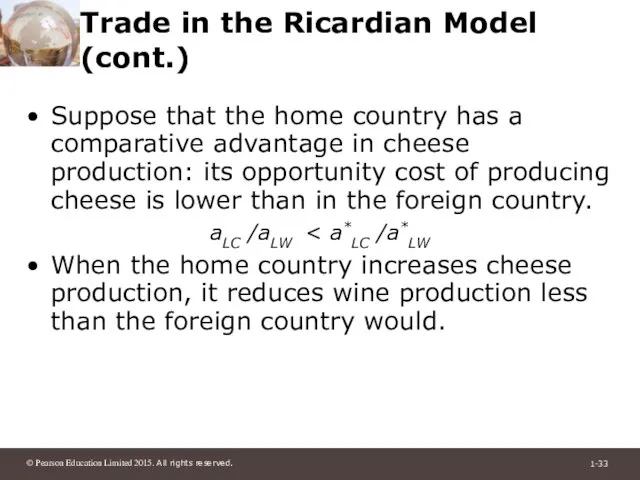
- 33. Trade in the Ricardian Model (cont.) Suppose that the home country has a comparative advantage in
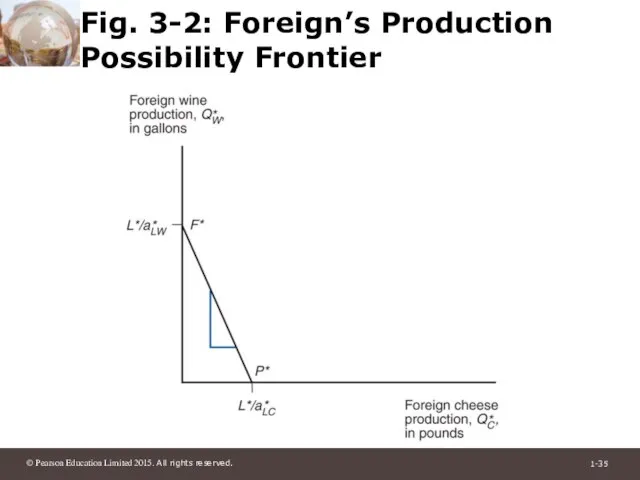
- 34. Trade in the Ricardian Model (cont.) Since the slope of the PPF indicates the opportunity cost
- 35. Fig. 3-2: Foreign’s Production Possibility Frontier
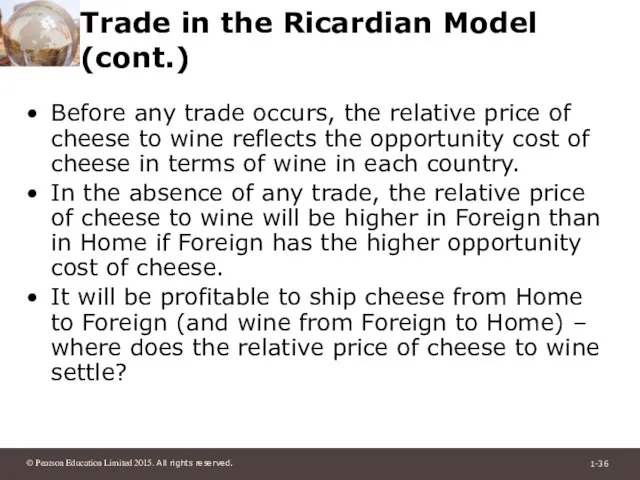
- 36. Trade in the Ricardian Model (cont.) Before any trade occurs, the relative price of cheese to
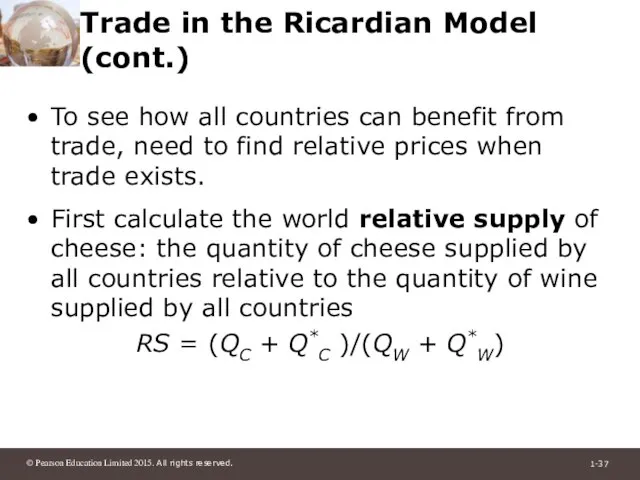
- 37. Trade in the Ricardian Model (cont.) To see how all countries can benefit from trade, need
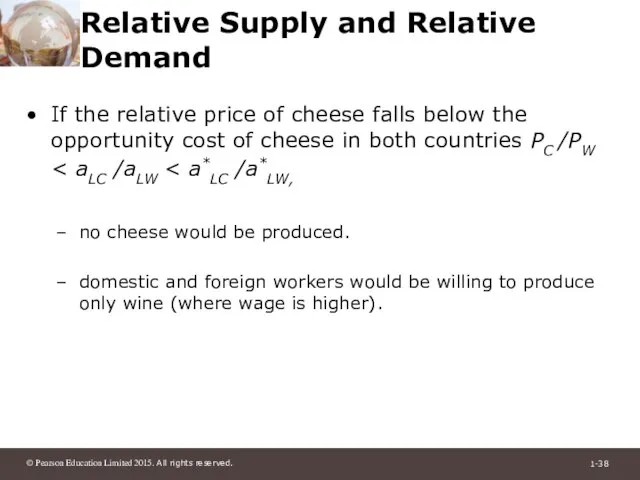
- 38. Relative Supply and Relative Demand If the relative price of cheese falls below the opportunity cost
- 39. Relative Supply and Relative Demand (cont.) When the relative price of cheese equals the opportunity cost
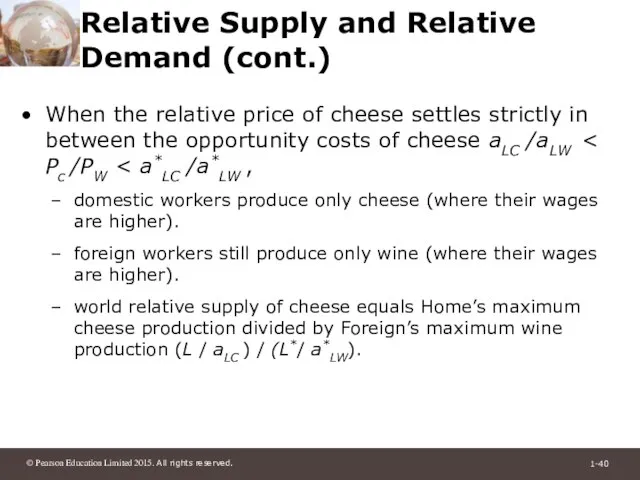
- 40. Relative Supply and Relative Demand (cont.) When the relative price of cheese settles strictly in between
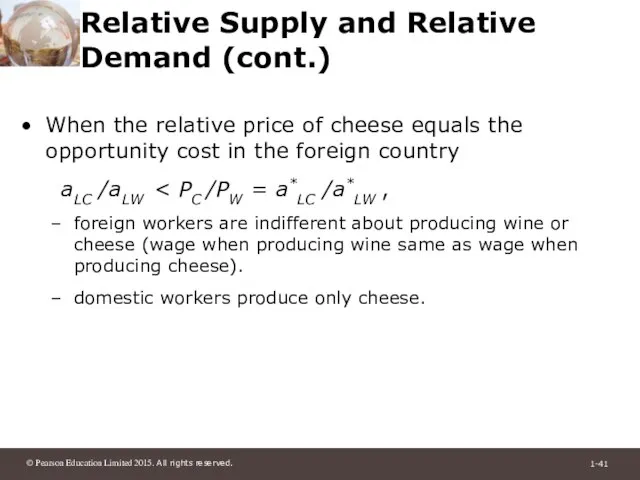
- 41. Relative Supply and Relative Demand (cont.) When the relative price of cheese equals the opportunity cost
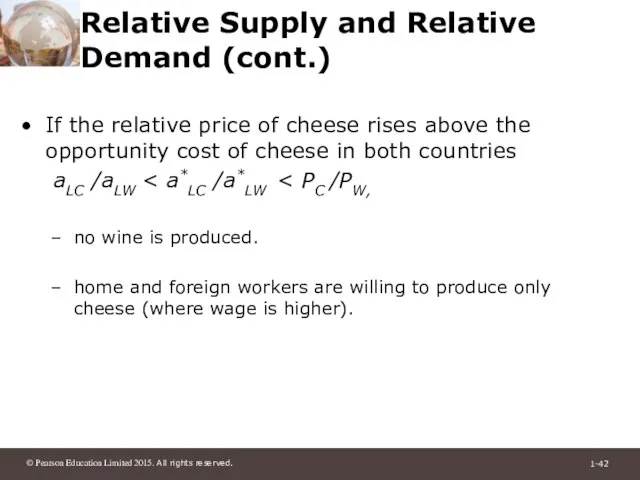
- 42. Relative Supply and Relative Demand (cont.) If the relative price of cheese rises above the opportunity
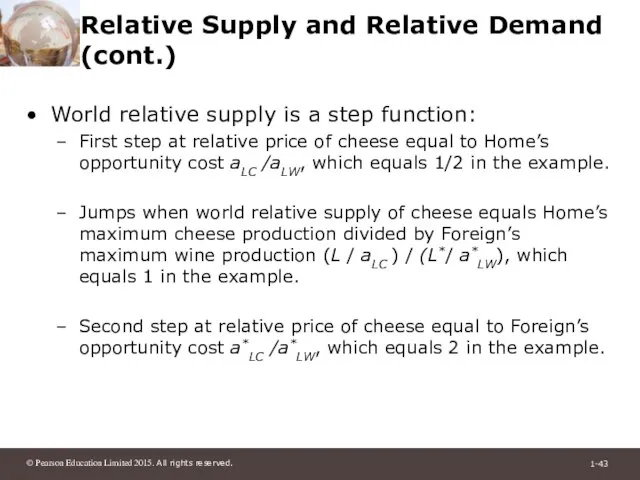
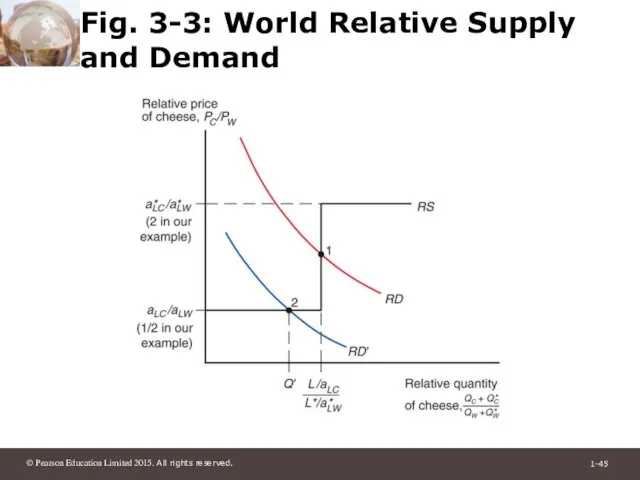
- 43. Relative Supply and Relative Demand (cont.) World relative supply is a step function: First step at
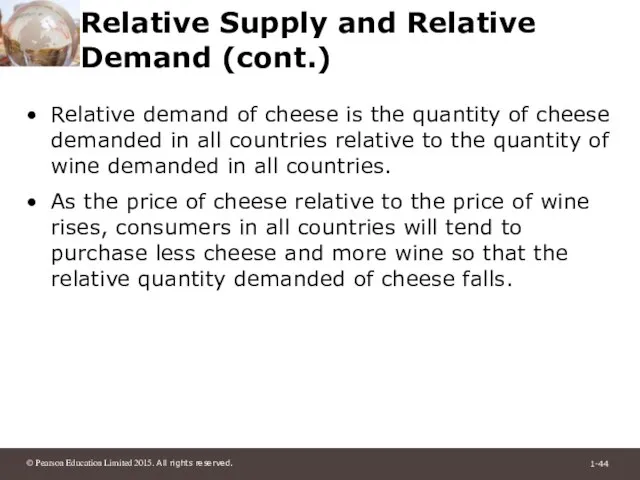
- 44. Relative Supply and Relative Demand (cont.) Relative demand of cheese is the quantity of cheese demanded
- 45. Fig. 3-3: World Relative Supply and Demand
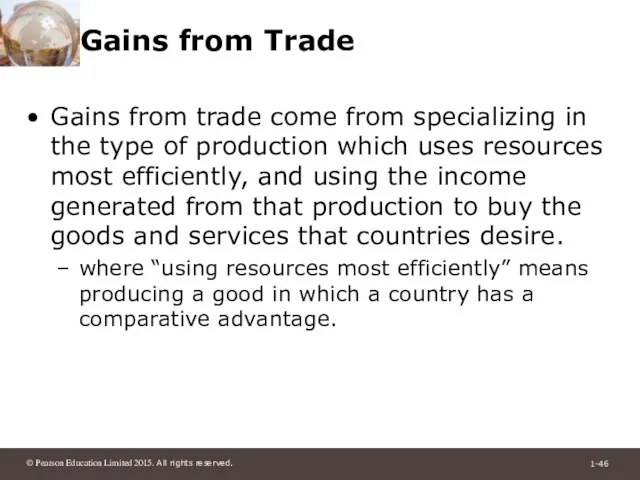
- 46. Gains from Trade Gains from trade come from specializing in the type of production which uses
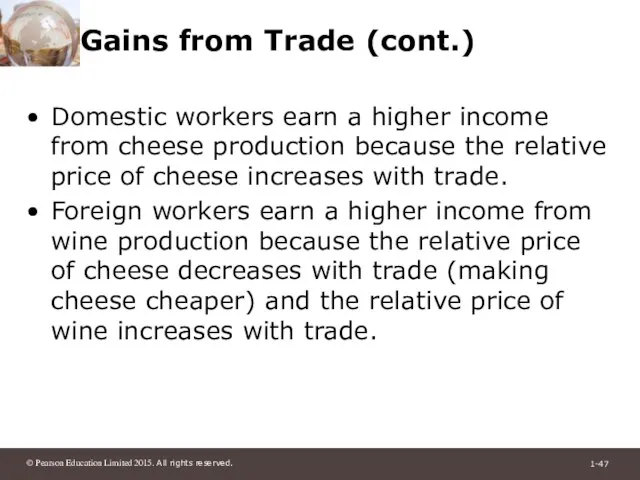
- 47. Gains from Trade (cont.) Domestic workers earn a higher income from cheese production because the relative
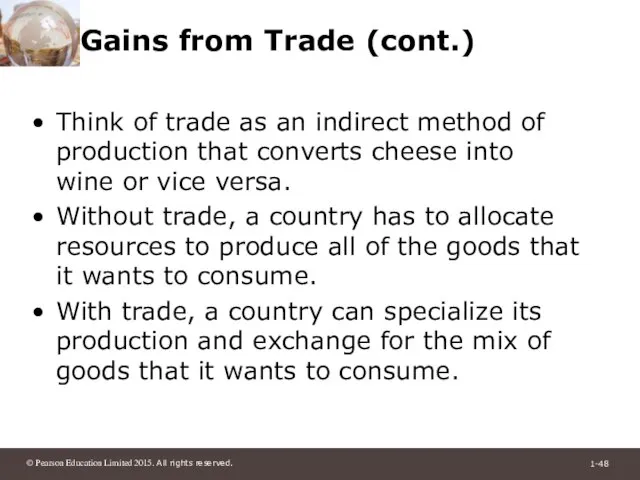
- 48. Gains from Trade (cont.) Think of trade as an indirect method of production that converts cheese
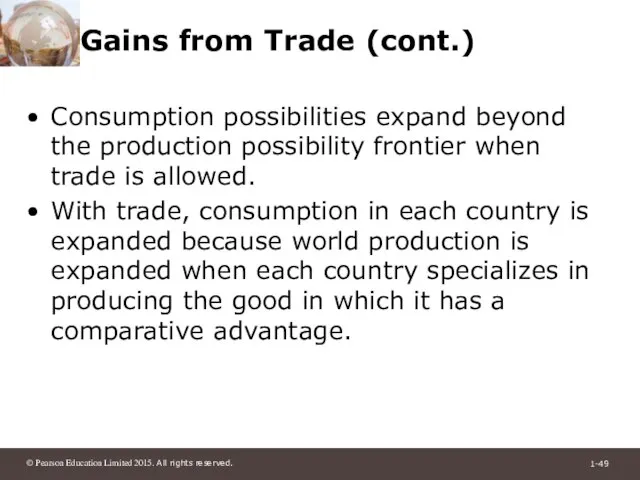
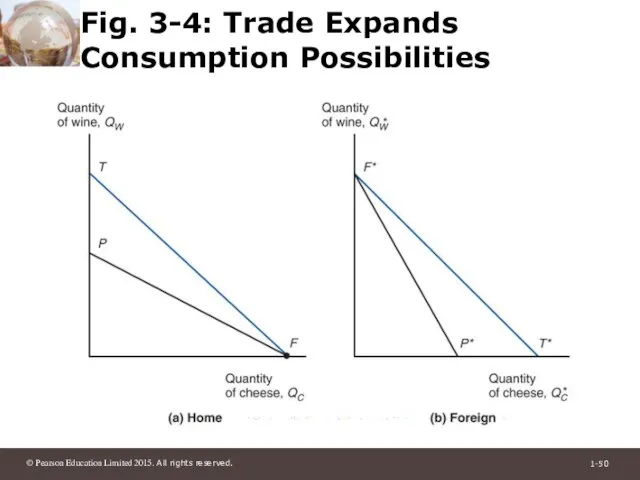
- 49. Gains from Trade (cont.) Consumption possibilities expand beyond the production possibility frontier when trade is allowed.
- 50. Fig. 3-4: Trade Expands Consumption Possibilities
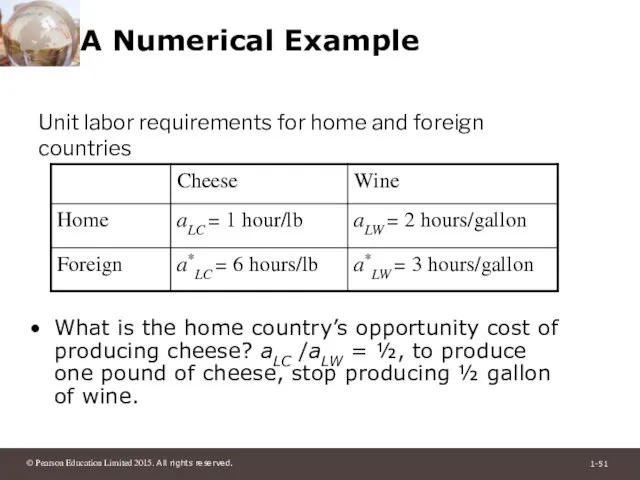
- 51. A Numerical Example What is the home country’s opportunity cost of producing cheese? aLC /aLW =
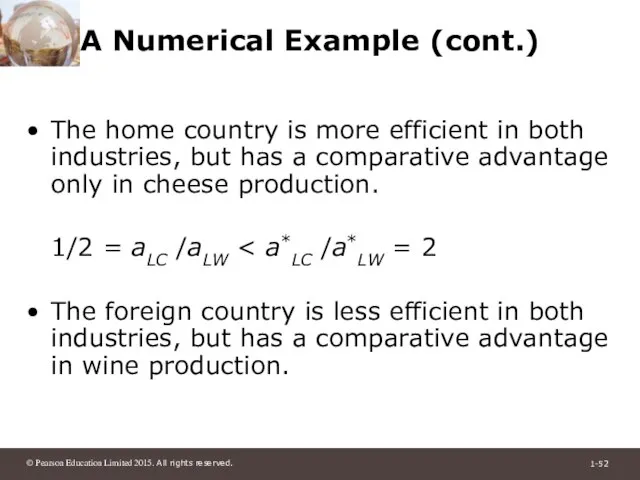
- 52. A Numerical Example (cont.) The home country is more efficient in both industries, but has a
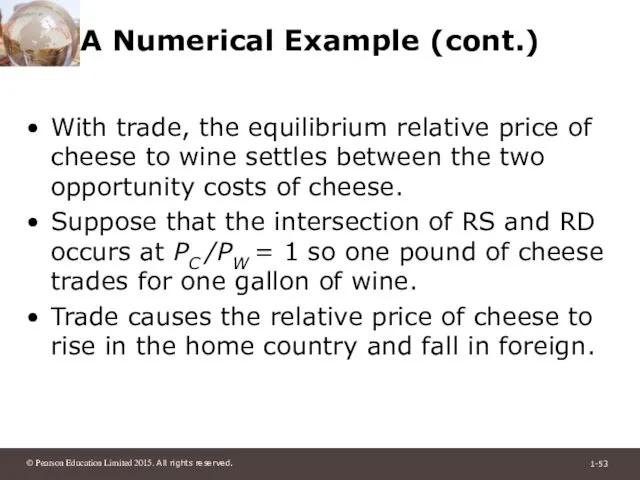
- 53. A Numerical Example (cont.) With trade, the equilibrium relative price of cheese to wine settles between
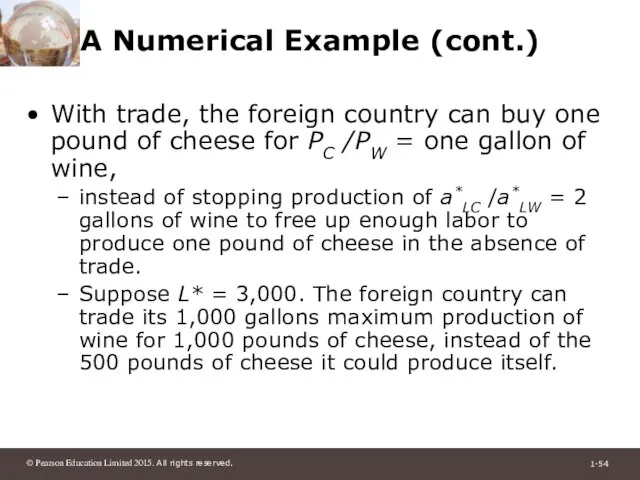
- 54. A Numerical Example (cont.) With trade, the foreign country can buy one pound of cheese for
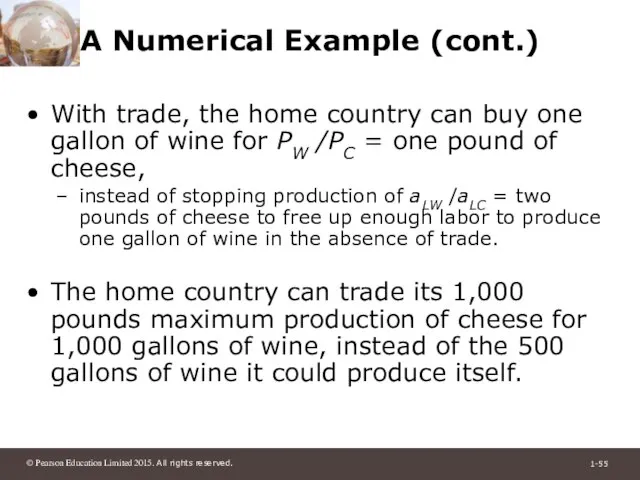
- 55. A Numerical Example (cont.) With trade, the home country can buy one gallon of wine for
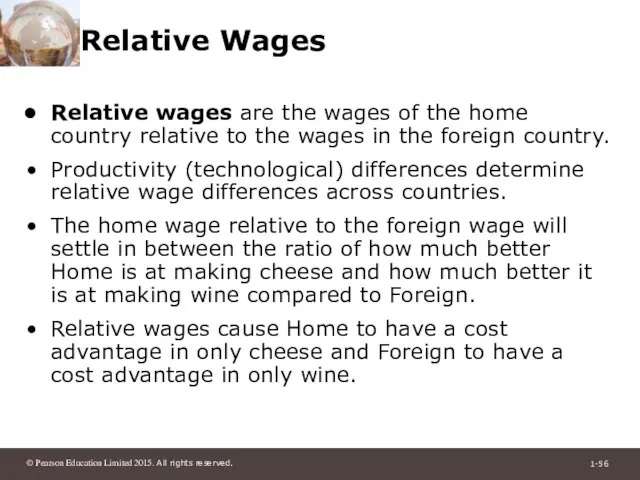
- 56. Relative Wages Relative wages are the wages of the home country relative to the wages in
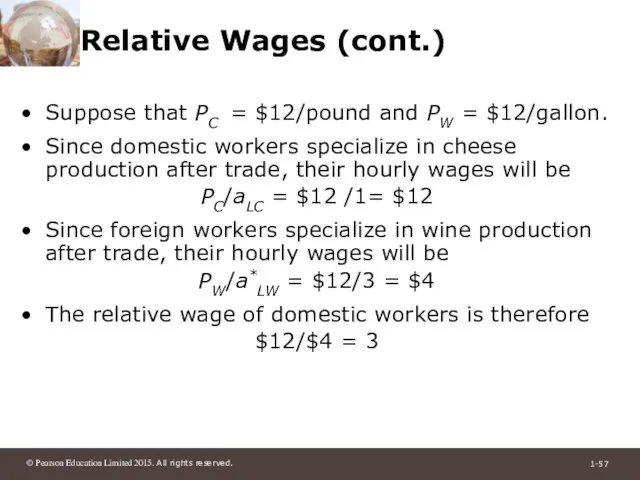
- 57. Relative Wages (cont.) Suppose that PC = $12/pound and PW = $12/gallon. Since domestic workers specialize
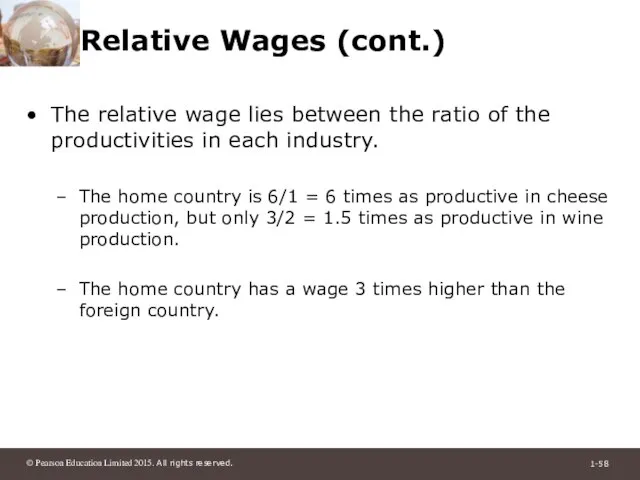
- 58. Relative Wages (cont.) The relative wage lies between the ratio of the productivities in each industry.
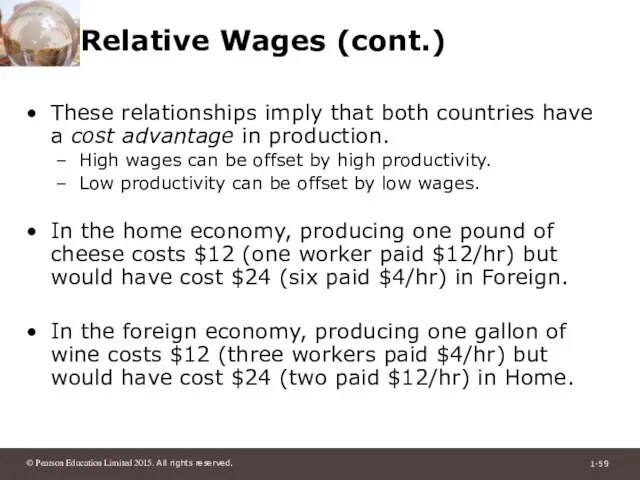
- 59. Relative Wages (cont.) These relationships imply that both countries have a cost advantage in production. High
- 60. Relative Wages (cont.) Because foreign workers have a wage that is only 1/3 the wage of
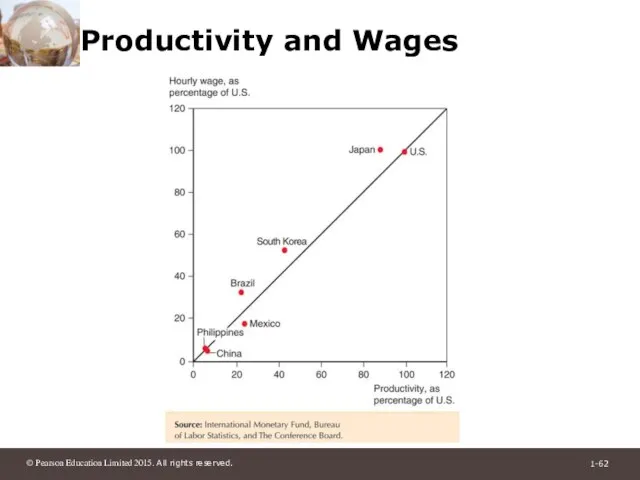
- 61. Do Wages Reflect Productivity? Do relative wages reflect relative productivities of the two countries? Evidence shows
- 62. Productivity and Wages
- 63. Do Wages Reflect Productivity? (cont.) Other evidence shows that wages rise as productivity rises. As recently
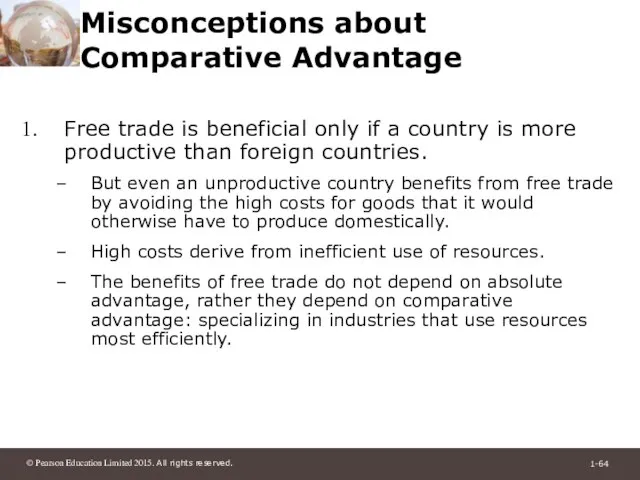
- 64. Misconceptions about Comparative Advantage Free trade is beneficial only if a country is more productive than
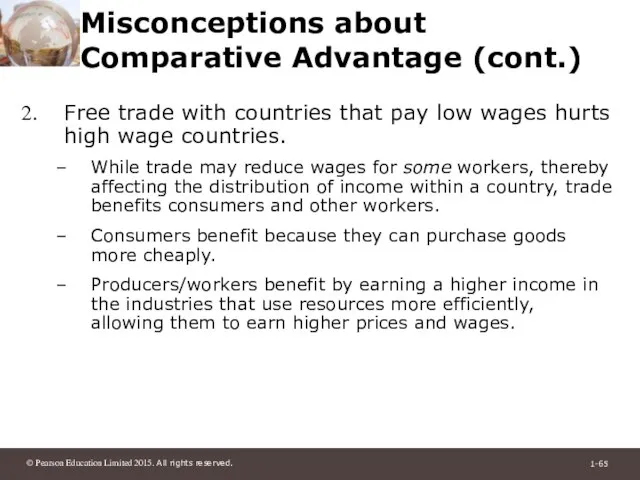
- 65. Misconceptions about Comparative Advantage (cont.) Free trade with countries that pay low wages hurts high wage
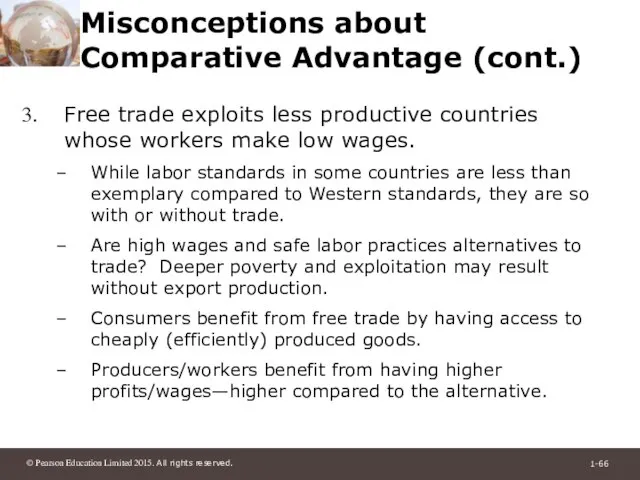
- 66. Misconceptions about Comparative Advantage (cont.) Free trade exploits less productive countries whose workers make low wages.
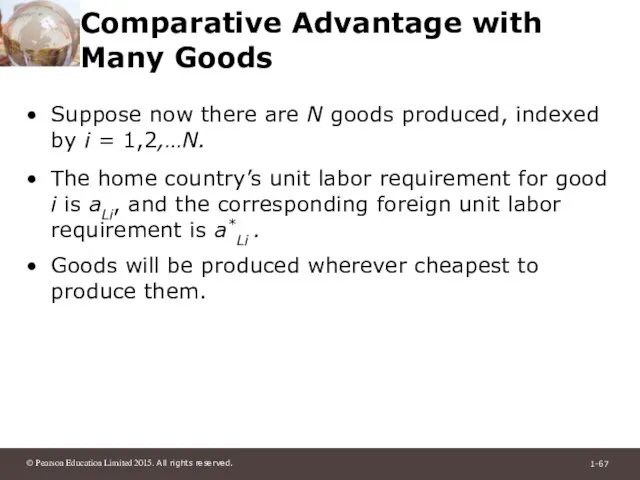
- 67. Comparative Advantage with Many Goods Suppose now there are N goods produced, indexed by i =
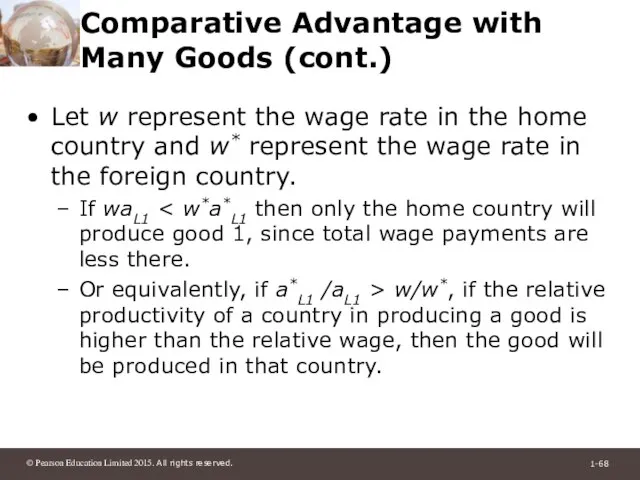
- 68. Comparative Advantage with Many Goods (cont.) Let w represent the wage rate in the home country
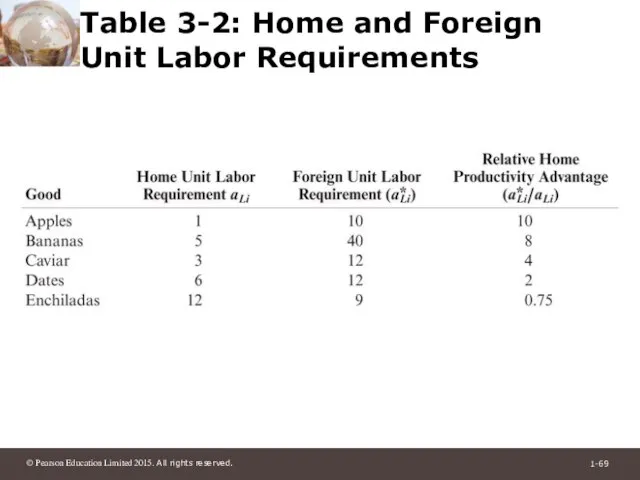
- 69. Table 3-2: Home and Foreign Unit Labor Requirements
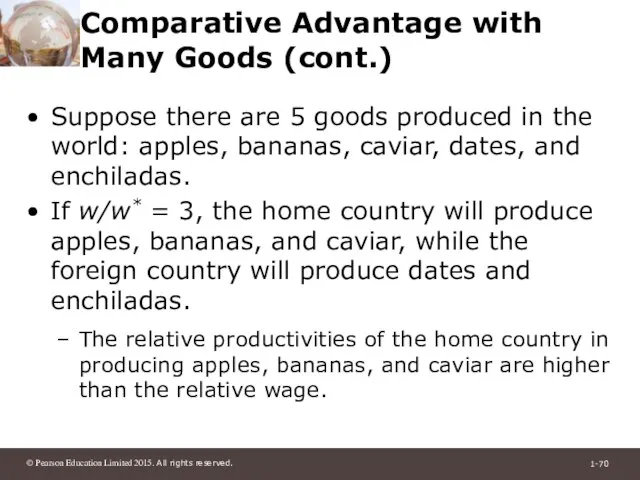
- 70. Comparative Advantage with Many Goods (cont.) Suppose there are 5 goods produced in the world: apples,
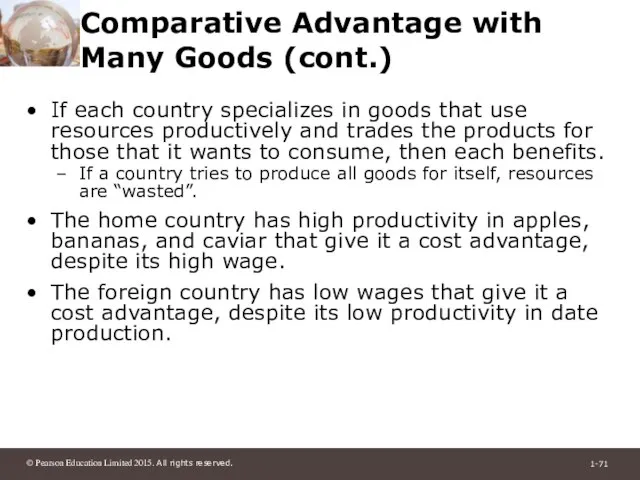
- 71. Comparative Advantage with Many Goods (cont.) If each country specializes in goods that use resources productively
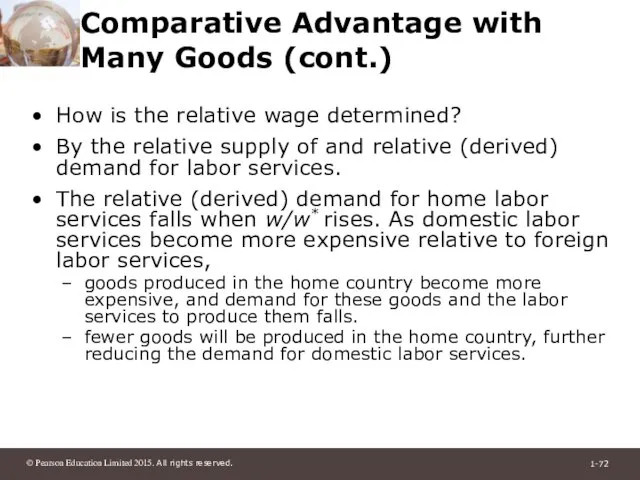
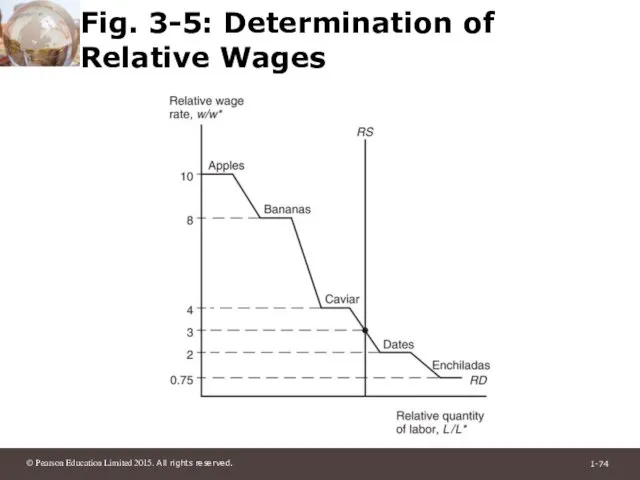
- 72. Comparative Advantage with Many Goods (cont.) How is the relative wage determined? By the relative supply
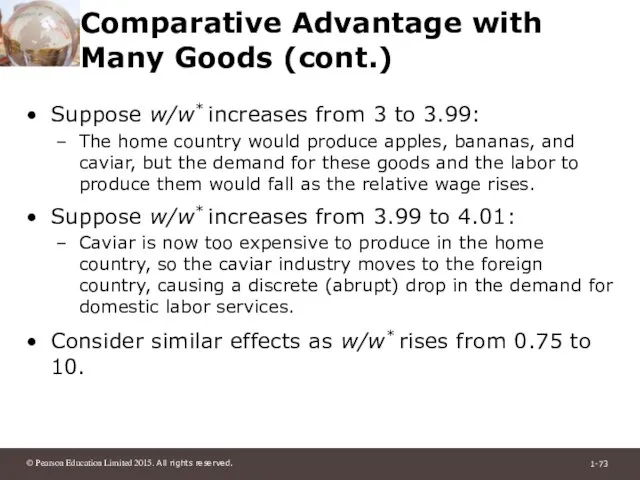
- 73. Comparative Advantage with Many Goods (cont.) Suppose w/w* increases from 3 to 3.99: The home country
- 74. Fig. 3-5: Determination of Relative Wages
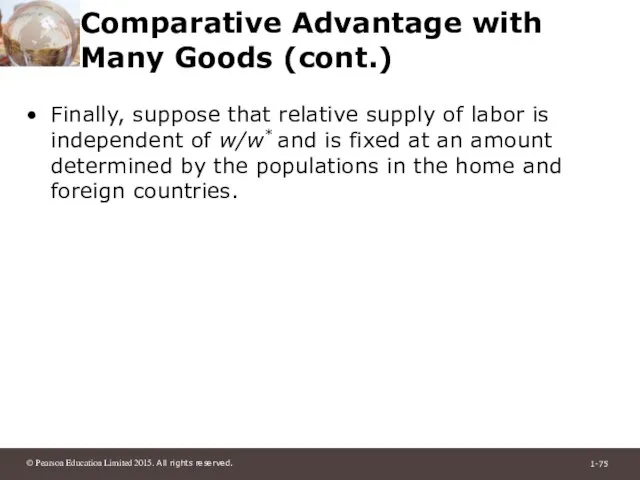
- 75. Comparative Advantage with Many Goods (cont.) Finally, suppose that relative supply of labor is independent of
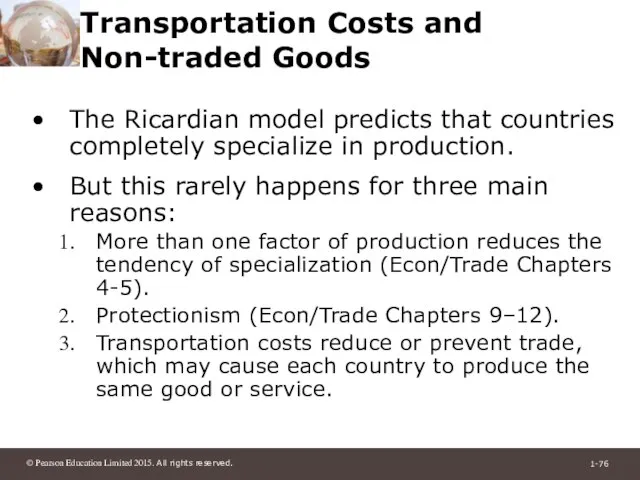
- 76. Transportation Costs and Non-traded Goods The Ricardian model predicts that countries completely specialize in production. But
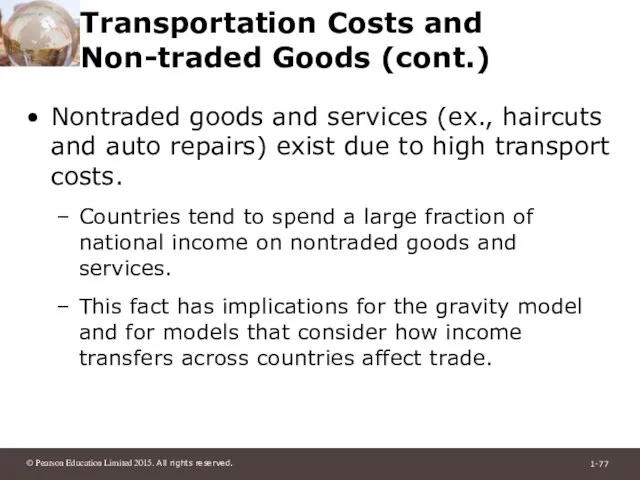
- 77. Transportation Costs and Non-traded Goods (cont.) Nontraded goods and services (ex., haircuts and auto repairs) exist
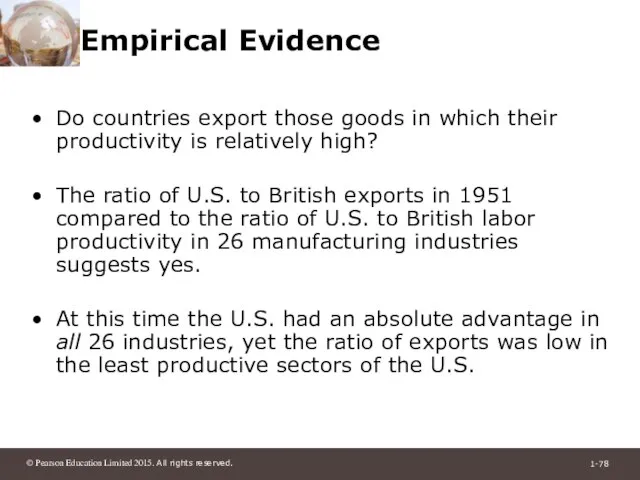
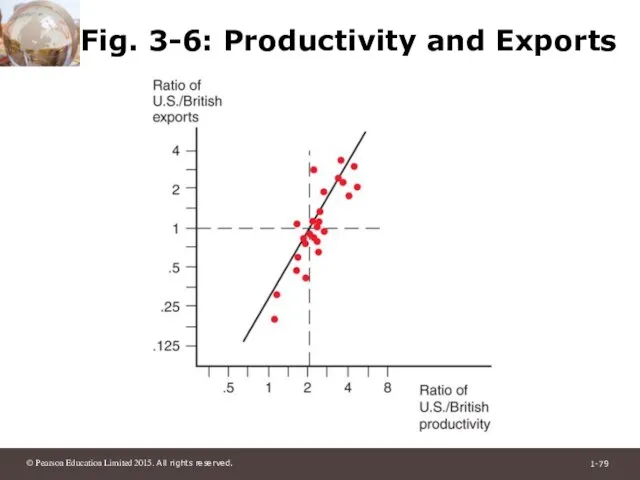
- 78. Empirical Evidence Do countries export those goods in which their productivity is relatively high? The ratio
- 79. Fig. 3-6: Productivity and Exports
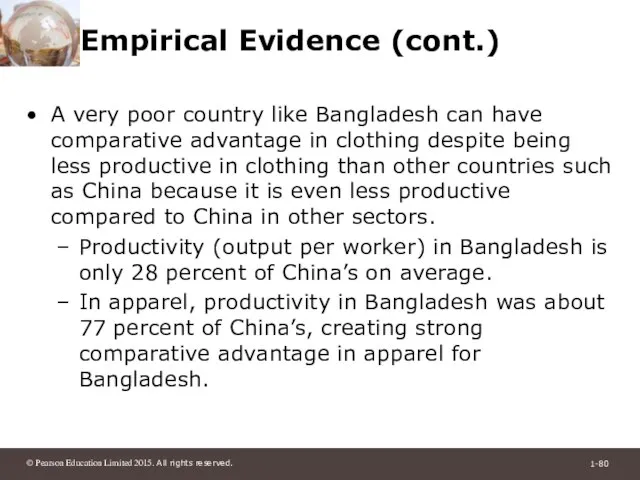
- 80. Empirical Evidence (cont.) A very poor country like Bangladesh can have comparative advantage in clothing despite
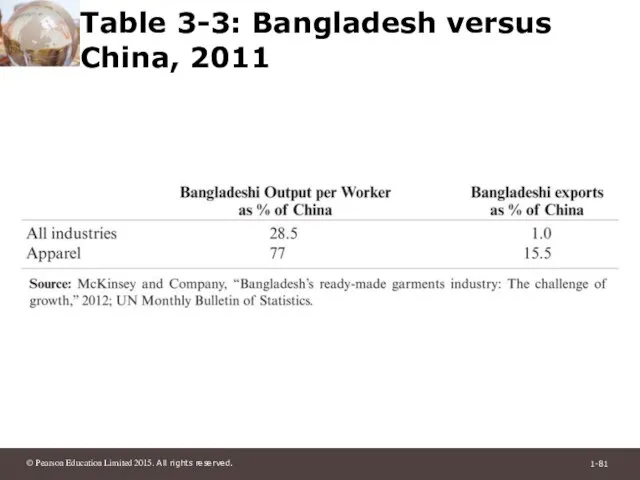
- 81. Table 3-3: Bangladesh versus China, 2011
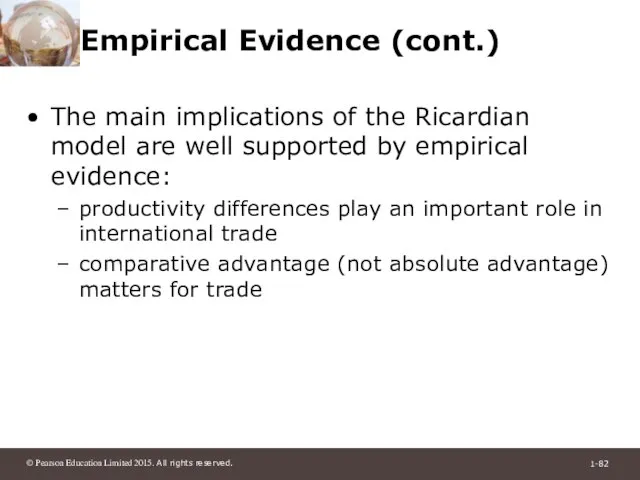
- 82. Empirical Evidence (cont.) The main implications of the Ricardian model are well supported by empirical evidence:
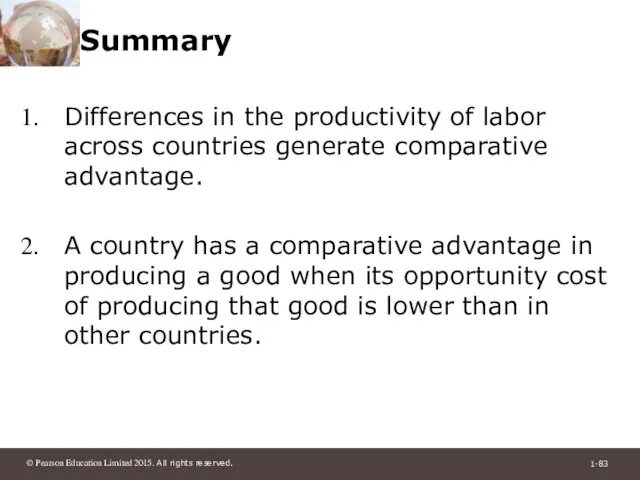
- 83. Summary Differences in the productivity of labor across countries generate comparative advantage. A country has a
- 84. Summary (cont.) Countries export goods in which they have a comparative advantage - high productivity or
- 86. Скачать презентацию
Слайд 2Preview
Opportunity costs and comparative advantage
A one-factor Ricardian model
Production possibilities
Gains from trade
Wages and
Preview
Opportunity costs and comparative advantage
A one-factor Ricardian model
Production possibilities
Gains from trade
Wages and
Слайд 3Introduction
Theories of why trade occurs:
Differences across countries in labor, labor skills, physical
Introduction
Theories of why trade occurs:
Differences across countries in labor, labor skills, physical

Слайд 4Introduction (cont.)
Sources of differences across countries that lead to gains from trade:
The
Introduction (cont.)
Sources of differences across countries that lead to gains from trade:
The
Слайд 5Comparative Advantage and Opportunity Cost
The Ricardian model uses the concepts of opportunity
Comparative Advantage and Opportunity Cost
The Ricardian model uses the concepts of opportunity
Слайд 6Comparative Advantage and Opportunity Cost (cont.)
For example, a limited number of workers
Comparative Advantage and Opportunity Cost (cont.)
For example, a limited number of workers
Слайд 7Comparative Advantage and Opportunity Cost (cont.)
Suppose that in the United States 10
Comparative Advantage and Opportunity Cost (cont.)
Suppose that in the United States 10
Слайд 8Comparative Advantage and Opportunity Cost (cont.)
A country has a comparative advantage in
Comparative Advantage and Opportunity Cost (cont.)
A country has a comparative advantage in
Слайд 9Comparative Advantage and Opportunity Cost (cont.)
Suppose initially that Colombia produces computers and
Comparative Advantage and Opportunity Cost (cont.)
Suppose initially that Colombia produces computers and
Слайд 10Table 3-1: Hypothetical Changes in Production
Table 3-1: Hypothetical Changes in Production
Слайд 11Comparative Advantage and Trade
When countries specialize in production in which they
Comparative Advantage and Trade
When countries specialize in production in which they
Слайд 12A One-Factor Ricardian Model
The simple example with roses and computers explains the
A One-Factor Ricardian Model
The simple example with roses and computers explains the

Слайд 13A One-Factor Ricardian Model (cont.)
Labor is the only factor of production.
Labor productivity
A One-Factor Ricardian Model (cont.)
Labor is the only factor of production.
Labor productivity
Слайд 14A One-Factor Ricardian Model (cont.)
Two goods: wine and cheese.
Competition allows workers to
A One-Factor Ricardian Model (cont.)
Two goods: wine and cheese.
Competition allows workers to
Слайд 15A One-Factor Ricardian Model (cont.)
A unit labor requirement indicates the constant number
A One-Factor Ricardian Model (cont.)
A unit labor requirement indicates the constant number
Слайд 16A One-Factor Ricardian Model (cont.)
Labor supply L indicates the total number of
A One-Factor Ricardian Model (cont.)
Labor supply L indicates the total number of
Слайд 17Production Possibilities
The production possibility frontier (PPF) of an economy shows the maximum
Production Possibilities
The production possibility frontier (PPF) of an economy shows the maximum
Слайд 18Production Possibilities (cont.)
Maximum home cheese production is
QC = L/aLC when QW =
Production Possibilities (cont.)
Maximum home cheese production is QC = L/aLC when QW =
Слайд 19Production Possibilities (cont.)
For example, suppose that the economy’s labor supply is 1,000
Production Possibilities (cont.)
For example, suppose that the economy’s labor supply is 1,000
Слайд 20Fig. 3-1: Home’s Production Possibility Frontier
Fig. 3-1: Home’s Production Possibility Frontier

Слайд 21Production Possibilities (cont.)
The opportunity cost of cheese is how many gallons of
Production Possibilities (cont.)
The opportunity cost of cheese is how many gallons of
Слайд 22Production Possibilities (cont.)
Producing an additional pound of cheese requires aLC hours of
Production Possibilities (cont.)
Producing an additional pound of cheese requires aLC hours of
Слайд 23Production Possibilities (cont.)
For example, if 1 hour of labor is moved to
Production Possibilities (cont.)
For example, if 1 hour of labor is moved to
Слайд 24Relative Prices, Wages, and Supply
Let PC be the price of cheese and
Relative Prices, Wages, and Supply
Let PC be the price of cheese and
Слайд 25Relative Prices, Wages, and Supply (cont.)
If the price of cheese relative to
Relative Prices, Wages, and Supply (cont.)
If the price of cheese relative to
Слайд 26Relative Prices, Wages, and Supply (cont.)
If the price of cheese relative to
Relative Prices, Wages, and Supply (cont.)
If the price of cheese relative to
Слайд 27Production, Prices, and Wages
If the price of cheese relative to the price
Production, Prices, and Wages
If the price of cheese relative to the price
Слайд 28Production, Prices, and Wages (cont.)
For example, suppose cheese sells for PC =
Production, Prices, and Wages (cont.)
For example, suppose cheese sells for PC =
Слайд 29Production, Prices, and Wages (cont.)
If the price of cheese drops to PC
Production, Prices, and Wages (cont.)
If the price of cheese drops to PC
Слайд 30Production, Prices, and Wages (cont.)
If the home country wants to consume both
Production, Prices, and Wages (cont.)
If the home country wants to consume both
Слайд 31Trade in the Ricardian Model
If the home country is more efficient in
Trade in the Ricardian Model
If the home country is more efficient in
Слайд 32Trade in the Ricardian Model (cont.)
A country can be more efficient in
Trade in the Ricardian Model (cont.)
A country can be more efficient in
Слайд 33Trade in the Ricardian Model (cont.)
Suppose that the home country has a
Trade in the Ricardian Model (cont.)
Suppose that the home country has a
Слайд 34Trade in the Ricardian Model (cont.)
Since the slope of the PPF indicates
Trade in the Ricardian Model (cont.)
Since the slope of the PPF indicates
Слайд 35Fig. 3-2: Foreign’s Production Possibility Frontier
Fig. 3-2: Foreign’s Production Possibility Frontier
Слайд 36Trade in the Ricardian Model (cont.)
Before any trade occurs, the relative price
Trade in the Ricardian Model (cont.)
Before any trade occurs, the relative price
Слайд 37Trade in the Ricardian Model (cont.)
To see how all countries can benefit
Trade in the Ricardian Model (cont.)
To see how all countries can benefit
Слайд 38Relative Supply and Relative Demand
If the relative price of cheese falls below
Relative Supply and Relative Demand
If the relative price of cheese falls below
Слайд 39Relative Supply and Relative Demand (cont.)
When the relative price of cheese equals
Relative Supply and Relative Demand (cont.)
When the relative price of cheese equals

Слайд 40Relative Supply and Relative Demand (cont.)
When the relative price of cheese settles
Relative Supply and Relative Demand (cont.)
When the relative price of cheese settles
Слайд 41Relative Supply and Relative Demand (cont.)
When the relative price of cheese equals
Relative Supply and Relative Demand (cont.)
When the relative price of cheese equals
Слайд 42Relative Supply and Relative Demand (cont.)
If the relative price of cheese rises
Relative Supply and Relative Demand (cont.)
If the relative price of cheese rises
Слайд 43Relative Supply and Relative Demand (cont.)
World relative supply is a step function:
First
Relative Supply and Relative Demand (cont.)
World relative supply is a step function:
First
Слайд 44Relative Supply and Relative Demand (cont.)
Relative demand of cheese is the quantity
Relative Supply and Relative Demand (cont.)
Relative demand of cheese is the quantity
Слайд 45Fig. 3-3: World Relative Supply and Demand
Fig. 3-3: World Relative Supply and Demand
Слайд 46Gains from Trade
Gains from trade come from specializing in the type of
Gains from Trade
Gains from trade come from specializing in the type of
Слайд 47Gains from Trade (cont.)
Domestic workers earn a higher income from cheese production
Gains from Trade (cont.)
Domestic workers earn a higher income from cheese production
Слайд 48Gains from Trade (cont.)
Think of trade as an indirect method of production
Gains from Trade (cont.)
Think of trade as an indirect method of production
Слайд 49Gains from Trade (cont.)
Consumption possibilities expand beyond the production possibility frontier when
Gains from Trade (cont.)
Consumption possibilities expand beyond the production possibility frontier when
Слайд 50Fig. 3-4: Trade Expands Consumption Possibilities
Fig. 3-4: Trade Expands Consumption Possibilities
Слайд 51A Numerical Example
What is the home country’s opportunity cost of producing cheese?
A Numerical Example
What is the home country’s opportunity cost of producing cheese?
Слайд 52A Numerical Example (cont.)
The home country is more efficient in both industries,
A Numerical Example (cont.)
The home country is more efficient in both industries,
Слайд 53A Numerical Example (cont.)
With trade, the equilibrium relative price of cheese to
A Numerical Example (cont.)
With trade, the equilibrium relative price of cheese to
Слайд 54A Numerical Example (cont.)
With trade, the foreign country can buy one pound
A Numerical Example (cont.)
With trade, the foreign country can buy one pound
Слайд 55A Numerical Example (cont.)
With trade, the home country can buy one gallon
A Numerical Example (cont.)
With trade, the home country can buy one gallon
Слайд 56Relative Wages
Relative wages are the wages of the home country relative to
Relative Wages
Relative wages are the wages of the home country relative to
Слайд 57Relative Wages (cont.)
Suppose that PC = $12/pound and PW = $12/gallon.
Since domestic
Relative Wages (cont.)
Suppose that PC = $12/pound and PW = $12/gallon.
Since domestic
Слайд 58Relative Wages (cont.)
The relative wage lies between the ratio of the productivities
Relative Wages (cont.)
The relative wage lies between the ratio of the productivities
Слайд 59Relative Wages (cont.)
These relationships imply that both countries have a cost advantage
Relative Wages (cont.)
These relationships imply that both countries have a cost advantage
Слайд 60Relative Wages (cont.)
Because foreign workers have a wage that is only 1/3
Relative Wages (cont.)
Because foreign workers have a wage that is only 1/3
Слайд 61Do Wages Reflect Productivity?
Do relative wages reflect relative productivities of the two
Do Wages Reflect Productivity?
Do relative wages reflect relative productivities of the two

Слайд 62Productivity and Wages
Productivity and Wages
Слайд 63Do Wages Reflect Productivity? (cont.)
Other evidence shows that wages rise as productivity
Do Wages Reflect Productivity? (cont.)
Other evidence shows that wages rise as productivity

Слайд 64Misconceptions about Comparative Advantage
Free trade is beneficial only if a country is
Misconceptions about Comparative Advantage
Free trade is beneficial only if a country is
Слайд 65Misconceptions about Comparative Advantage (cont.)
Free trade with countries that pay low wages
Misconceptions about Comparative Advantage (cont.)
Free trade with countries that pay low wages
Слайд 66Misconceptions about Comparative Advantage (cont.)
Free trade exploits less productive countries whose workers
Misconceptions about Comparative Advantage (cont.)
Free trade exploits less productive countries whose workers
Слайд 67Comparative Advantage with Many Goods
Suppose now there are N goods produced, indexed
Comparative Advantage with Many Goods
Suppose now there are N goods produced, indexed
Слайд 68Comparative Advantage with Many Goods (cont.)
Let w represent the wage rate in
Comparative Advantage with Many Goods (cont.)
Let w represent the wage rate in
Слайд 69Table 3-2: Home and Foreign Unit Labor Requirements
Table 3-2: Home and Foreign Unit Labor Requirements
Слайд 70Comparative Advantage with Many Goods (cont.)
Suppose there are 5 goods produced in
Comparative Advantage with Many Goods (cont.)
Suppose there are 5 goods produced in
Слайд 71Comparative Advantage with Many Goods (cont.)
If each country specializes in goods that
Comparative Advantage with Many Goods (cont.)
If each country specializes in goods that
Слайд 72Comparative Advantage with Many Goods (cont.)
How is the relative wage determined?
By the
Comparative Advantage with Many Goods (cont.)
How is the relative wage determined?
By the
Слайд 73Comparative Advantage with Many Goods (cont.)
Suppose w/w* increases from 3 to 3.99:
The
Comparative Advantage with Many Goods (cont.)
Suppose w/w* increases from 3 to 3.99:
The
Слайд 74Fig. 3-5: Determination of Relative Wages
Fig. 3-5: Determination of Relative Wages
Слайд 75Comparative Advantage with Many Goods (cont.)
Finally, suppose that relative supply of labor
Comparative Advantage with Many Goods (cont.)
Finally, suppose that relative supply of labor
Слайд 76Transportation Costs and Non-traded Goods
The Ricardian model predicts that countries completely specialize
Transportation Costs and Non-traded Goods
The Ricardian model predicts that countries completely specialize
Слайд 77Transportation Costs and Non-traded Goods (cont.)
Nontraded goods and services (ex., haircuts and
Transportation Costs and Non-traded Goods (cont.)
Nontraded goods and services (ex., haircuts and
Слайд 78Empirical Evidence
Do countries export those goods in which their productivity is relatively
Empirical Evidence
Do countries export those goods in which their productivity is relatively
Слайд 79Fig. 3-6: Productivity and Exports
Fig. 3-6: Productivity and Exports
Слайд 80Empirical Evidence (cont.)
A very poor country like Bangladesh can have comparative advantage
Empirical Evidence (cont.)
A very poor country like Bangladesh can have comparative advantage
Слайд 81Table 3-3: Bangladesh versus China, 2011
Table 3-3: Bangladesh versus China, 2011
Слайд 82Empirical Evidence (cont.)
The main implications of the Ricardian model are well supported
Empirical Evidence (cont.)
The main implications of the Ricardian model are well supported
Слайд 83Summary
Differences in the productivity of labor across countries generate comparative advantage.
A country
Summary
Differences in the productivity of labor across countries generate comparative advantage.
A country
Слайд 84Summary (cont.)
Countries export goods in which they have a comparative advantage -
Summary (cont.)
Countries export goods in which they have a comparative advantage -
 TOURISM Презентація круглого столу
 Место и роль международных корпораций в международной мировой экономике на примере Kraft Foods
  Основные вопросы экономики и экономические системы
 Tourisme en France
 Политика защиты интеллектуальной собственности в Японии, её особенности и влияние на экономику страны
 Антимонопольное регулирование
 Контрольные вопросы
 Белый дом предупреждает об осторожности при инвестировании в Китай
 Экономика предприятия (фирмы)
 Европейски фонд за регионално развитие. Оперативная програма
 فرمت-جديد-گزارش-دهي-شهرسازي-(1) قدیم(1)
 Развитие экономики Республики Казахстан
 Рынок
Рынок Экспресс – подготовка к ГИА, ЕГЭ
 Хозяйственная специализация государств, обусловленная природно-географическими факторами
 Глобальные проблемы человечества
 Рыночное равновесие
 ОБЩЕСТВО
 Основные фонды предприятия
 Первобытное хозяйство
 Товарная биржа
 Механизм ценообразования. Законы спроса и предложения. Тест
 Get 90% Singapore Visa Success
 Новая экономическая политика (НЭП)
 презентация по теме классификация персонала и производительность труда-1
 Економіка в системі просторових координат біосфери
 Вторичный рынок ценных бумаг
 Типы экономических систем