Assessment of vegetation diversity of the North-Eastern forests in Kostroma region. Upscaling vegetation data from forest-stand to regional level
- Assessment of vegetation diversity of the North-Eastern forests in Kostroma region. Upscaling vegetation data from forest-stand to regional level

Содержание
- 2. Structure of the computer information-analytical system Программы обработки и анализа Геоинформационная система Первичные базы данных Геоботанические
- 3. Базы первичных данных демографические данные таксационные описания геоботанические описания Справочные базы данных типы популяционного поведения Программы
- 4. Steps of vegetation sample plots data proceeding to assess vegetation diversity at forest-stand level 1) расчет
- 5. Number of vegetation sample plots in different forest types at the North-East of Kostroma region
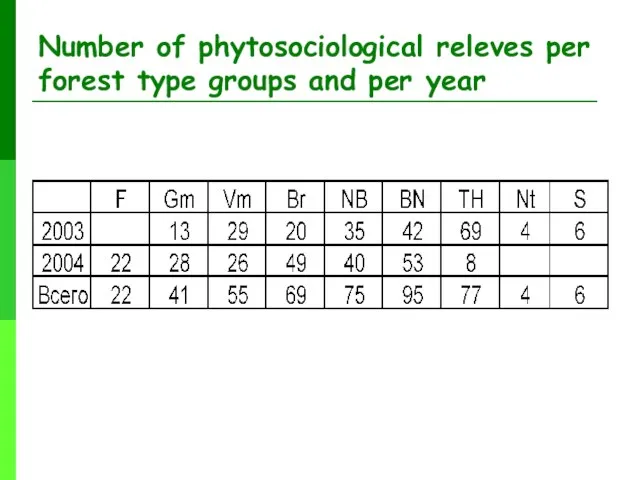
- 6. Number of phytosociological releves per forest type groups and per year
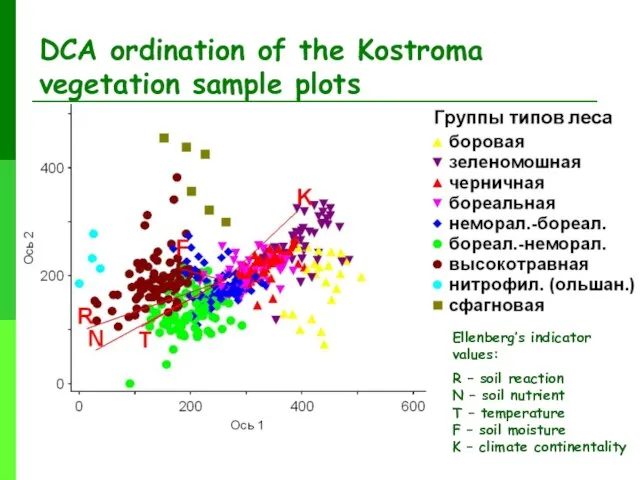
- 7. DCA ordination of the Kostroma vegetation sample plots Ellenberg’s indicator values: R – soil reaction N
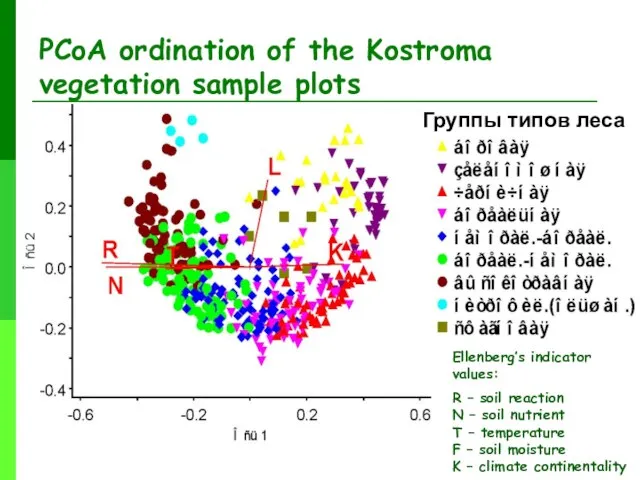
- 8. PCoA ordination of the Kostroma vegetation sample plots Группы типов леса Ellenberg’s indicator values: R –
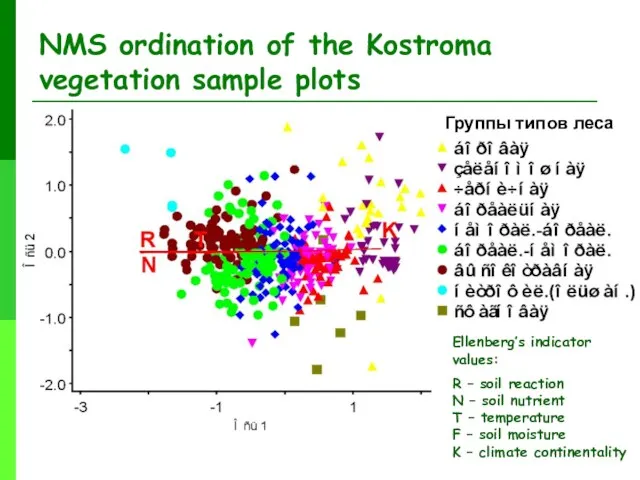
- 9. NMS ordination of the Kostroma vegetation sample plots Группы типов леса Ellenberg’s indicator values: R –
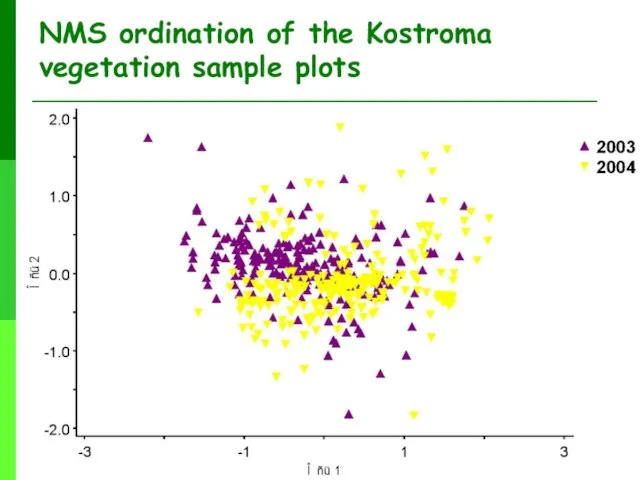
- 10. NMS ordination of the Kostroma vegetation sample plots
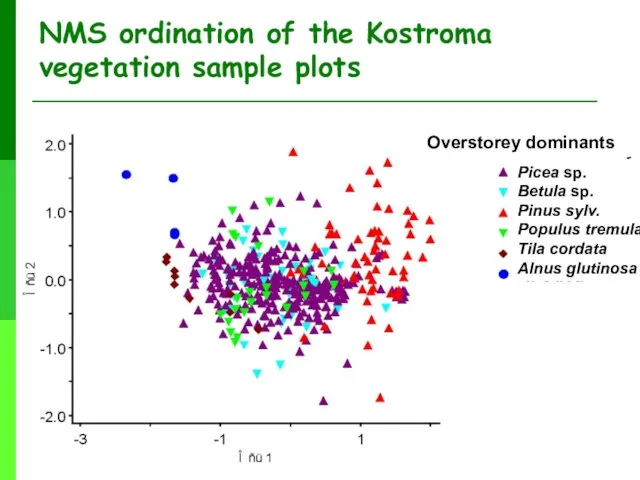
- 11. NMS ordination of the Kostroma vegetation sample plots Overstorey dominants Picea sp. Betula sp. Pinus sylv.
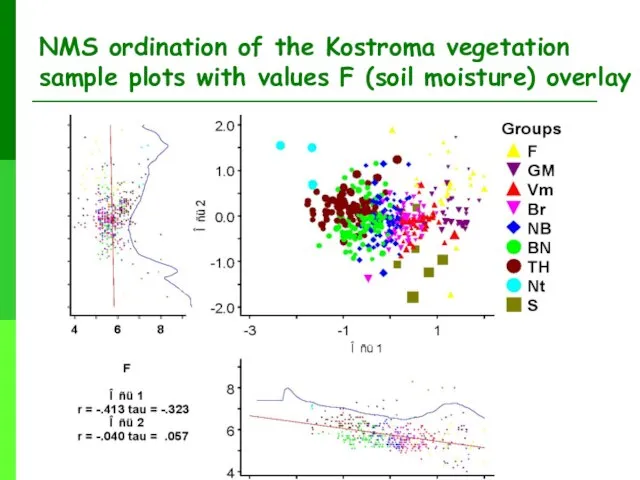
- 12. NMS ordination of the Kostroma vegetation sample plots with values F (soil moisture) overlay
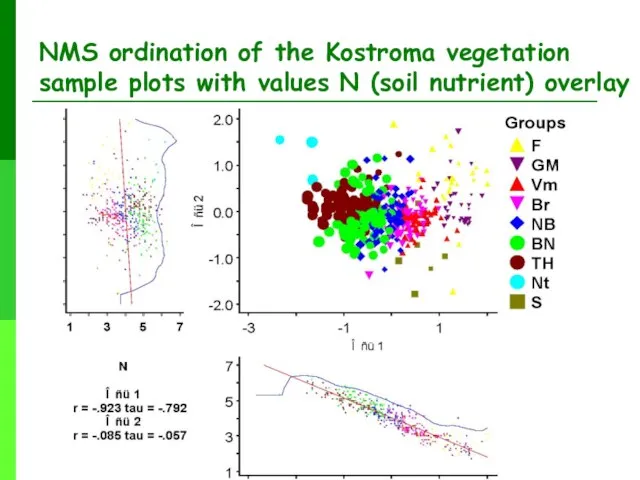
- 13. NMS ordination of the Kostroma vegetation sample plots with values N (soil nutrient) overlay
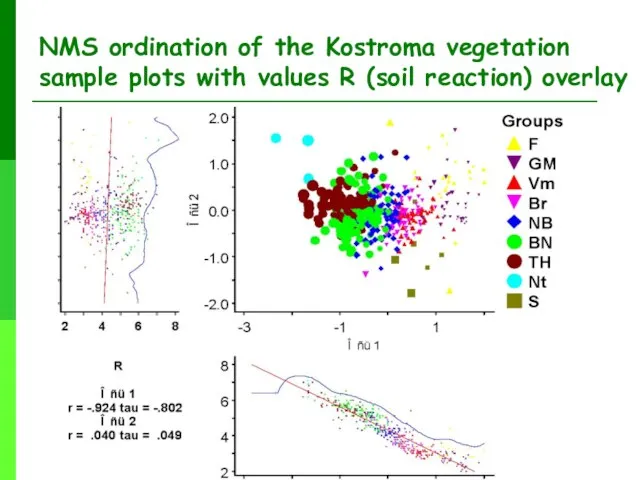
- 14. NMS ordination of the Kostroma vegetation sample plots with values R (soil reaction) overlay
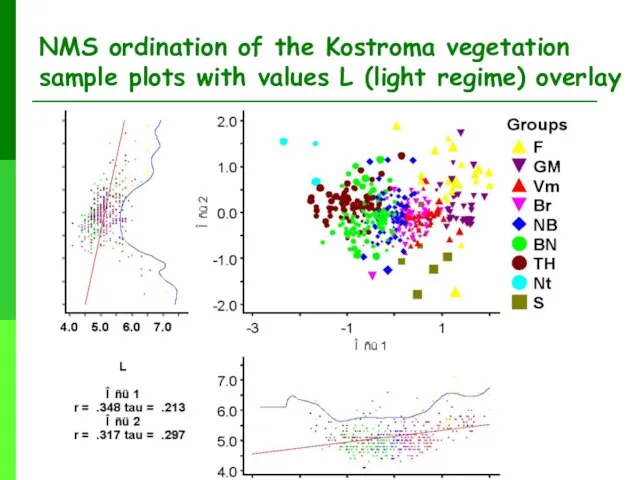
- 15. NMS ordination of the Kostroma vegetation sample plots with values L (light regime) overlay
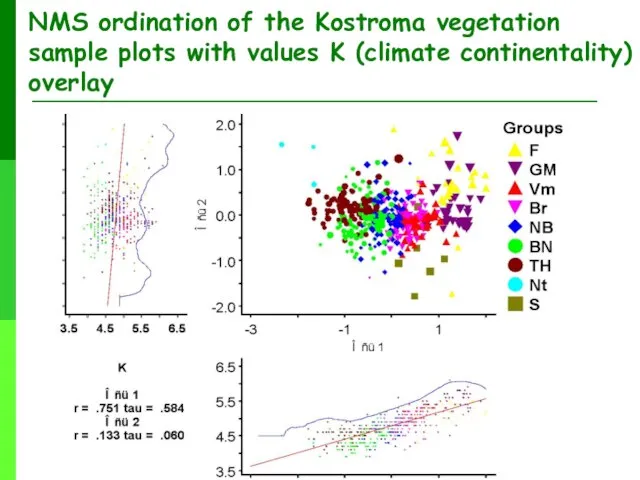
- 16. NMS ordination of the Kostroma vegetation sample plots with values K (climate continentality) overlay
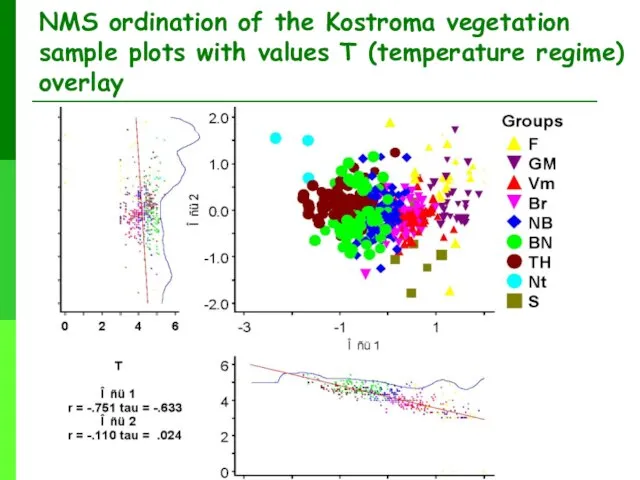
- 17. NMS ordination of the Kostroma vegetation sample plots with values T (temperature regime) overlay
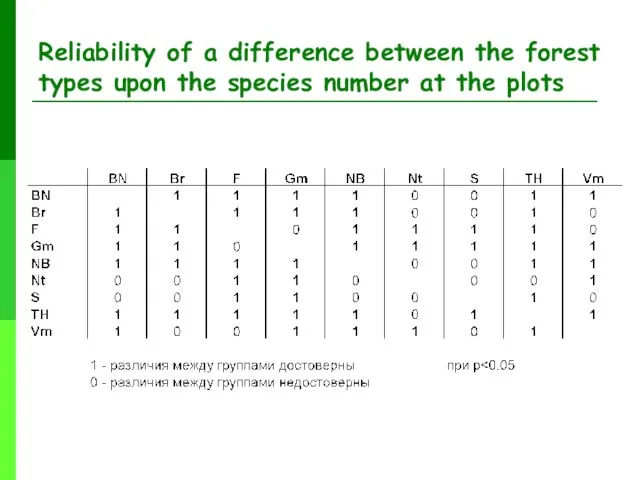
- 18. Reliability of a difference between the forest types upon the species number at the plots
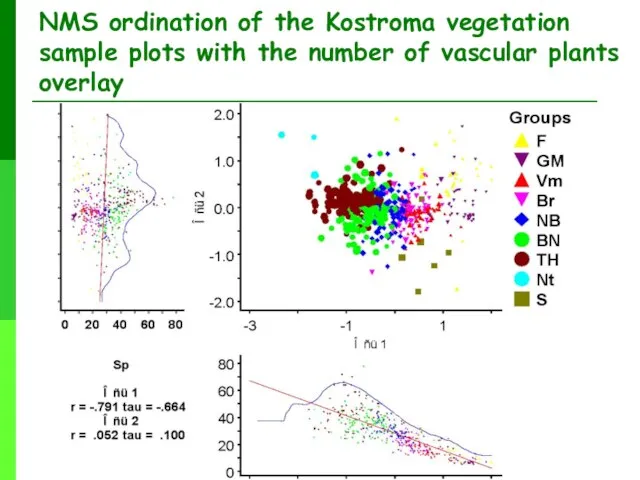
- 19. NMS ordination of the Kostroma vegetation sample plots with the number of vascular plants overlay
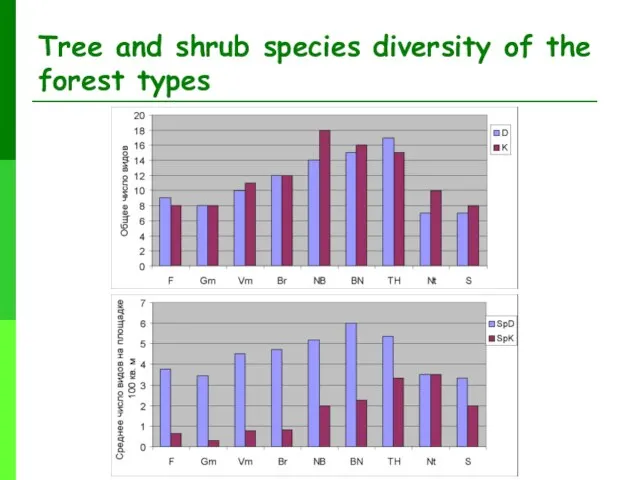
- 20. Tree and shrub species diversity of the forest types
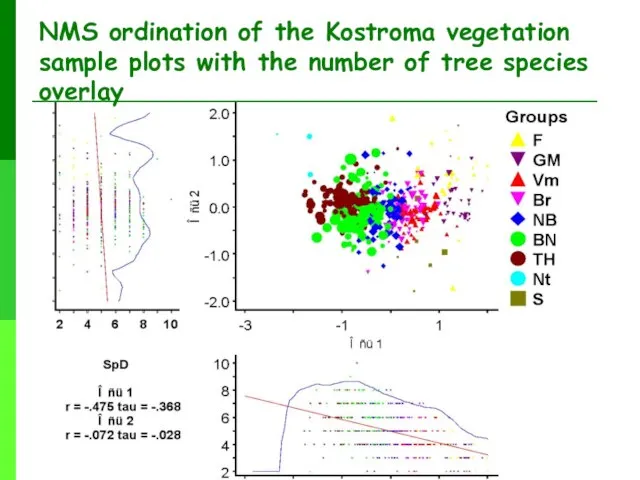
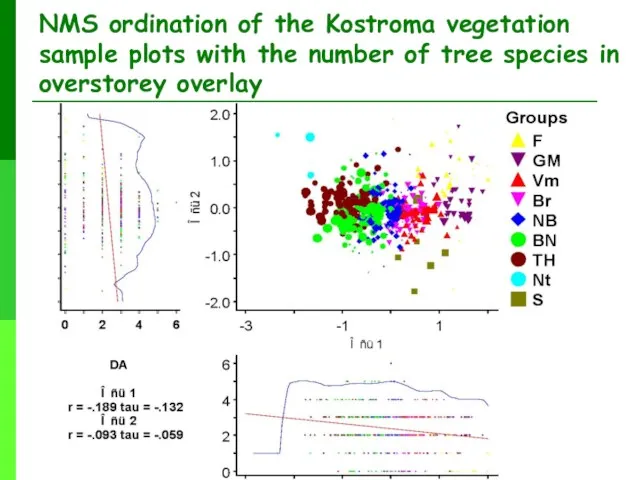
- 21. NMS ordination of the Kostroma vegetation sample plots with the number of tree species overlay
- 22. NMS ordination of the Kostroma vegetation sample plots with the number of tree species in overstorey
- 23. NMS ordination of the Kostroma vegetation sample plots with the number of shrub species overlay
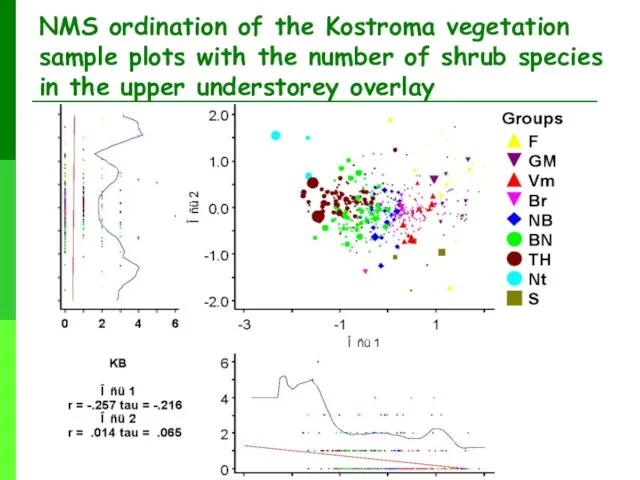
- 24. NMS ordination of the Kostroma vegetation sample plots with the number of shrub species in the
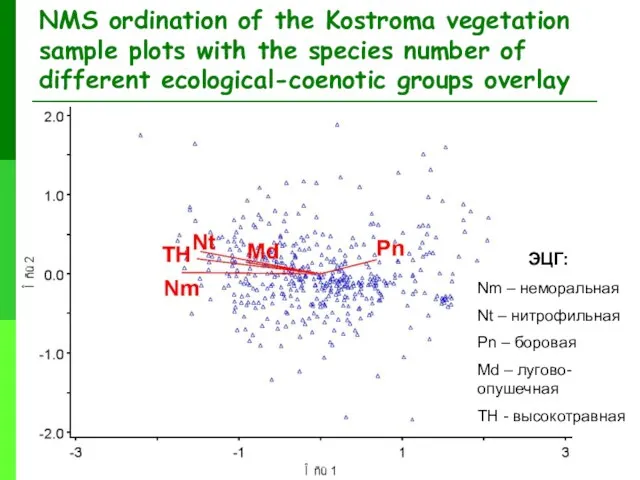
- 25. NMS ordination of the Kostroma vegetation sample plots with the species number of different ecological-coenotic groups
- 26. NMS ordination of the Kostroma vegetation sample plots with the number of boreal species overlay
- 27. NMS ordination of the Kostroma vegetation sample plots with the number of nemoral species overlay
- 28. NMS ordination of the Kostroma vegetation sample plots with the number of nitrophilous species overlay
- 29. NMS ordination of the Kostroma vegetation sample plots with the number of piny species overlay
- 30. NMS ordination of the Kostroma vegetation sample plots with the number of meadow species overlay
- 31. NMS ordination of the Kostroma vegetation sample plots with the number of oligotrophic species overlay
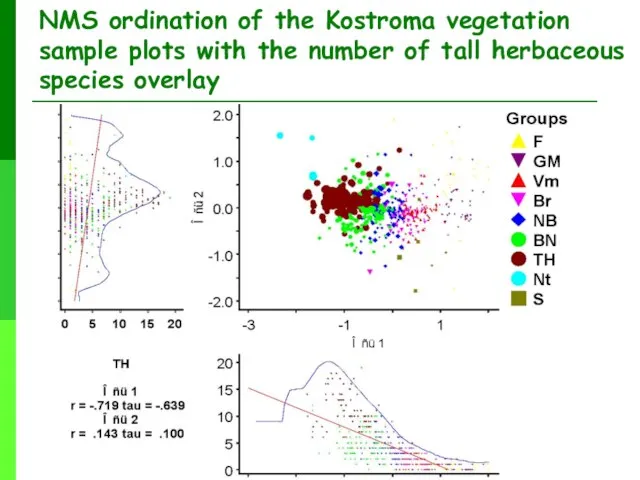
- 32. NMS ordination of the Kostroma vegetation sample plots with the number of tall herbaceous species overlay
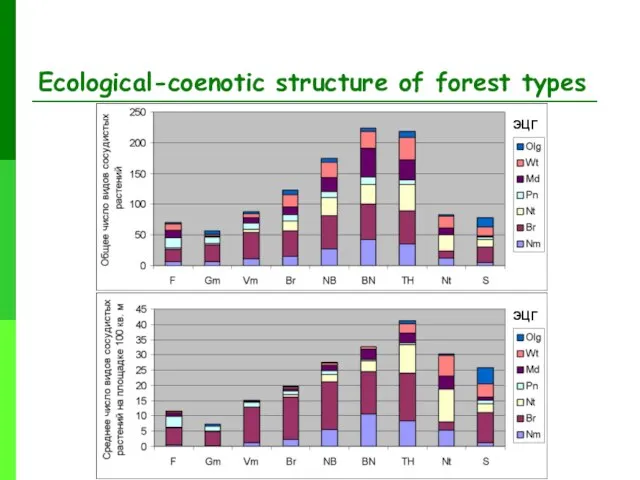
- 33. Ecological-coenotic structure of forest types ЭЦГ ЭЦГ
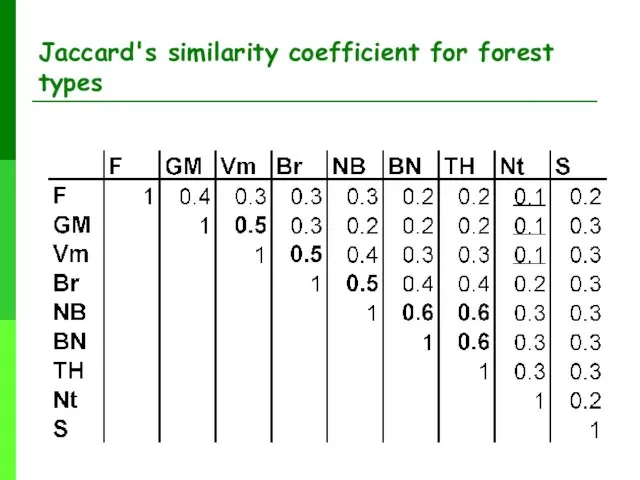
- 34. Jaccard's similarity coefficient for forest types
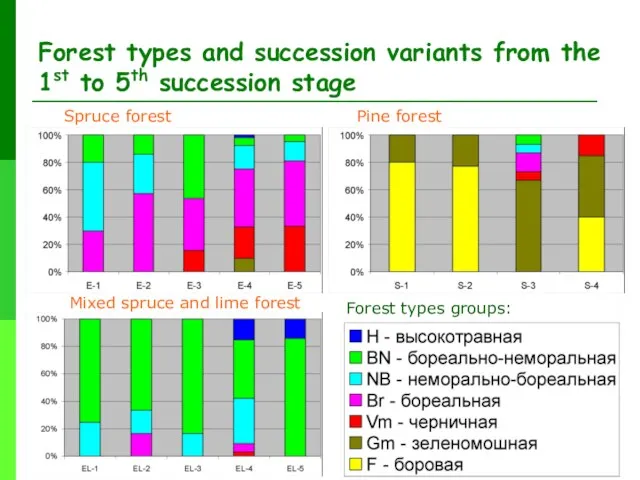
- 35. Forest types and succession variants from the 1st to 5th succession stage Spruce forest Mixed spruce
- 37. Скачать презентацию
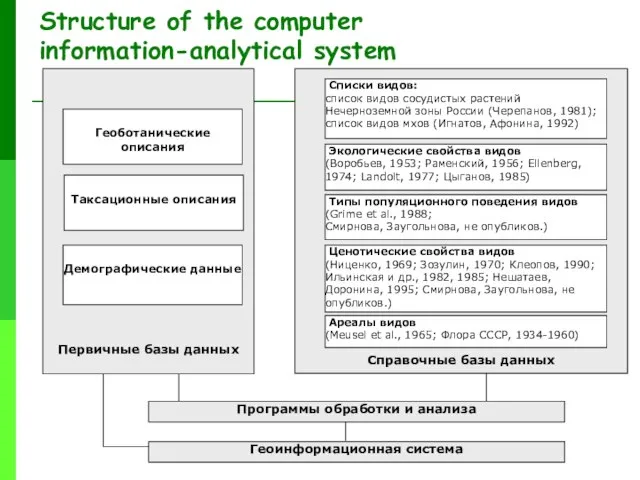
Слайд 2Structure of the computer information-analytical system
Программы обработки и анализа
Геоинформационная система
Первичные базы данных
Геоботанические
Structure of the computer information-analytical system
Программы обработки и анализа
Геоинформационная система
Первичные базы данных
Геоботанические
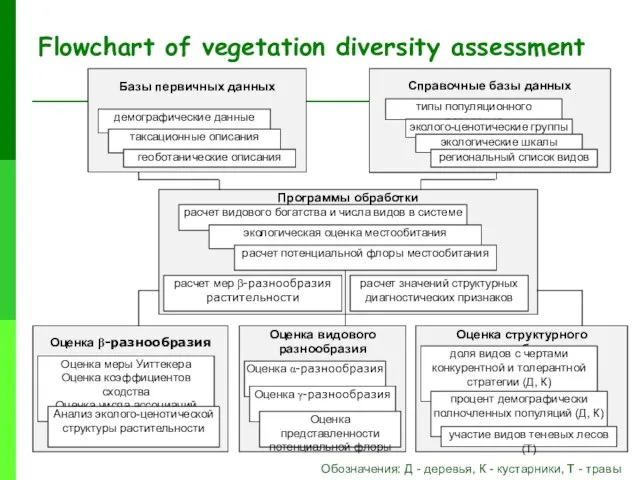
Слайд 3Базы первичных данных
демографические данные
таксационные описания
геоботанические описания
Справочные базы данных
типы популяционного поведения
Программы обработки
расчет мер
демографические данные
таксационные описания
геоботанические описания
Справочные базы данных
типы популяционного поведения
Программы обработки
расчет мер
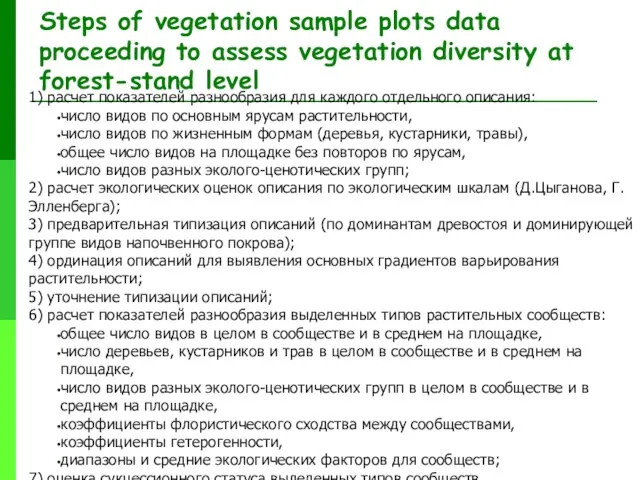
Слайд 4Steps of vegetation sample plots data proceeding to assess vegetation diversity at
Steps of vegetation sample plots data proceeding to assess vegetation diversity at
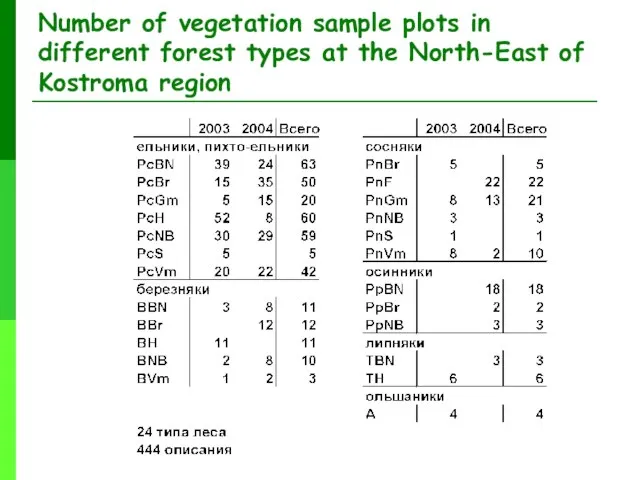
Слайд 5Number of vegetation sample plots in different forest types at the North-East
Number of vegetation sample plots in different forest types at the North-East
Слайд 6Number of phytosociological releves per forest type groups and per year
Number of phytosociological releves per forest type groups and per year
Слайд 7DCA ordination of the Kostroma vegetation sample plots
Ellenberg’s indicator values:
R –
DCA ordination of the Kostroma vegetation sample plots
Ellenberg’s indicator values:
R –
Слайд 8PCoA ordination of the Kostroma vegetation sample plots
Группы типов леса
Ellenberg’s indicator values:
PCoA ordination of the Kostroma vegetation sample plots
Группы типов леса
Ellenberg’s indicator values:
Слайд 9NMS ordination of the Kostroma vegetation sample plots
Группы типов леса
Ellenberg’s indicator values:
NMS ordination of the Kostroma vegetation sample plots
Группы типов леса
Ellenberg’s indicator values:
Слайд 10NMS ordination of the Kostroma vegetation sample plots
NMS ordination of the Kostroma vegetation sample plots
Слайд 11NMS ordination of the Kostroma vegetation sample plots
Overstorey dominants
Picea sp. Betula sp.
NMS ordination of the Kostroma vegetation sample plots
Overstorey dominants
Picea sp. Betula sp.
Слайд 12NMS ordination of the Kostroma vegetation sample plots with values F (soil
NMS ordination of the Kostroma vegetation sample plots with values F (soil
Слайд 13NMS ordination of the Kostroma vegetation sample plots with values N (soil
NMS ordination of the Kostroma vegetation sample plots with values N (soil
Слайд 14NMS ordination of the Kostroma vegetation sample plots with values R (soil
NMS ordination of the Kostroma vegetation sample plots with values R (soil
Слайд 15NMS ordination of the Kostroma vegetation sample plots with values L (light
NMS ordination of the Kostroma vegetation sample plots with values L (light
Слайд 16NMS ordination of the Kostroma vegetation sample plots with values K (climate
NMS ordination of the Kostroma vegetation sample plots with values K (climate
Слайд 17NMS ordination of the Kostroma vegetation sample plots with values T (temperature
NMS ordination of the Kostroma vegetation sample plots with values T (temperature
Слайд 18Reliability of a difference between the forest types upon the species number
Reliability of a difference between the forest types upon the species number
Слайд 19NMS ordination of the Kostroma vegetation sample plots with the number of
NMS ordination of the Kostroma vegetation sample plots with the number of
Слайд 20Tree and shrub species diversity of the forest types
Tree and shrub species diversity of the forest types
Слайд 21NMS ordination of the Kostroma vegetation sample plots with the number of
NMS ordination of the Kostroma vegetation sample plots with the number of
Слайд 22NMS ordination of the Kostroma vegetation sample plots with the number of
NMS ordination of the Kostroma vegetation sample plots with the number of
Слайд 23NMS ordination of the Kostroma vegetation sample plots with the number of
NMS ordination of the Kostroma vegetation sample plots with the number of
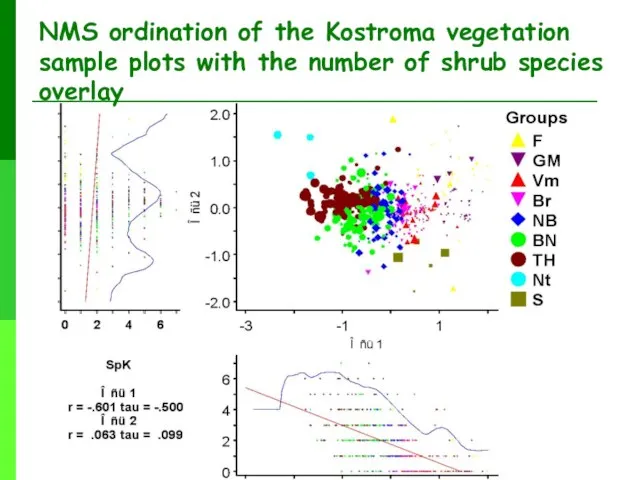
Слайд 24NMS ordination of the Kostroma vegetation sample plots with the number of
NMS ordination of the Kostroma vegetation sample plots with the number of
Слайд 25NMS ordination of the Kostroma vegetation sample plots with the species number
NMS ordination of the Kostroma vegetation sample plots with the species number
Слайд 26NMS ordination of the Kostroma vegetation sample plots with the number of
NMS ordination of the Kostroma vegetation sample plots with the number of
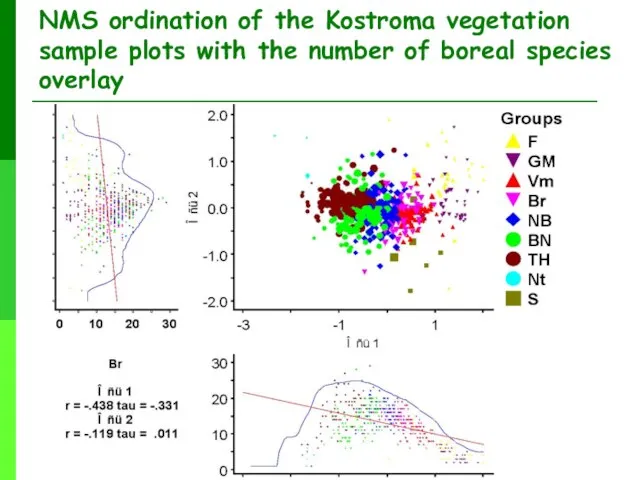
Слайд 27NMS ordination of the Kostroma vegetation sample plots with the number of
NMS ordination of the Kostroma vegetation sample plots with the number of
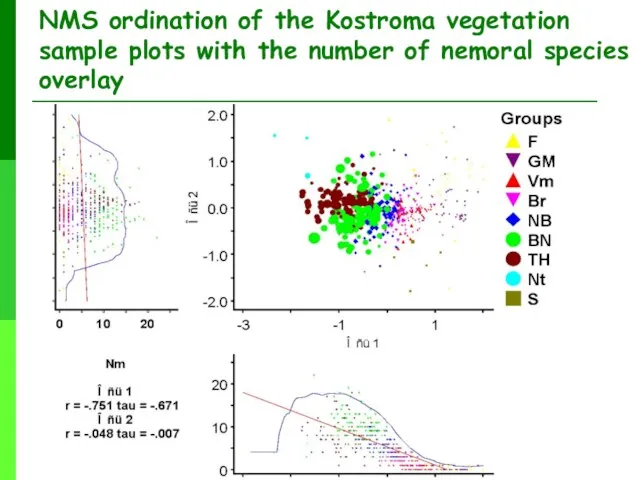
Слайд 28NMS ordination of the Kostroma vegetation sample plots with the number of
NMS ordination of the Kostroma vegetation sample plots with the number of
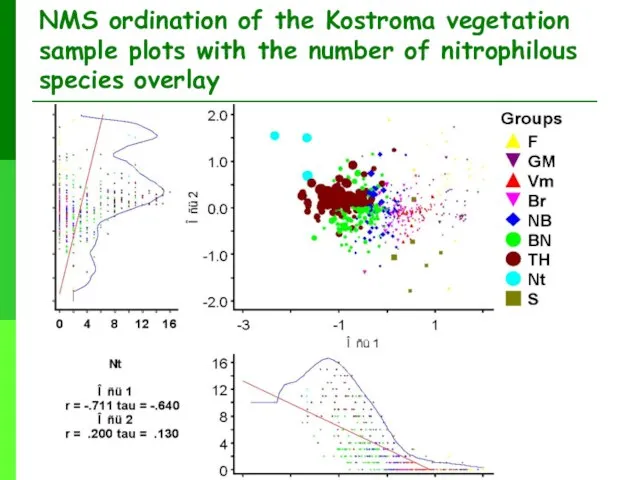
Слайд 29NMS ordination of the Kostroma vegetation sample plots with the number of
NMS ordination of the Kostroma vegetation sample plots with the number of
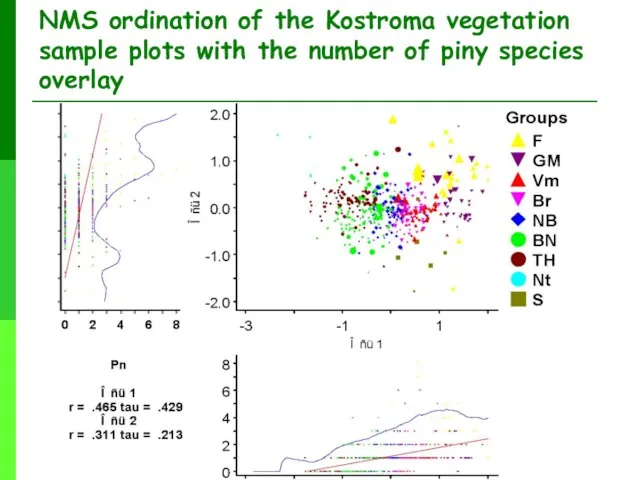
Слайд 30NMS ordination of the Kostroma vegetation sample plots with the number of
NMS ordination of the Kostroma vegetation sample plots with the number of
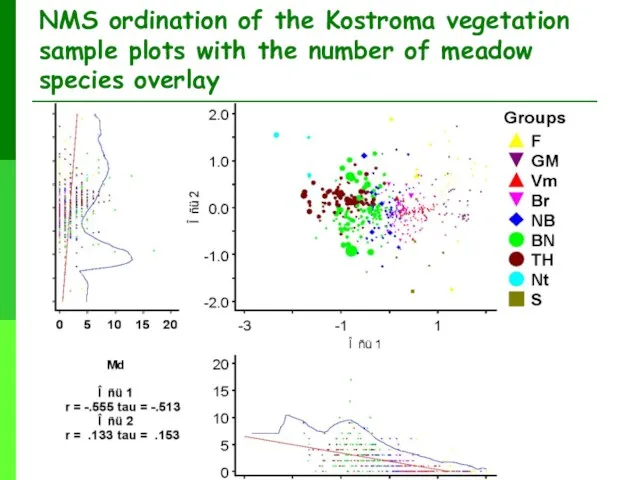
Слайд 31NMS ordination of the Kostroma vegetation sample plots with the number of
NMS ordination of the Kostroma vegetation sample plots with the number of
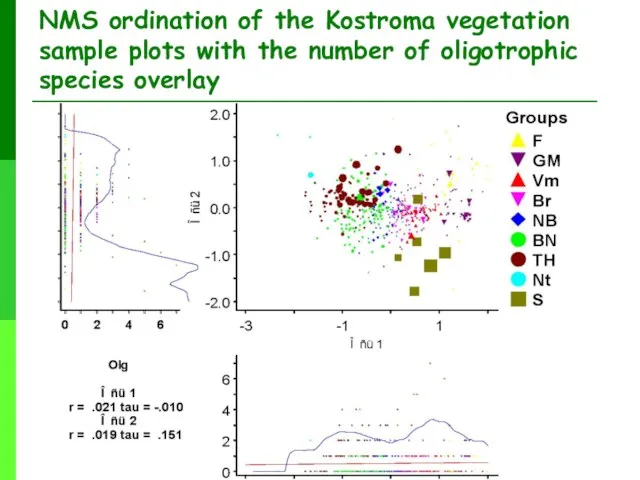
Слайд 32NMS ordination of the Kostroma vegetation sample plots with the number of
NMS ordination of the Kostroma vegetation sample plots with the number of
Слайд 33Ecological-coenotic structure of forest types
ЭЦГ
ЭЦГ
Ecological-coenotic structure of forest types
ЭЦГ
ЭЦГ
Слайд 34Jaccard's similarity coefficient for forest types
Jaccard's similarity coefficient for forest types
Слайд 35Forest types and succession variants from the 1st to 5th succession stage
Forest types and succession variants from the 1st to 5th succession stage
 КУРСОВАЯ РАБОТА по дисциплине «Контракты в международной торговле» на тему «Особенности заключения и исполнения договоров перев
 ИНФОРМАЦИОННАЯ СПРАВКА
 Путешествие в Архангельскую область
 Н.В.Гоголь Поэма «Мёртвые души»
 До свидания начальная школа
 Тепловые двигатели и их применение
 Почему мы все разные ?
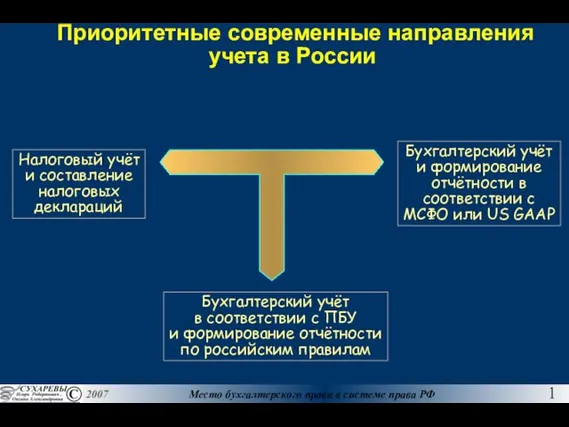 Приоритетные современные направленияучета в России
 Зимующие птицы Московской области
 Реакции в искусстве
 Класс Многощетинковые черви (Полихеты)
 Фасады зданий
 В гости к зиме (2 класс)
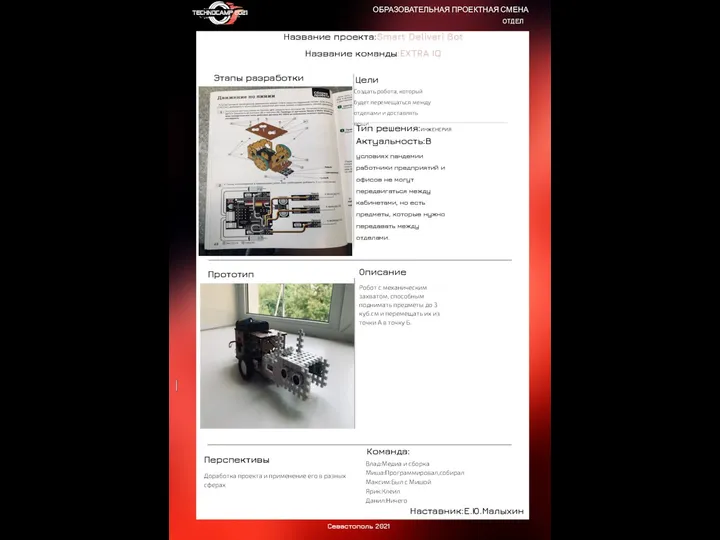 Создание робота. Extra IQ
 Вид рекламных услугРазмер, количество/ тираж Период размещения Место размещения Предоставление компании статуса «Генеральный сп
 Конкурс. Чем занимается психолог
 Управление рисками проекта
 Афинский акрополь
 Презентация на тему Изображение рельефа на географической карте
 УМК «Школа России»
 Чувства, их внешнее проявление, условия формирования
 Красная книга Ленинградской области
 Национальная кухня Германии
 Доступность лекарств для лечения бронхиальной астмы в рамках Программы Государственных Гарантий Исполнитель: ОО «Легочное здоро
 Презентация на тему Архитектура Древнего Египта
 Деление дробных чисел
 А я все чаще замечаю, что скоро в армию пойду
 ТРЕНИЕ СИЛА ТРЕНИЯ