- Consumers, Producers, and the Efficiency of Markets Chapter

Содержание
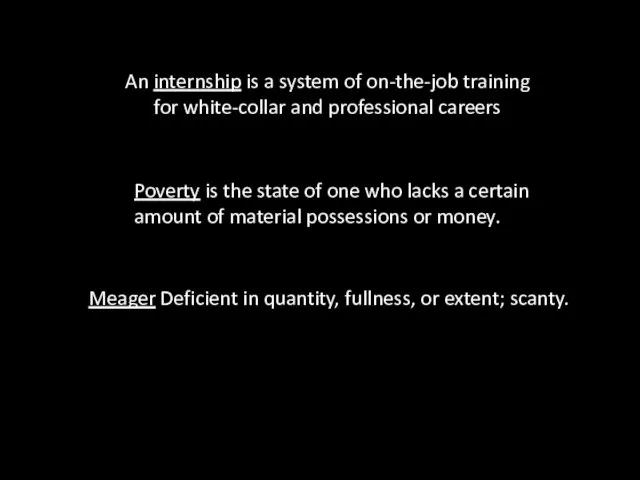
- 3. An internship is a system of on-the-job training for white-collar and professional careers Poverty is the
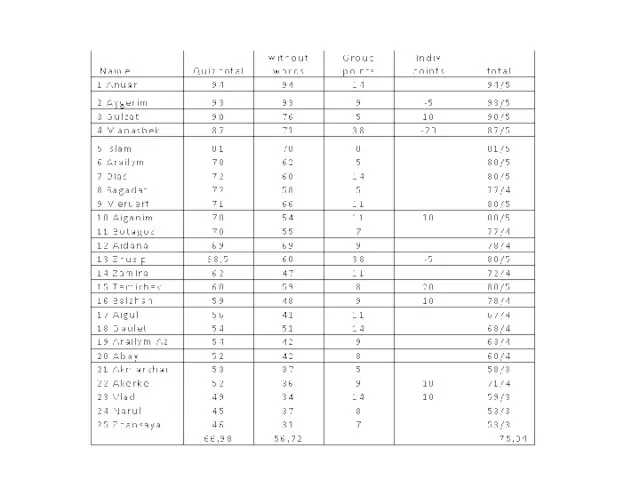
- 4. Quizzes are your feedback on my teaching
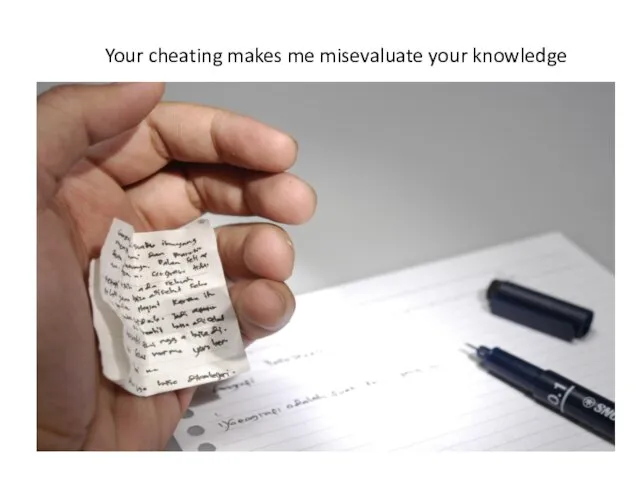
- 5. Your cheating makes me misevaluate your knowledge
- 6. Questions for Review And Problem and Applications For Chapter 7
- 7. 1-)Explain how buyers’ willingness to pay, consumer surplus, and the demand curve are related?
- 8. Buyers’ willingness to pay, consumer surplus, and the demand curve are all closely related. The height
- 9. 2-)What is efficiency? Is it the only goal of economic policymakers?
- 10. they may also be concerned about equity - the fairness of the distribution of well-being. An
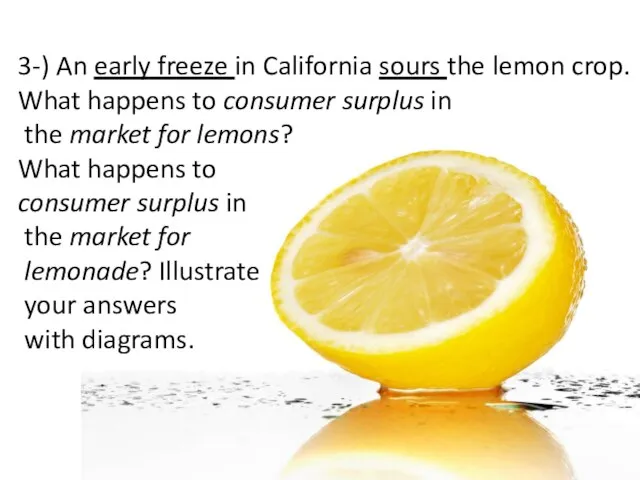
- 11. 3-) An early freeze in California sours the lemon crop. What happens to consumer surplus in
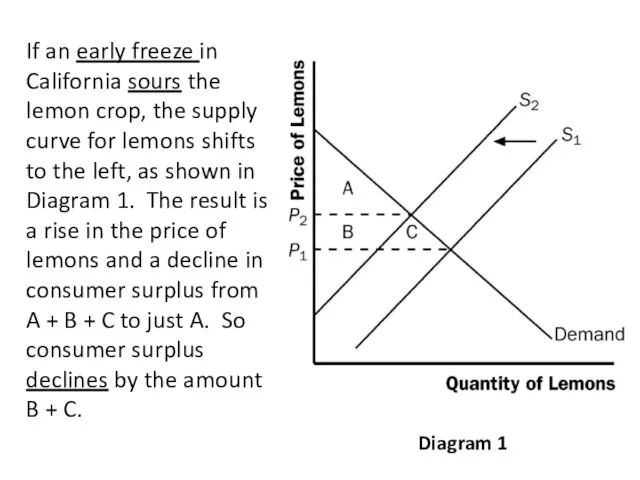
- 12. If an early freeze in California sours the lemon crop, the supply curve for lemons shifts
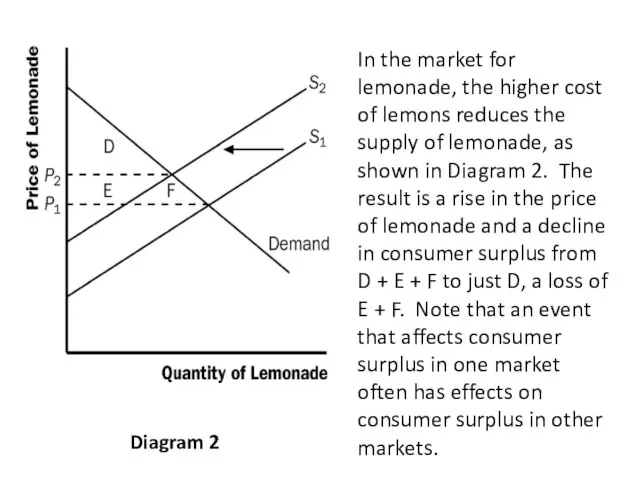
- 13. Diagram 2 In the market for lemonade, the higher cost of lemons reduces the supply of
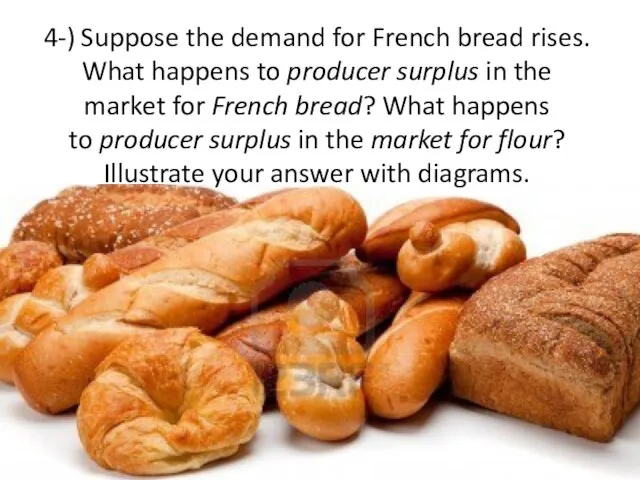
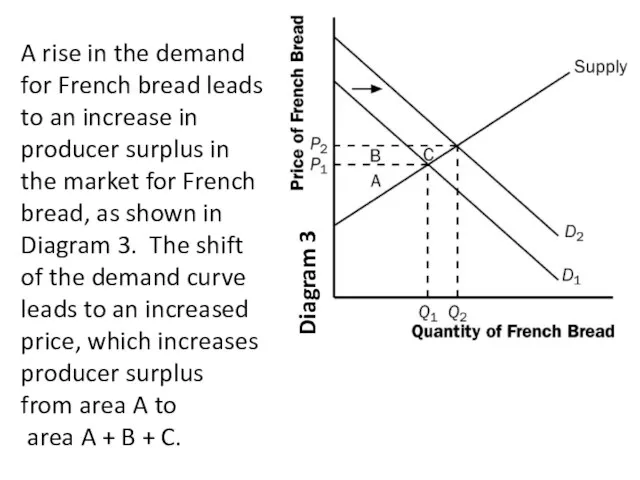
- 14. 4-) Suppose the demand for French bread rises. What happens to producer surplus in the market
- 15. Diagram 3 A rise in the demand for French bread leads to an increase in producer
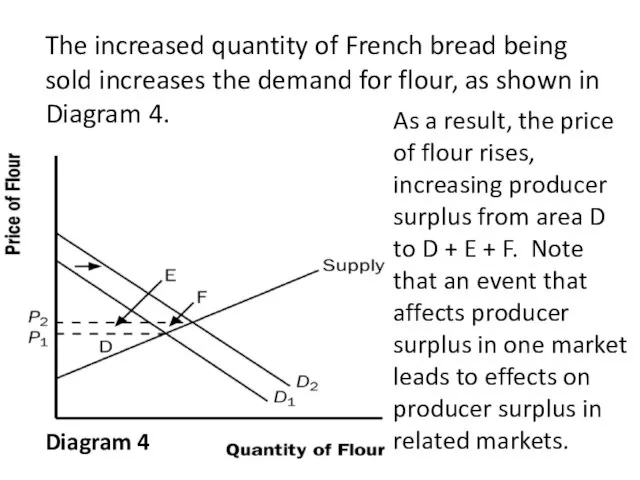
- 16. Diagram 4 The increased quantity of French bread being sold increases the demand for flour, as
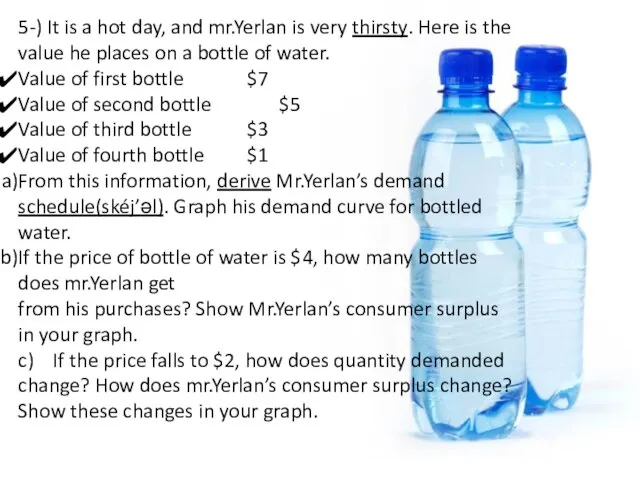
- 17. 5-) It is a hot day, and mr.Yerlan is very thirsty. Here is the value he
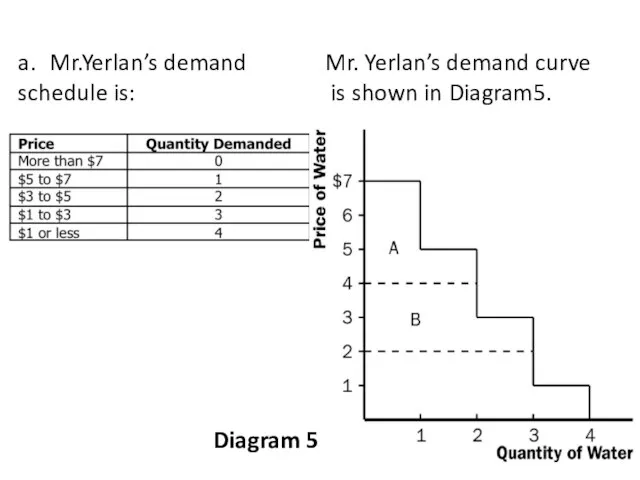
- 18. a. Mr.Yerlan’s demand schedule is: Mr. Yerlan’s demand curve is shown in Diagram5. Diagram 5
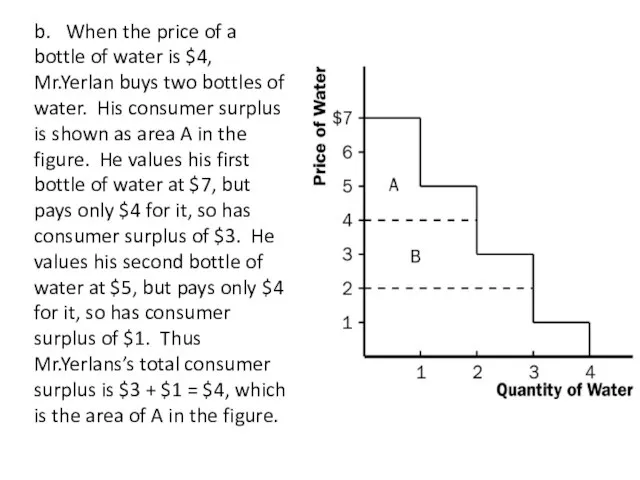
- 19. b. When the price of a bottle of water is $4, Mr.Yerlan buys two bottles of
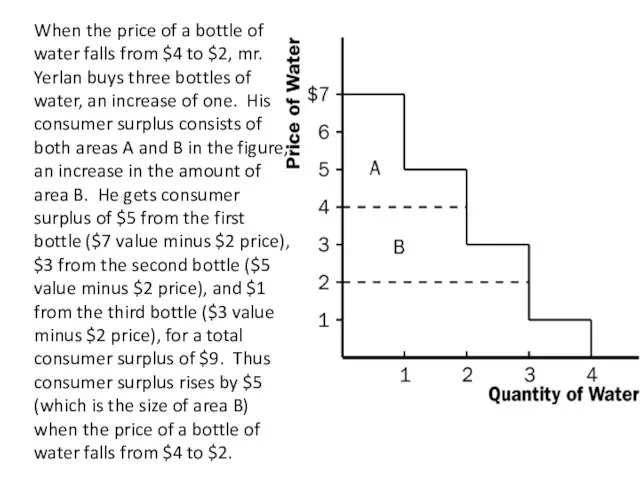
- 20. When the price of a bottle of water falls from $4 to $2, mr. Yerlan buys
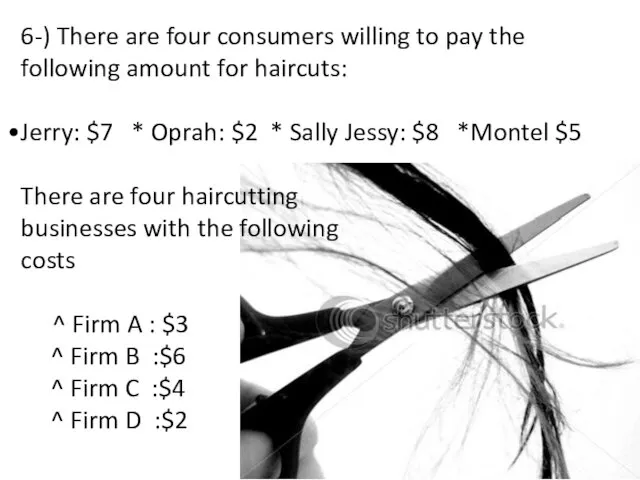
- 21. 6-) There are four consumers willing to pay the following amount for haircuts: Jerry: $7 *
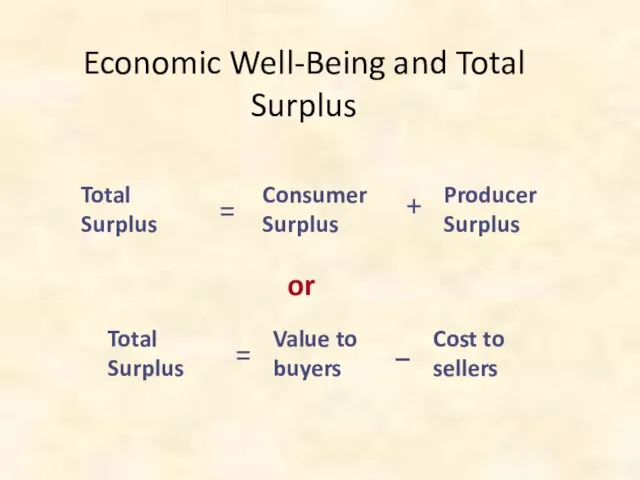
- 22. Economic Well-Being and Total Surplus or
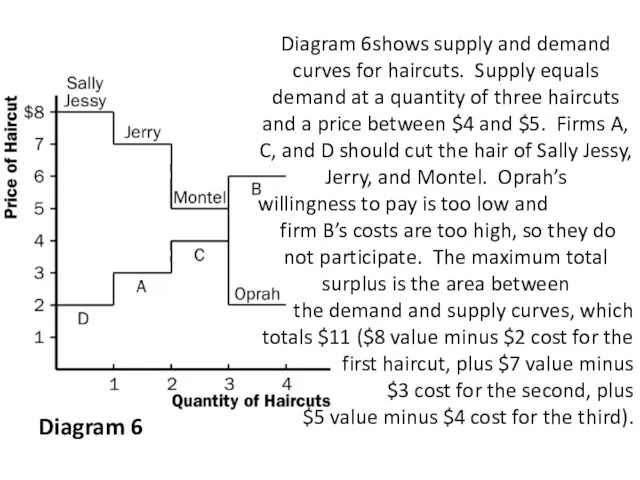
- 23. Diagram 6shows supply and demand curves for haircuts. Supply equals demand at a quantity of three
- 25. Скачать презентацию
Слайд 3An internship is a system of on-the-job training
for white-collar and professional
An internship is a system of on-the-job training
for white-collar and professional
Слайд 4Quizzes are your feedback on my teaching
Quizzes are your feedback on my teaching

Слайд 5Your cheating makes me misevaluate your knowledge
Your cheating makes me misevaluate your knowledge
Слайд 6Questions for Review
And
Problem and Applications
For
Chapter 7
Questions for Review
And
Problem and Applications
For
Chapter 7
Слайд 71-)Explain how buyers’ willingness to pay,
consumer surplus,
and the demand
1-)Explain how buyers’ willingness to pay,
consumer surplus,
and the demand
Слайд 8Buyers’ willingness to pay, consumer surplus,
and the demand curve are all closely
Buyers’ willingness to pay, consumer surplus,
and the demand curve are all closely
Слайд 92-)What is efficiency? Is it the only goal of
economic policymakers?
2-)What is efficiency? Is it the only goal of
economic policymakers?
Слайд 10they may also be concerned
about equity - the fairness of the
they may also be concerned
about equity - the fairness of the
Слайд 113-) An early freeze in California sours the lemon crop.
What happens
3-) An early freeze in California sours the lemon crop.
What happens
Слайд 12If an early freeze in California sours the lemon crop, the supply
If an early freeze in California sours the lemon crop, the supply
Слайд 13Diagram 2
In the market for lemonade, the higher cost of lemons reduces
Diagram 2
In the market for lemonade, the higher cost of lemons reduces
Слайд 144-) Suppose the demand for French bread rises.
What happens to producer surplus
4-) Suppose the demand for French bread rises.
What happens to producer surplus
Слайд 15Diagram 3
A rise in the demand for French bread leads to an
Diagram 3
A rise in the demand for French bread leads to an
Слайд 16Diagram 4
The increased quantity of French bread being sold increases the demand
Diagram 4
The increased quantity of French bread being sold increases the demand
Слайд 175-) It is a hot day, and mr.Yerlan is very thirsty. Here
5-) It is a hot day, and mr.Yerlan is very thirsty. Here
Слайд 18a. Mr.Yerlan’s demand schedule is:
Mr. Yerlan’s demand curve
is shown in Diagram5.
Diagram
a. Mr.Yerlan’s demand schedule is:
Mr. Yerlan’s demand curve
is shown in Diagram5.
Diagram
Слайд 19b. When the price of a bottle of water is $4, Mr.Yerlan buys
b. When the price of a bottle of water is $4, Mr.Yerlan buys
Слайд 20When the price of a bottle of water falls from $4 to
When the price of a bottle of water falls from $4 to
Слайд 216-) There are four consumers willing to pay the following amount for
6-) There are four consumers willing to pay the following amount for
Слайд 22Economic Well-Being and Total Surplus
or
Economic Well-Being and Total Surplus
or
Слайд 23Diagram 6shows supply and demand curves for haircuts. Supply equals demand at
Diagram 6shows supply and demand curves for haircuts. Supply equals demand at
 Зачемсовременному человекууметь рисовать на компьютере?
 Собрание организаторов теневой экономики
 ОАО "ЛВЗ "Висант"
 Интеллектуальная игра День Конституции
 Человек в политической жизни
 Презентация на тему Булгаков "Мастер и Маргарита". Понтий Пилат и Иешуа Га-Ноцри
  Решения Microsoft для образования
 Оформление букв
 Х. Колумб – один из величайших мореплавателей
 Корни с чередованием
 Рукодельная привычка. Игра-викторина
 Обязанности лиц суточного наряда
  Звёзды и созвездия
 Презентация на тему Без праздника не бывает детства
 Как стать офицером
 Качество речи 11 класс
 RCR
RCR Урок развития речи. Описание картины Е.М.Широкова Друзья
 Wonders of the World
 Основы химической кинетики
 Разложение разности квадратов на множители
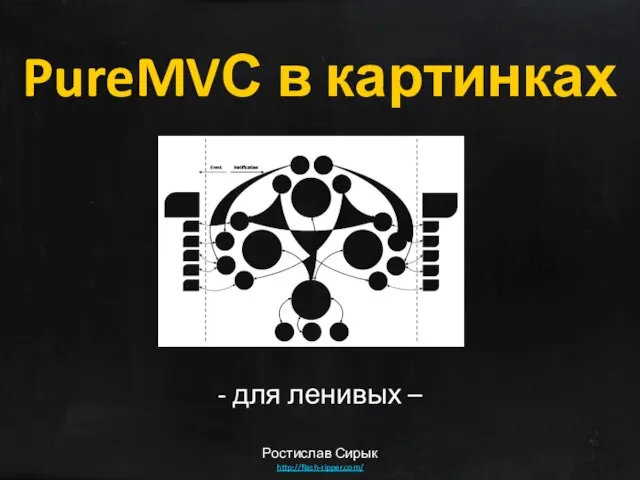 PureMVС в картинках - для ленивых – Ростислав Сирык http://flash-ripper.com/
 Снеговик
 Игра. Профессиональные стандарты в подготовке должностных лиц таможенных органов
 Стадии развития эмбриона
 Лихтенштейн
 Презентация на тему Архитектура Персонального компьютера
  Aaaa
Aaaa