- Consumers,producers and efficiency of markets

Содержание
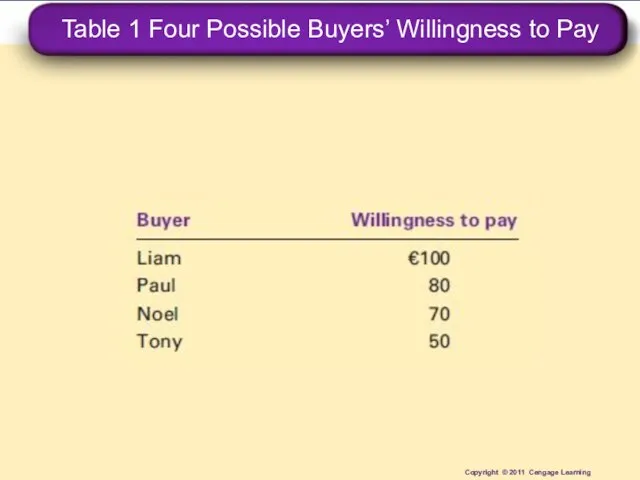
- 2. Table 1 Four Possible Buyers’ Willingness to Pay Copyright © 2011 Cengage Learning
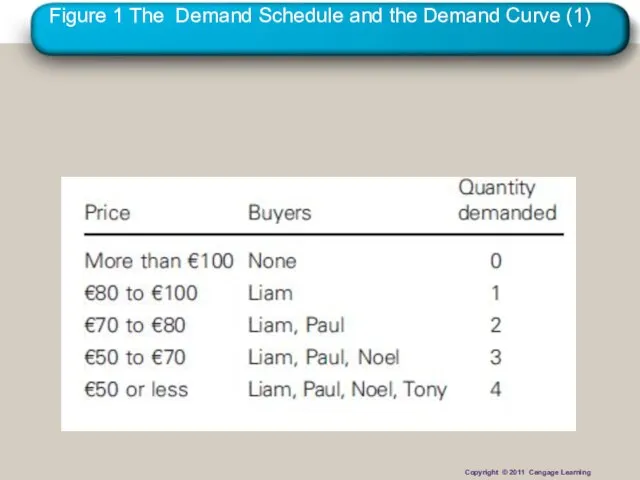
- 3. Figure 1 The Demand Schedule and the Demand Curve (1) Copyright © 2011 Cengage Learning
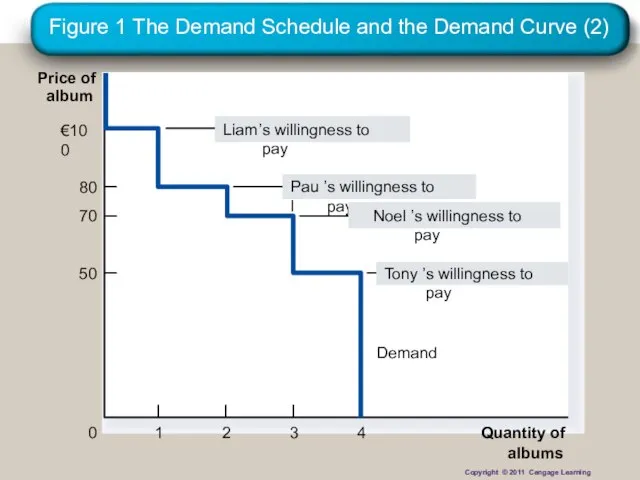
- 4. Figure 1 The Demand Schedule and the Demand Curve (2) Price of album 0 Quantity of
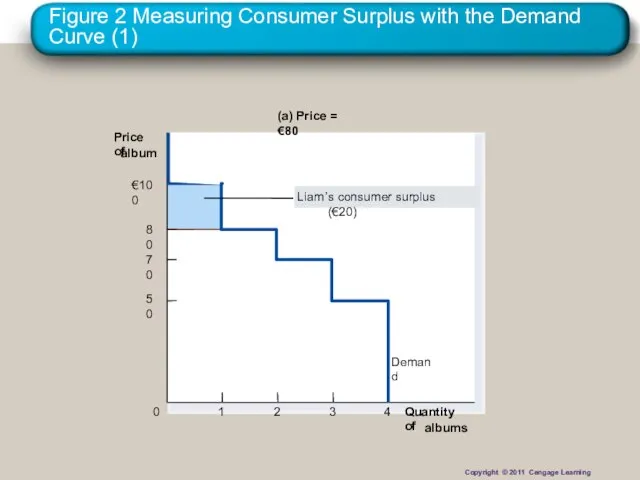
- 5. Figure 2 Measuring Consumer Surplus with the Demand Curve (1) (a) Price = €80 Price of
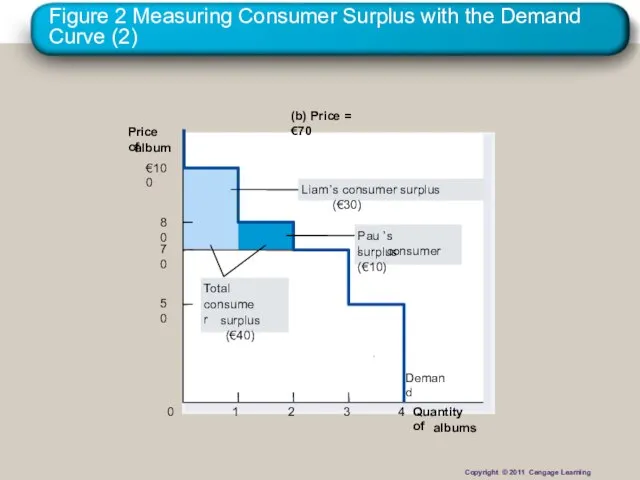
- 6. Figure 2 Measuring Consumer Surplus with the Demand Curve (2) (b) Price = €70 Price of
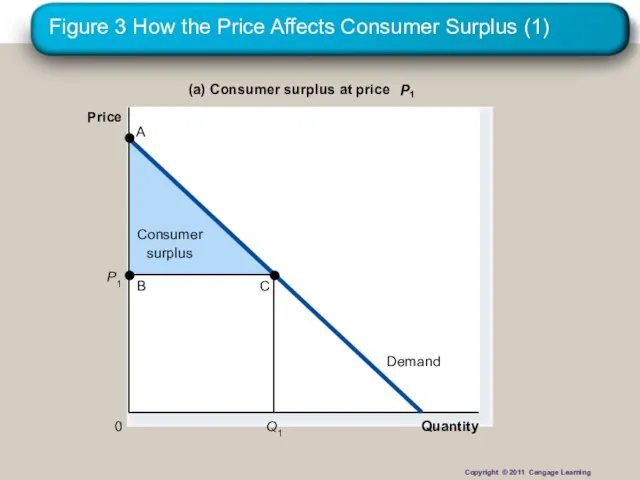
- 7. Figure 3 How the Price Affects Consumer Surplus (1) Quantity (a) Consumer surplus at price P
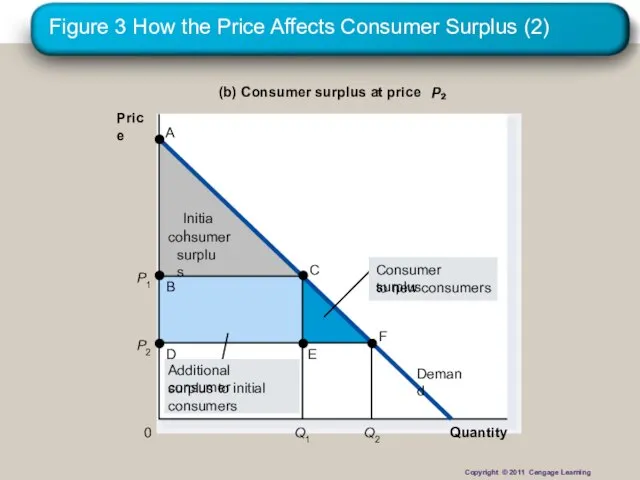
- 8. Figure 3 How the Price Affects Consumer Surplus (2) Quantity (b) Consumer surplus at price P
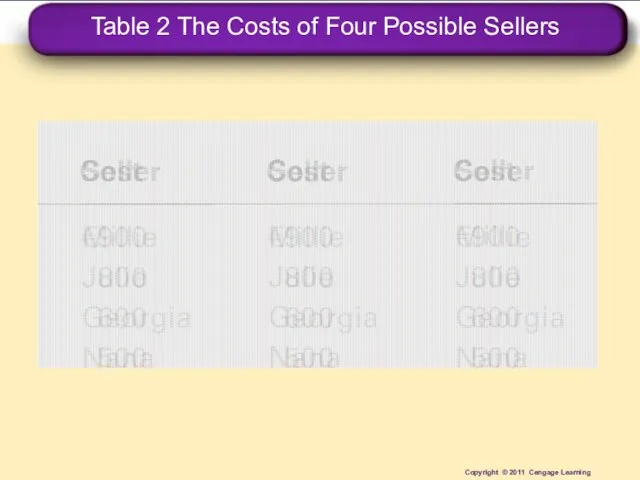
- 9. Table 2 The Costs of Four Possible Sellers Copyright © 2011 Cengage Learning
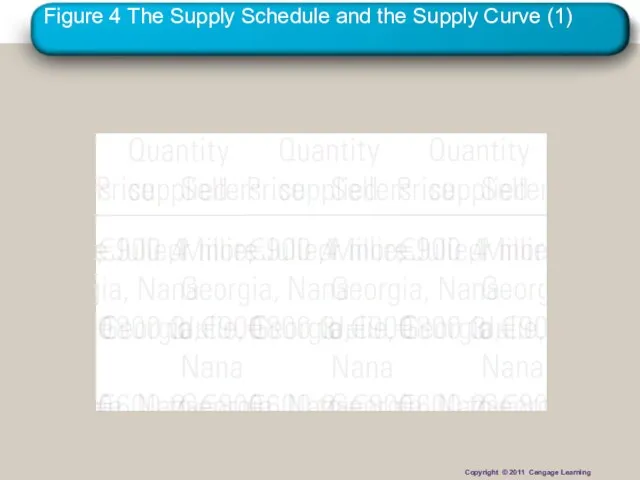
- 10. Figure 4 The Supply Schedule and the Supply Curve (1) Copyright © 2011 Cengage Learning
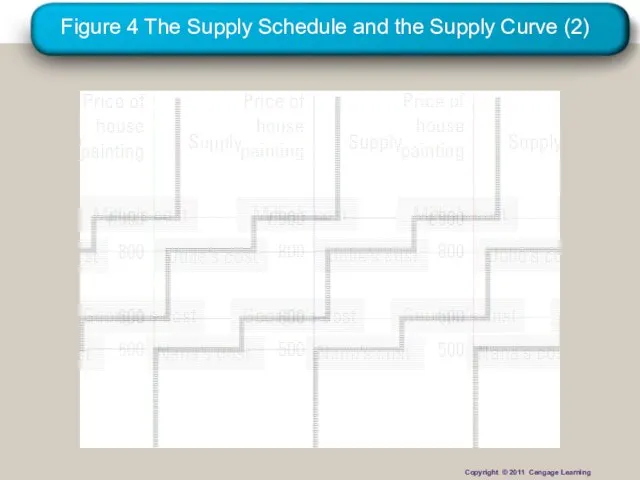
- 11. Figure 4 The Supply Schedule and the Supply Curve (2) Copyright © 2011 Cengage Learning
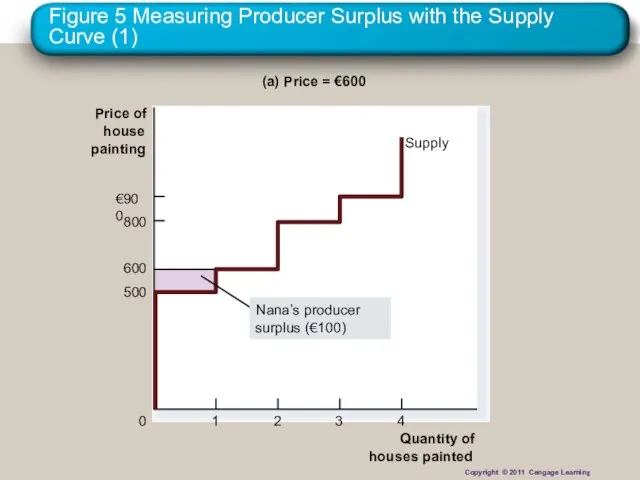
- 12. Figure 5 Measuring Producer Surplus with the Supply Curve (1) Quantity of houses painted Price of
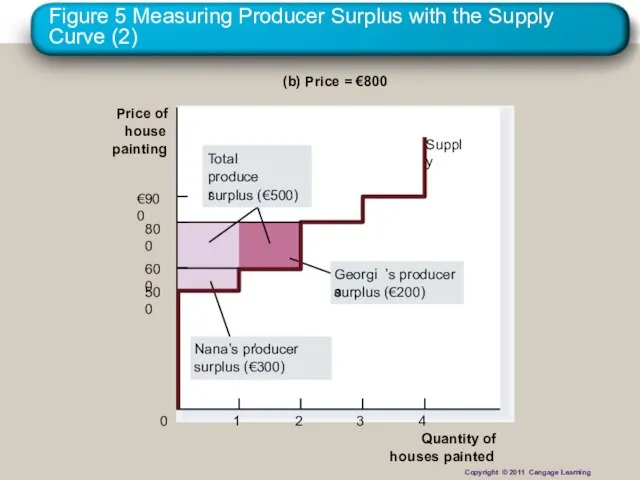
- 13. Figure 5 Measuring Producer Surplus with the Supply Curve (2) Quantity of houses painted Price of
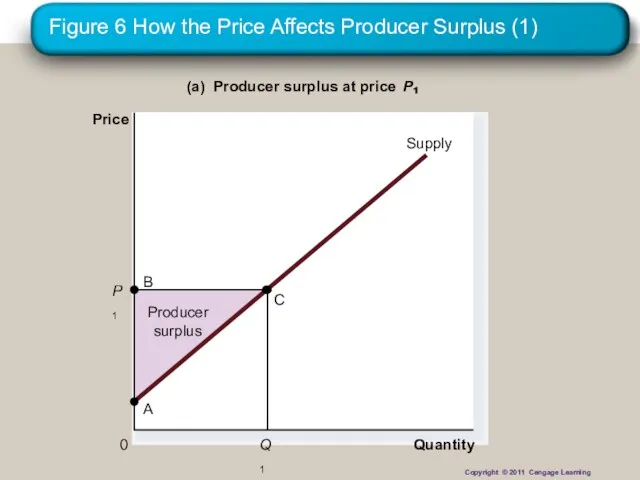
- 14. Figure 6 How the Price Affects Producer Surplus (1) Quantity (a) Producer surplus at price P
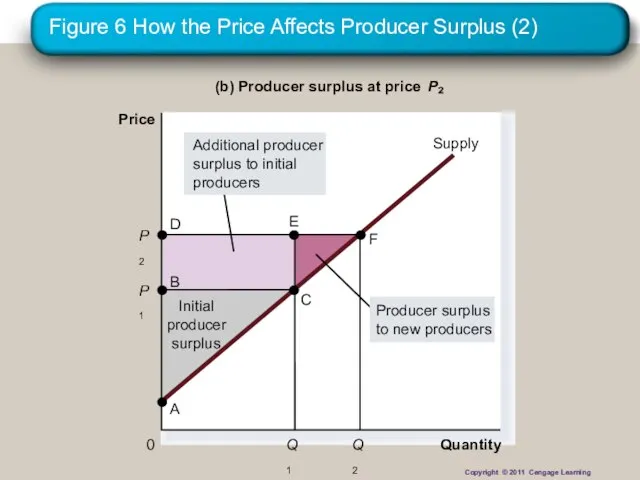
- 15. Figure 6 How the Price Affects Producer Surplus (2) Quantity (b) Producer surplus at price P
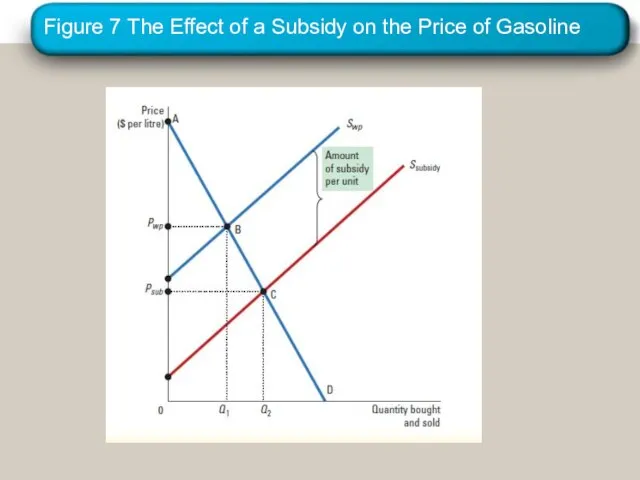
- 16. Figure 7 The Effect of a Subsidy on the Price of Gasoline
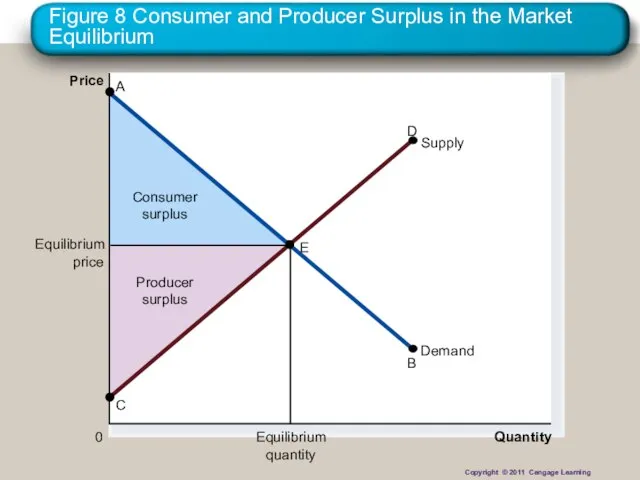
- 17. Figure 8 Consumer and Producer Surplus in the Market Equilibrium Price 0 Quantity Copyright © 2011
- 19. Скачать презентацию
Слайд 3Figure 1 The Demand Schedule and the Demand Curve (1)
Copyright © 2011
Figure 1 The Demand Schedule and the Demand Curve (1)
Copyright © 2011
Слайд 4Figure 1 The Demand Schedule and the Demand Curve (2)
Price of
album
0
Quantity of
albums
1
2
3
4
Copyright
Figure 1 The Demand Schedule and the Demand Curve (2)
Price of
album
0
Quantity of
albums
1
2
3
4
Copyright
Слайд 5Figure 2 Measuring Consumer Surplus with the Demand Curve (1)
(a) Price =
Figure 2 Measuring Consumer Surplus with the Demand Curve (1)
(a) Price =
Слайд 6Figure 2 Measuring Consumer Surplus with the Demand Curve (2)
(b) Price =
Figure 2 Measuring Consumer Surplus with the Demand Curve (2)
(b) Price =
Слайд 7Figure 3 How the Price Affects Consumer Surplus (1)
Quantity
(a) Consumer surplus at
Figure 3 How the Price Affects Consumer Surplus (1)
Quantity
(a) Consumer surplus at
Слайд 8Figure 3 How the Price Affects Consumer Surplus (2)
Quantity
(b) Consumer surplus at
Figure 3 How the Price Affects Consumer Surplus (2)
Quantity
(b) Consumer surplus at
Слайд 9Table 2 The Costs of Four Possible Sellers
Copyright © 2011 Cengage Learning
Table 2 The Costs of Four Possible Sellers
Copyright © 2011 Cengage Learning
Слайд 10Figure 4 The Supply Schedule and the Supply Curve (1)
Copyright © 2011
Figure 4 The Supply Schedule and the Supply Curve (1)
Copyright © 2011
Слайд 11Figure 4 The Supply Schedule and the Supply Curve (2)
Copyright © 2011
Figure 4 The Supply Schedule and the Supply Curve (2)
Copyright © 2011
Слайд 12Figure 5 Measuring Producer Surplus with the Supply Curve (1)
Quantity of
houses painted
Price
Figure 5 Measuring Producer Surplus with the Supply Curve (1)
Quantity of
houses painted
Price
Слайд 13Figure 5 Measuring Producer Surplus with the Supply Curve (2)
Quantity of
houses painted
Price
Figure 5 Measuring Producer Surplus with the Supply Curve (2)
Quantity of
houses painted
Price
Слайд 14Figure 6 How the Price Affects Producer Surplus (1)
Quantity
(a) Producer surplus at
Figure 6 How the Price Affects Producer Surplus (1)
Quantity
(a) Producer surplus at
Слайд 15Figure 6 How the Price Affects Producer Surplus (2)
Quantity
(b) Producer surplus at
Figure 6 How the Price Affects Producer Surplus (2)
Quantity
(b) Producer surplus at
Слайд 16Figure 7 The Effect of a Subsidy on the Price of Gasoline
Figure 7 The Effect of a Subsidy on the Price of Gasoline
Слайд 17Figure 8 Consumer and Producer Surplus in the Market Equilibrium
Price
0
Quantity
Copyright © 2011
Figure 8 Consumer and Producer Surplus in the Market Equilibrium
Price
0
Quantity
Copyright © 2011
 НОВИНКА – БЕГОВАЯ ДОРОЖКА AEROFIT PRO 8700T
 Country Music
 dCache у нас.
 Starlight 4
 Česká rodina
 Презентация на тему качество товаров
  Политическая раздробленность Руси
 Изображение характера животных на рисунке
 Соучастие в преступлении. Понятие и признаки
 Гарри Поттер и Философский камень Джоан Роулинг Родилась 31 июля 1965 года в городке Йейт в графстве Глостершир в университет Эксетер
 Мультимедиа-компьютер
 Перспектива в изобразительном искусстве
 Роль проектирования в воспитательной системе образовательного учреждения.
 ПРИЗЫВНИКУ
 Почему Дима Сомов предал Лену Бессольцеву?
 Презентація учня 3-Е класу Воробйова Сергія
 Модели управления качеством услуг символического обмена.
 Актуальные вопросы применения мобильных платформ
 Жидкий азот
 Школьная баскетбольная Лига города Донецка
 Карточки понятий
 Константин 1 (Великий)
 Механизмы поддержания редких видов
 Региональный этап Всероссийского конкурса профессионального мастерства в сфере социального обслуживания
 Оранжерея ДОУ-комнатные растения
 Презентация на тему Методика обучения решению простых задач
  Передвижные компрессоры PDx RU
 Формулы приведения