- FINANCIAL ANALYSIS AND

Содержание
- 2. INTRODUCTION
- 3. FINANCIAL MODEL OF A COMPANY
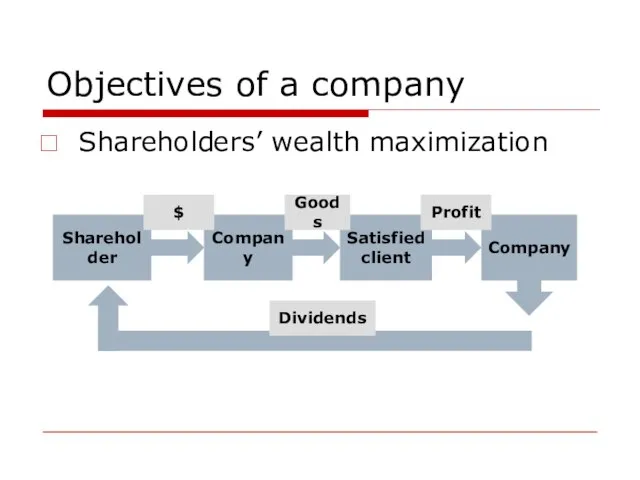
- 4. Objectives of a company Shareholders’ wealth maximization
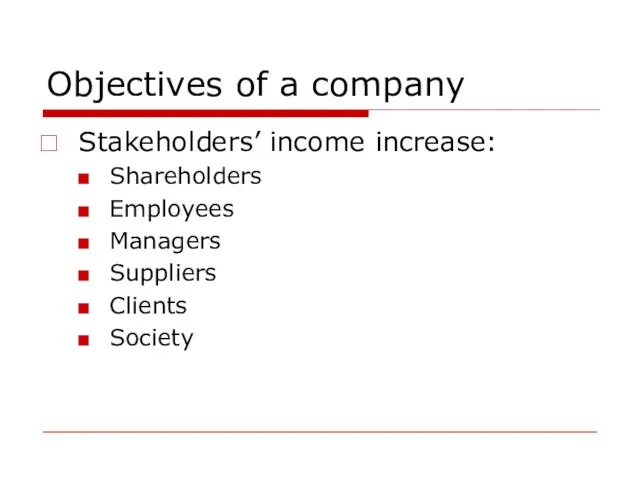
- 5. Objectives of a company Stakeholders’ income increase: Shareholders Employees Managers Suppliers Clients Society
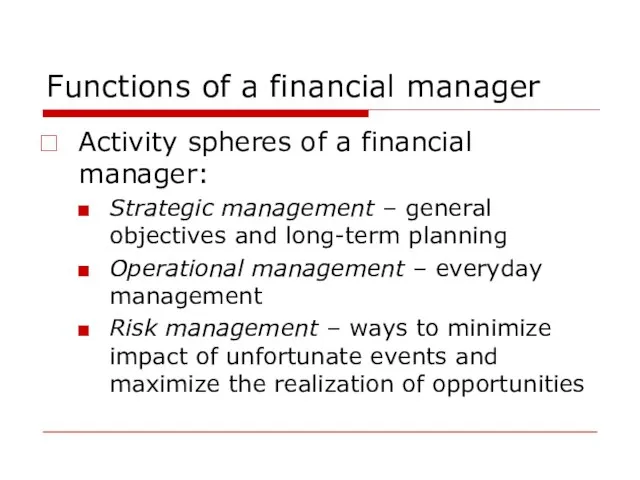
- 6. Functions of a financial manager Activity spheres of a financial manager: Strategic management – general objectives
- 7. Functions of a financial manager
- 8. Functions of a financial manager Key objectives of a financial manager Financial planning Assessment of investment
- 9. Financial structure of the company Financial structure is a hierarchical system of financial responsibility centres (FRC)
- 10. Financial structure of the company Financial responsibility centers (FRC): Cost center (CC) Revenue center (RC) Marginal
- 11. Financial structure of the company
- 12. Financial structure of the company How to from a financial structure: Organizational approach Process approach Define
- 13. Organizational approach An organizational structure is a mainly hierarchical concept of subordination of entities that collaborate
- 14. Organizational approach Functional organization
- 15. Organizational approach Functional organization
- 16. Organizational approach Projectized organization
- 17. Organizational approach Projectized organization
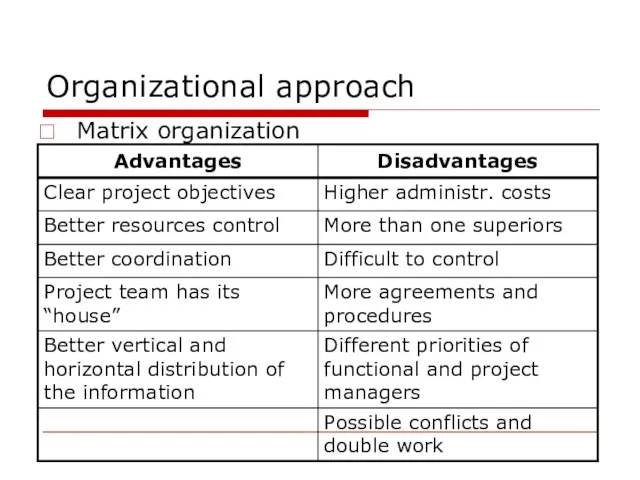
- 18. Organizational approach Matrix organization
- 19. Organizational approach Matrix organization
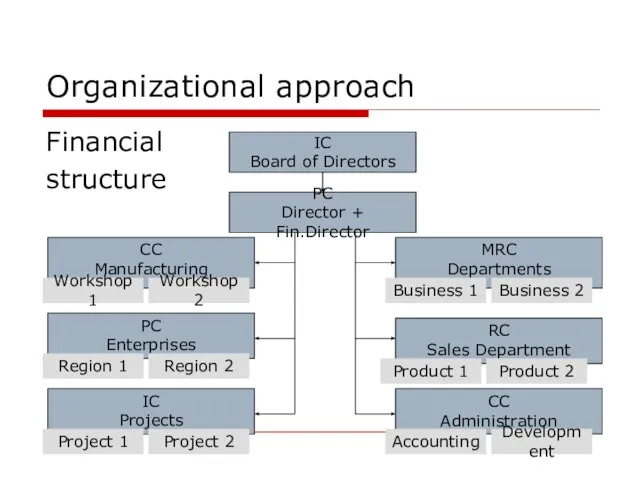
- 20. Organizational approach Financial structure PC Director + Fin.Director CC Manufacturing Workshop 1 Workshop 2 PC Enterprises
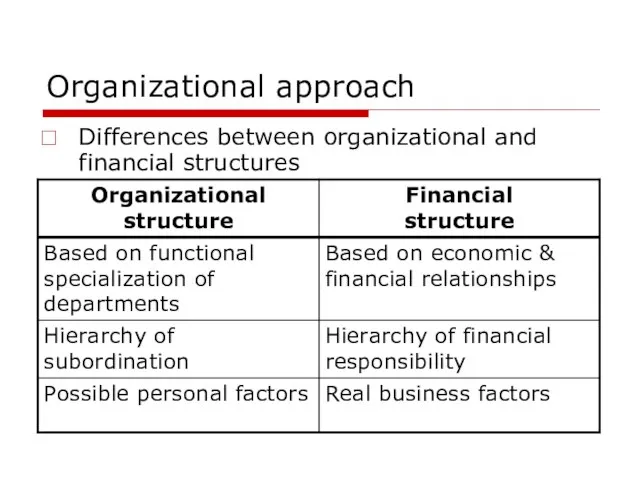
- 21. Organizational approach Differences between organizational and financial structures
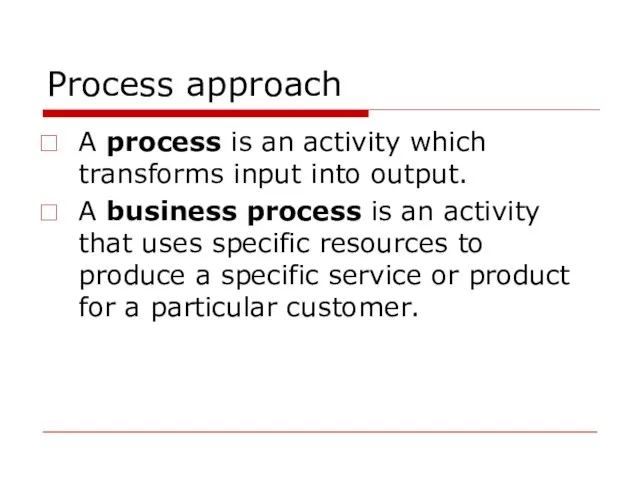
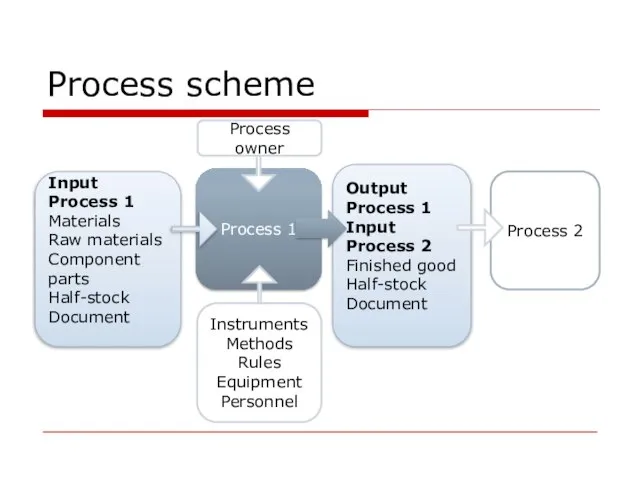
- 22. Process approach A process is an activity which transforms input into output. A business process is
- 23. Process scheme
- 24. Process approach Business-process types: Main Supporting Development Corporate management
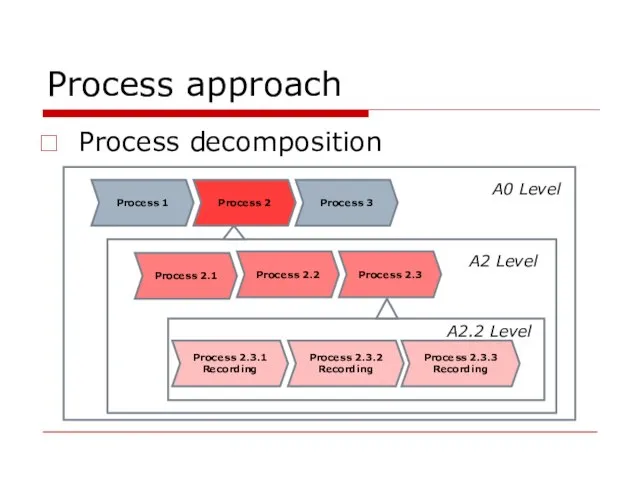
- 25. Process approach Process decomposition Process 1 Process 2 Process 3 Process 2.1 Process 2.2 Process 2.3
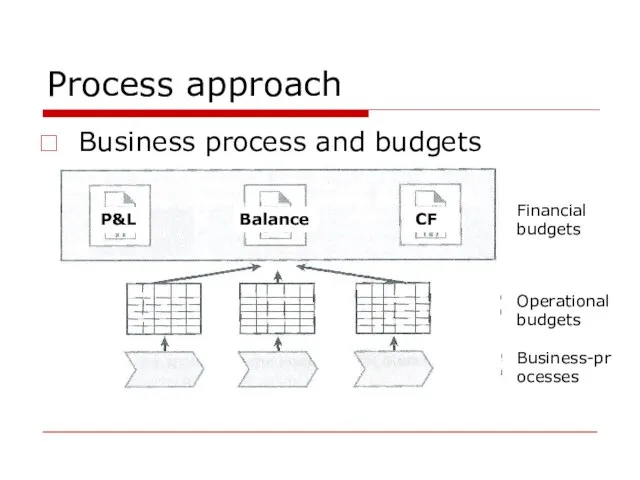
- 26. Process approach Business process and budgets P&L Balance CF Financial budgets Operational budgets Business-processes
- 27. BASIC PRINCIPLES OF FINANCIAL MANAGEMENT
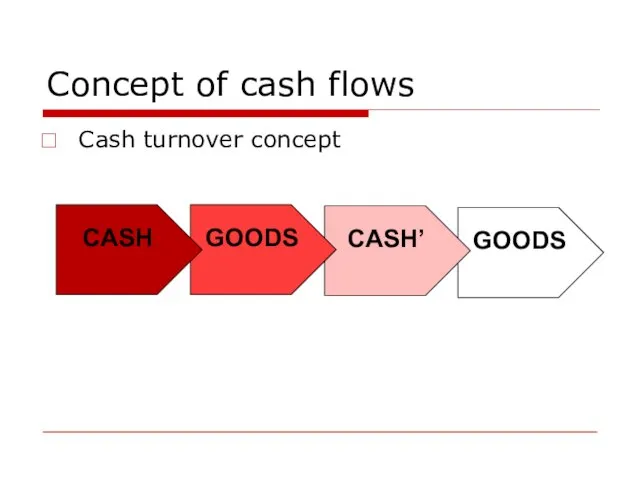
- 28. Concept of cash flows Cash turnover concept
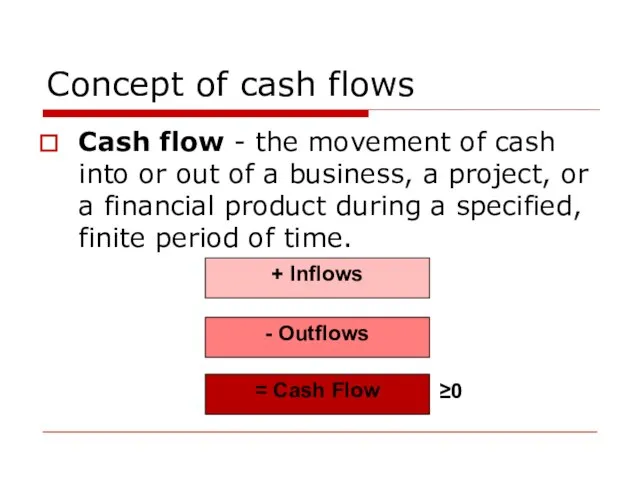
- 29. Concept of cash flows Cash flow - the movement of cash into or out of a
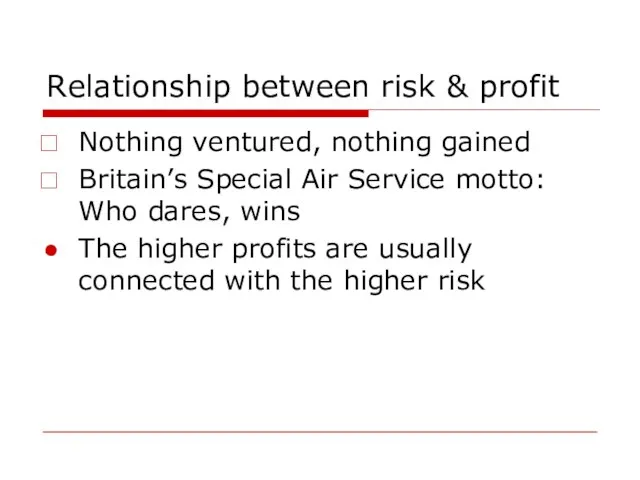
- 30. Relationship between risk & profit Nothing ventured, nothing gained Britain’s Special Air Service motto: Who dares,
- 31. ACCOUNTING SYSTEMS
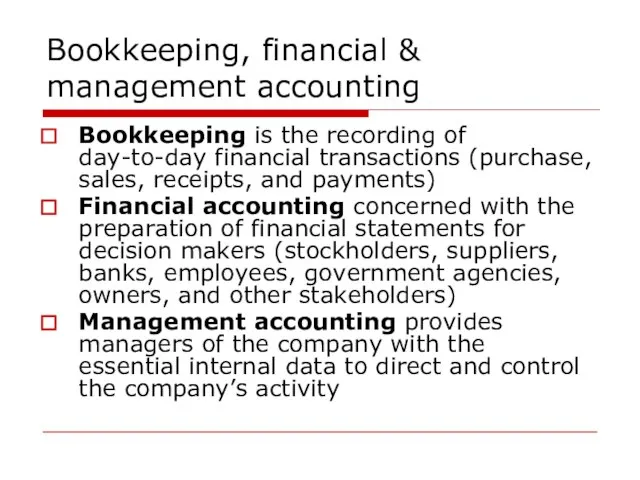
- 32. Bookkeeping, financial & management accounting Bookkeeping is the recording of day-to-day financial transactions (purchase, sales, receipts,
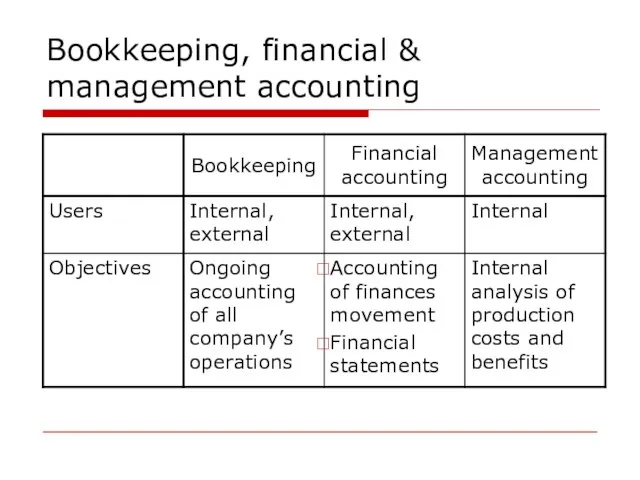
- 33. Bookkeeping, financial & management accounting
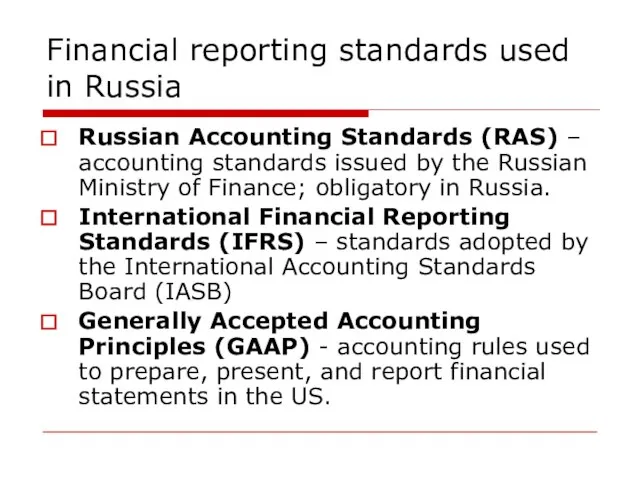
- 34. Financial reporting standards used in Russia Russian Accounting Standards (RAS) – accounting standards issued by the
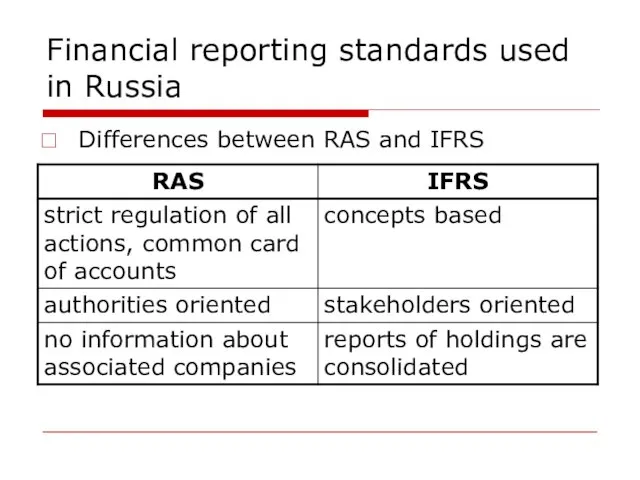
- 35. Financial reporting standards used in Russia Differences between RAS and IFRS
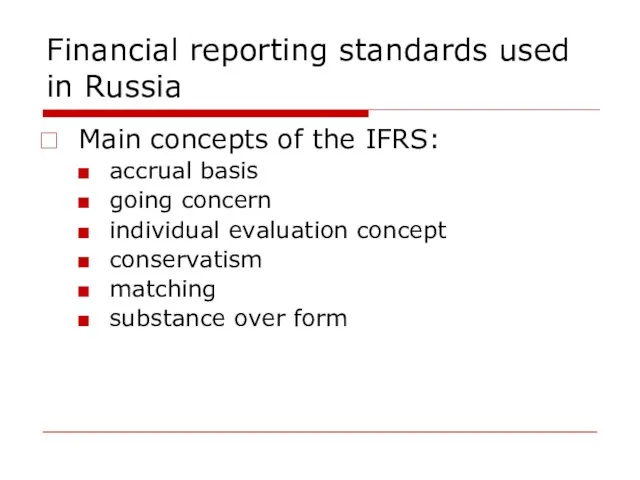
- 36. Financial reporting standards used in Russia Main concepts of the IFRS: accrual basis going concern individual
- 37. FINANCIAL STATEMENTS
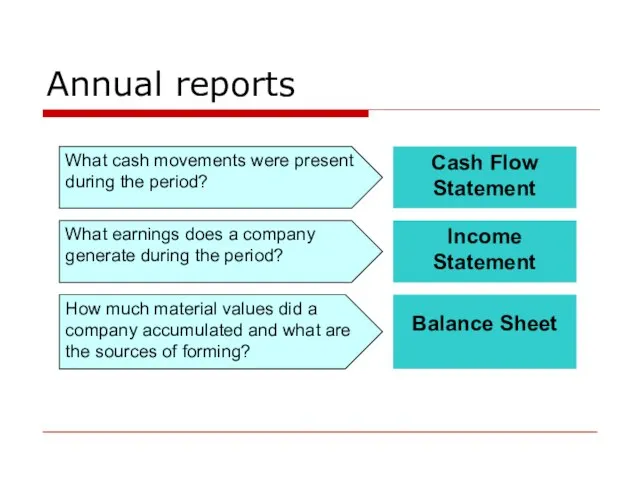
- 38. Annual reports
- 39. BALANCE SHEET
- 40. Loan capital Invested capital EQUITY & LIABILITIES? Where from? ASSETS What? Structure of assets & liabilities
- 41. Structure of assets & liabilities Balance equation Total Assets = Total Liabilities & Equity = FA
- 42. Structure of assets & liabilities Fixed assets: land plant & equipment transport long-term financial investments license
- 43. Structure of assets & liabilities Current assets: cash inventories work-in-process accounts receivable short-term financial investments pre-paid
- 44. Structure of assets & liabilities Equity: shareholders’ equity retained earnings additional capital reserves
- 45. Structure of assets & liabilities Loan capital: long-term liabilities (longer than 12 months) short-term liabilities loans
- 46. Net working capital Invested capital Current assets Current liabilities Net working capital Fixed assets
- 47. Net working capital NWC = CA – CL = IC – FA Represents operating liquidity available
- 48. INCOME STATEMENT
- 49. Income statement Receipts: Sales Interests Payments for services Rent … Disbursements: Cost of sales Salaries &
- 50. Income statement
- 51. Balance sheet & income statement
- 52. Balance sheet & income statement Assets = Equity + (-) Profit (Loss) + Liabilities Assets =
- 53. STATEMENT OF CASH FLOWS
- 54. Cash flow statement Operating activities: Cash received from customers Cash paid to suppliers and employees Operating
- 55. Cash flow statement Investing activities Proceeds from sales of assets Capital expenditures Shares acquisition Proceeds from
- 56. Cash flow statement Financing activities Equity Loans Proceeds from issuance of long-term debt Repayment of loans
- 57. Cash flow statement
- 58. Cash flow statement Methods of representing cash flows from operating activities: Direct - all the inflows
- 59. Cash flow statement Steps of the indirect method: Add back noncash expenses, primarily depreciation / Subtract
- 60. Cash flow statement Signs for adjustments (indirect method) ? Current assets ? Current liabilities Noncash earnings
- 61. Cash flow statement Differences between EAT and CF: ? EAT show economic effectiveness of sales, don’t
- 62. FINANCIAL ANALYSIS
- 63. BASIC PRINCIPLES
- 64. Financial ratios A financial ratio is a relationship that indicates something about a firm’s activities and
- 65. Financial ratios Successful financial ratio analysis: Requires only representative sample of possible ratios A financial ratio
- 66. Financial ratios Advantages of financial ratios: Possible to compare companies and projects of different sizes Just
- 67. Financial ratios Disadvantages of financial ratios: Strongly depend on accuracy of reports Don’t analyze absolute values
- 68. Financial ratios Users of financial analysis results:
- 69. FIVE GROUPS OF FINANCIAL RAIOS
- 70. Financial ratios Five groups of financial ratios Profitability Liquidity Activity Financial leverage Market based
- 71. Liquidity ratios Liquidity ratios indicate a firm’s ability to meet short-term financial obligations. Current ratio=Current assets
- 72. Liquidity ratios Aging schedule
- 73. Activity ratios Activity ratios indicate how efficiently a firm is utilizing its assets to generate the
- 74. Activity ratios Average collection period = Accounts receivable/ (Annual credit sales/365) Inventory turnover = Costs of
- 75. Financial leverage ratios Financial leverage ratios measure the degree to which a firm is financing its
- 76. Financial leverage ratios Financial leverage rule: if the rate of return on equity exceed the cost
- 77. Profitability ratios Profitability ratios measure the total effectiveness of a company’s management in generating profits. Gross
- 78. Market-based ratios Market-based ratios measure the market’s (investor’s) assessment of the risk and performance of a
- 79. SOME METHODS OF FINANCIAL ANALYSIS
- 80. Methods of financial analysis Vertical analysis – structure analysis of a company’s statements Horizontal analysis –
- 81. Trend analysis Steps of the trend analysis: Choose a ratio Choose a basic period / find
- 82. Trend analysis Ratio value Industry standard
- 83. DuPont Chart analysis ROI = NPM * TAT ROE = NPM * TAT * EM
- 84. DuPont Chart analysis Net profit margin 4,45% Total Asset Turnover 1,377 Earnings after taxes $5,016 Sales
- 85. Factor analysis
- 86. Factor analysis
- 87. Z-analysis
- 88. CASH FLOW MANAGEMENT
- 89. NET CASH FLOW
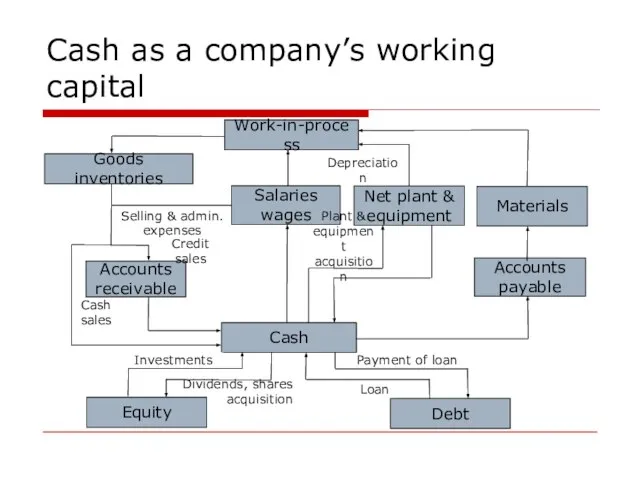
- 90. Cash as a company’s working capital
- 91. Cash as a company’s working capital Cash volume depends on: Production phase Sales Collection of accounts
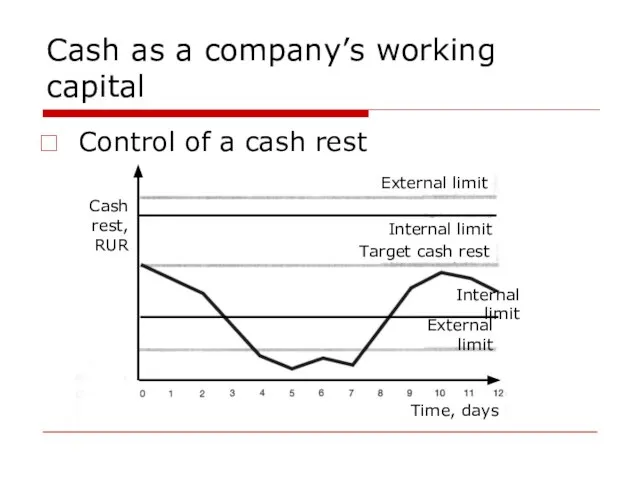
- 92. Cash as a company’s working capital Control of a cash rest Cash rest, RUR External limit
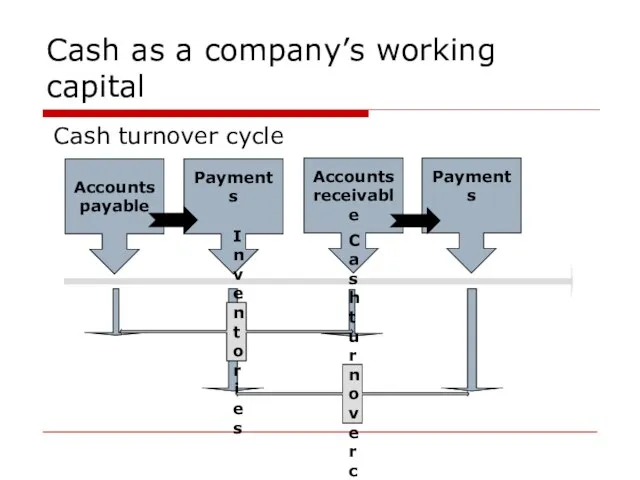
- 93. Cash as a company’s working capital Cash turnover cycle
- 94. Accounts payable payment period Accounts receivable collection period Cash as a company’s working capital Cash turnover
- 95. Statement of cash sources & disbursements Cash sources Current assets reduction (excl. cash) Fixed assets reduction
- 96. Depreciation Depreciation norm depends on: Initial Lifetime: Technical Effective Rest cost Method of depreciation: Straight line
- 97. Depreciation Straight-line Accelerated
- 98. Deferred taxes Straight-line Accelerated
- 99. Deferred taxes
- 100. CASH FLOW FORECASTING
- 101. Forecasting of financial statements 5 steps: Define basic data for forecasting: external income tax rate interest
- 102. Forecasting of financial statements internal: investments policy external financing policy accounting policy dividend policy planned profitability
- 103. Forecasting of financial statements Forecast the volume of sales bottom-up forecasting statistics analysis marketing analysis Forecast
- 104. Forecasting of financial statements Analysis of pro forma financial statements Cash flows Additional financing & sources
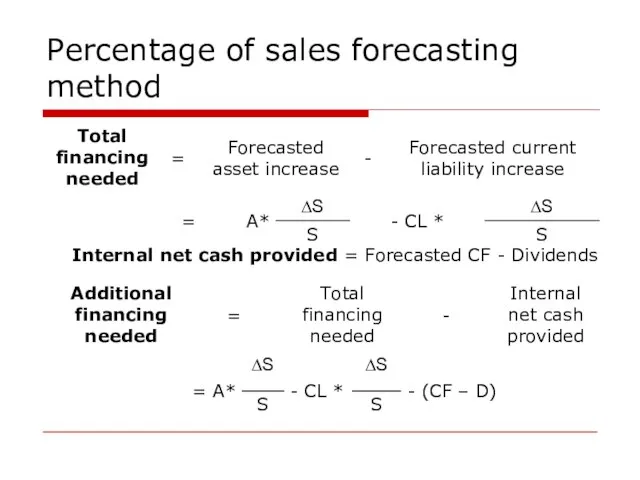
- 105. Percentage of sales forecasting method The percentage of sales forecasting method: permits a company to forecast
- 106. Percentage of sales forecasting method Internal net cash provided = Forecasted CF - Dividends
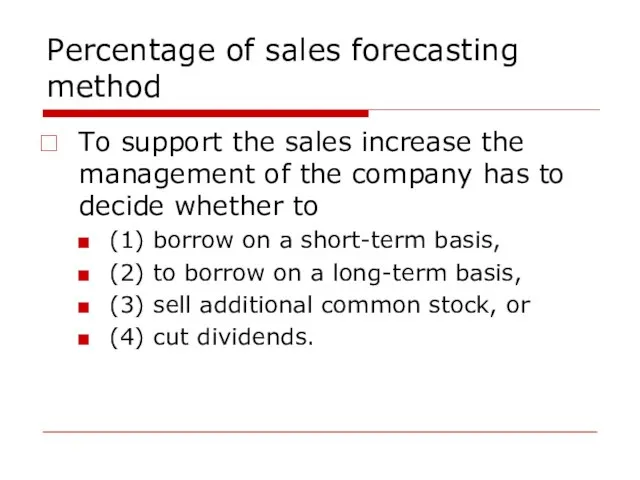
- 107. Percentage of sales forecasting method To support the sales increase the management of the company has
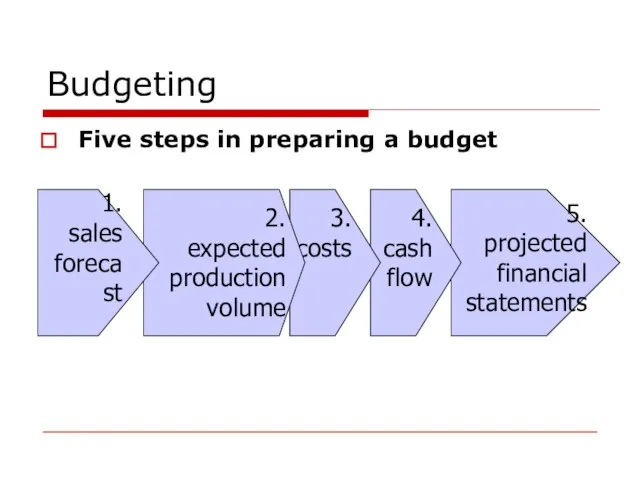
- 108. Budgeting Five steps in preparing a budget
- 109. COSTS PLANNING
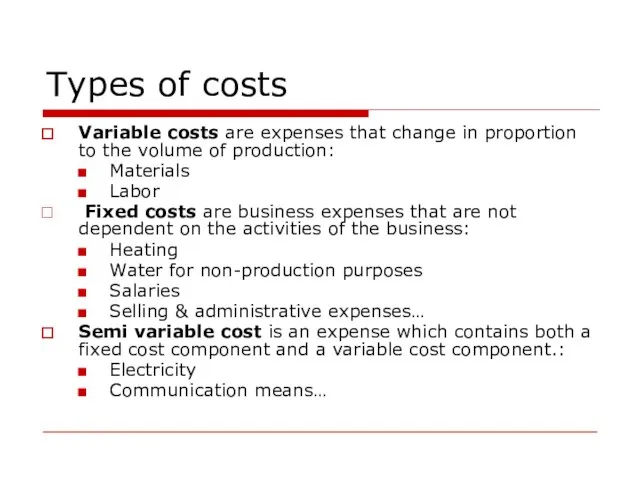
- 110. Types of costs Variable costs are expenses that change in proportion to the volume of production:
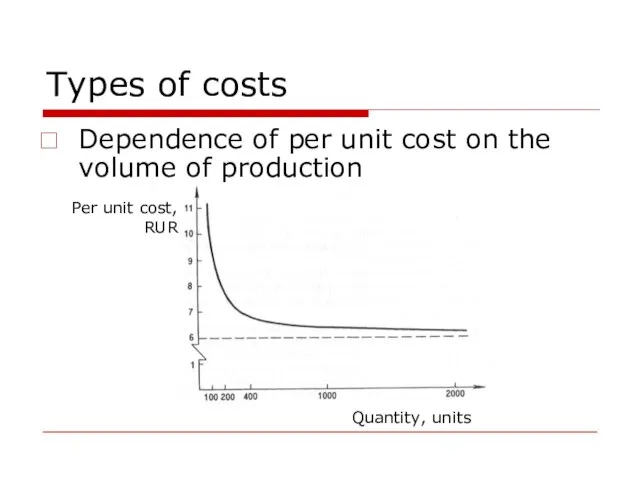
- 111. Types of costs Dependence of per unit cost on the volume of production Per unit cost,
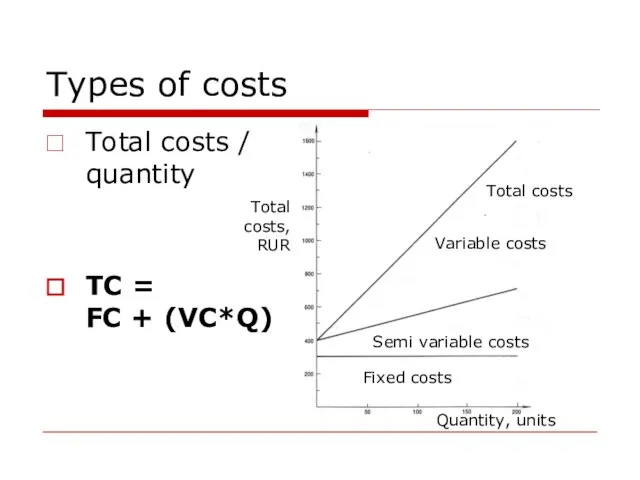
- 112. Types of costs Total costs / quantity TC = FC + (VC*Q) Total costs, RUR Quantity,
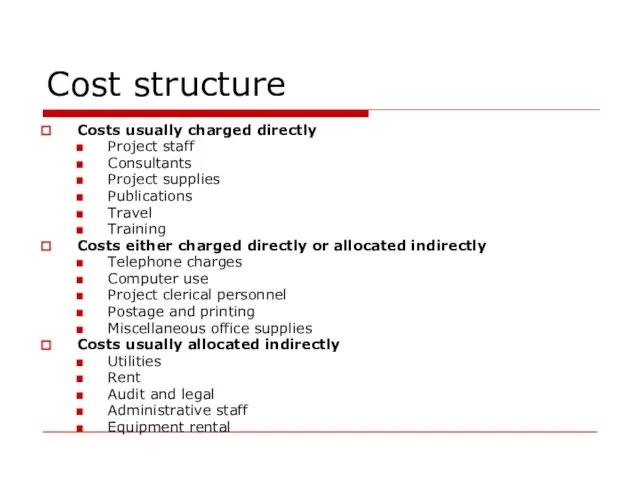
- 113. Cost structure A cost is the value of money that has been used up to produce
- 114. Cost structure Costs usually charged directly Project staff Consultants Project supplies Publications Travel Training Costs either
- 116. Скачать презентацию

Слайд 3FINANCIAL MODEL OF A COMPANY
FINANCIAL MODEL OF A COMPANY
Слайд 4Objectives of a company
Shareholders’ wealth maximization
Objectives of a company
Shareholders’ wealth maximization
Слайд 5Objectives of a company
Stakeholders’ income increase:
Shareholders
Employees
Managers
Suppliers
Clients
Society
Objectives of a company
Stakeholders’ income increase:
Shareholders
Employees
Managers
Suppliers
Clients
Society
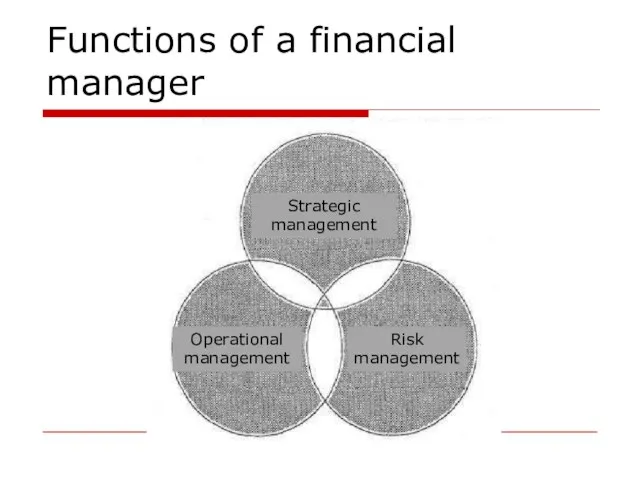
Слайд 6Functions of a financial manager
Activity spheres of a financial manager:
Strategic management –
Functions of a financial manager
Activity spheres of a financial manager:
Strategic management –
Слайд 7Functions of a financial manager
Functions of a financial manager
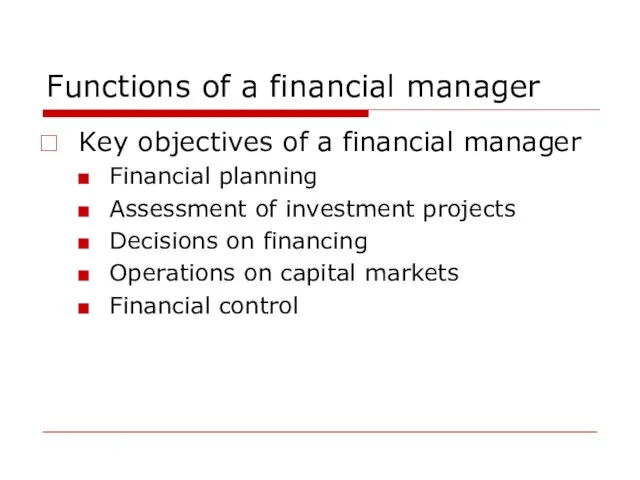
Слайд 8Functions of a financial manager
Key objectives of a financial manager
Financial planning
Assessment of
Functions of a financial manager
Key objectives of a financial manager
Financial planning
Assessment of
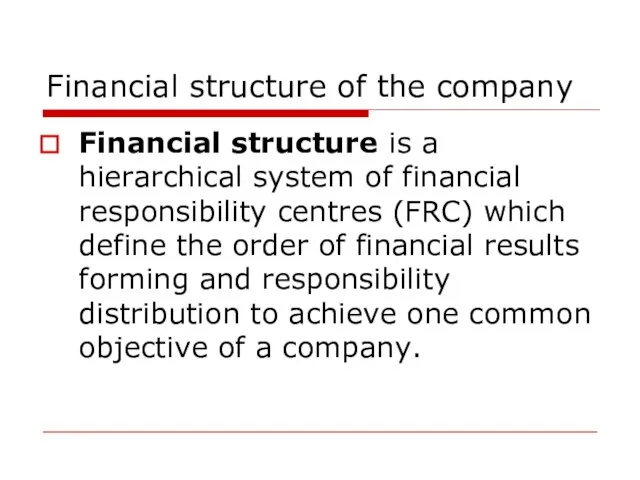
Слайд 9Financial structure of the company
Financial structure is a hierarchical system of financial
Financial structure of the company
Financial structure is a hierarchical system of financial
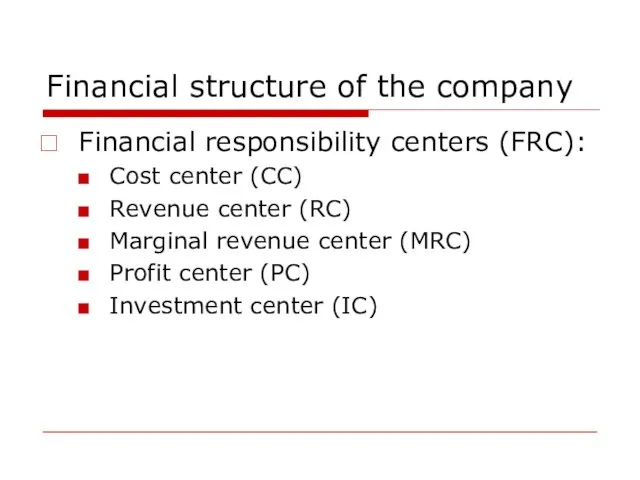
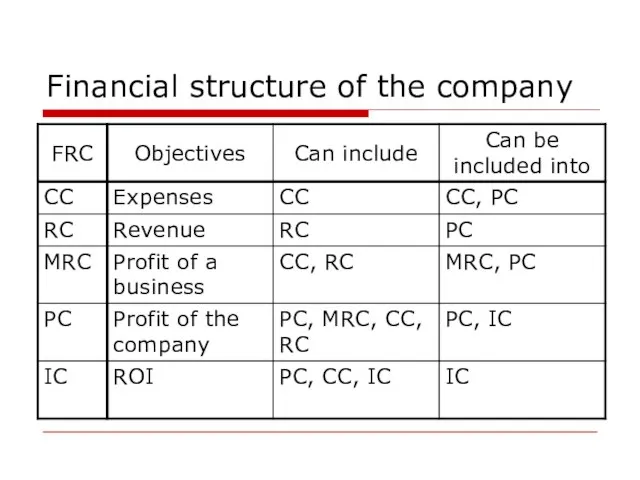
Слайд 10Financial structure of the company
Financial responsibility centers (FRC):
Cost center (CC)
Revenue center (RC)
Marginal
Financial structure of the company
Financial responsibility centers (FRC):
Cost center (CC)
Revenue center (RC)
Marginal
Слайд 11Financial structure of the company
Financial structure of the company
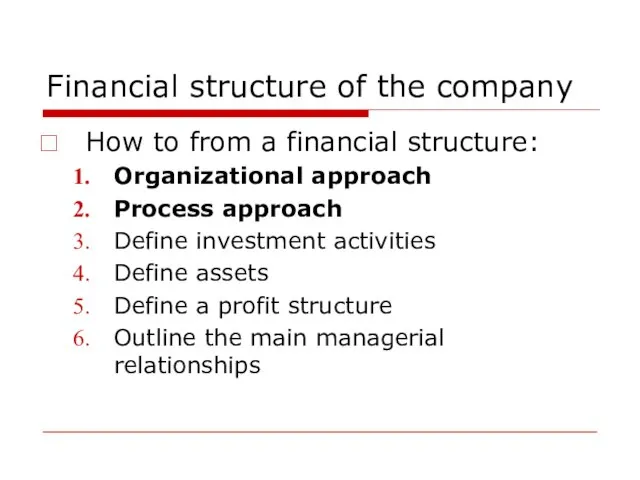
Слайд 12Financial structure of the company
How to from a financial structure:
Organizational approach
Process approach
Define
Financial structure of the company
How to from a financial structure:
Organizational approach
Process approach
Define
Слайд 13Organizational approach
An organizational structure is a mainly hierarchical concept of subordination of
Organizational approach
An organizational structure is a mainly hierarchical concept of subordination of
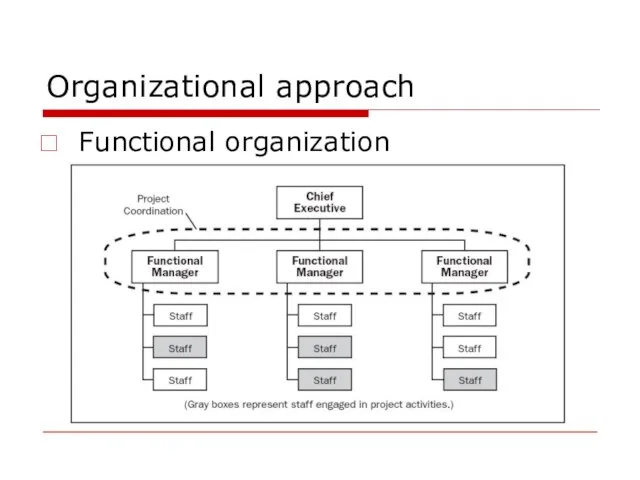
Слайд 14Organizational approach
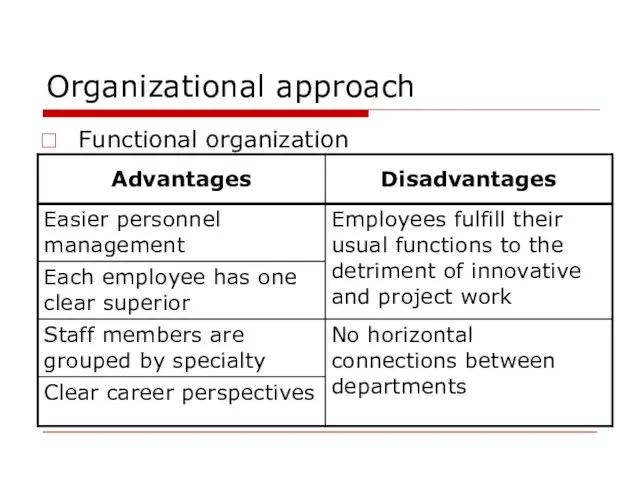
Functional organization
Organizational approach
Functional organization
Слайд 15Organizational approach
Functional organization
Organizational approach
Functional organization
Слайд 16Organizational approach
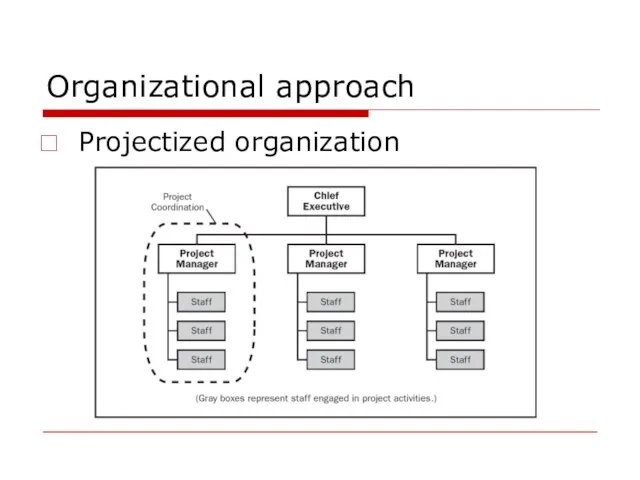
Projectized organization
Organizational approach
Projectized organization
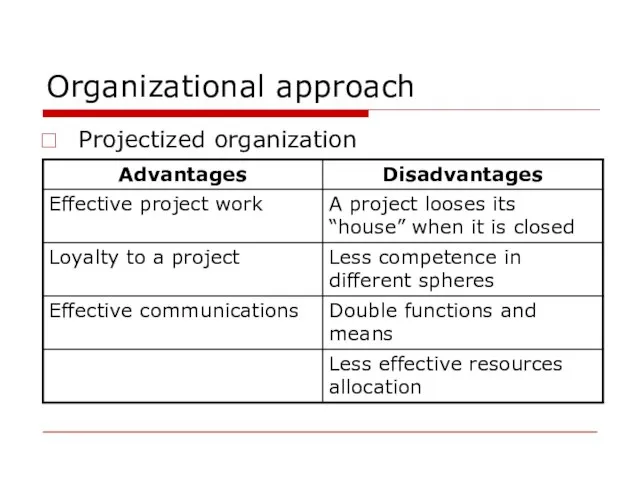
Слайд 17Organizational approach
Projectized organization
Organizational approach
Projectized organization
Слайд 18Organizational approach
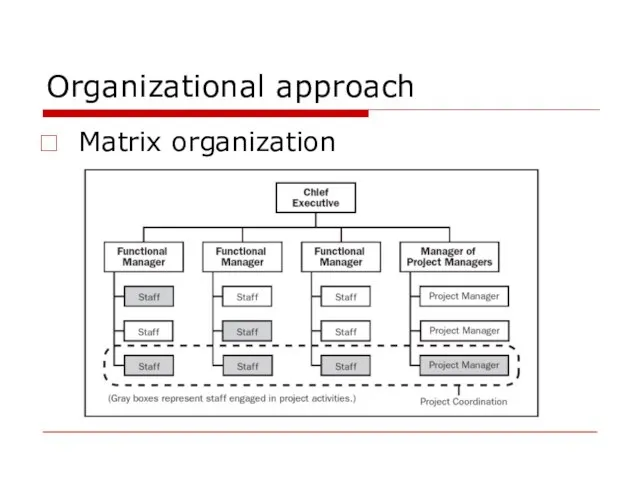
Matrix organization
Organizational approach
Matrix organization
Слайд 19Organizational approach
Matrix organization
Organizational approach
Matrix organization
Слайд 20Organizational approach
Financial
structure
PC
Director + Fin.Director
CC
Manufacturing
Workshop 1
Workshop 2
PC
Enterprises
Region 1
Region 2
MRC
Departments
Business 1
Business 2
RC
Sales Department
CC
Administration
Accounting
Development
IC
Projects
Project
Organizational approach
Financial
structure
PC
Director + Fin.Director
CC
Manufacturing
Workshop 1
Workshop 2
PC
Enterprises
Region 1
Region 2
MRC
Departments
Business 1
Business 2
RC
Sales Department
CC
Administration
Accounting
Development
IC
Projects
Project
Слайд 21Organizational approach
Differences between organizational and financial structures
Organizational approach
Differences between organizational and financial structures
Слайд 22Process approach
A process is an activity which transforms input into output.
A business
Process approach
A process is an activity which transforms input into output.
A business
Слайд 23Process scheme
Process scheme
Слайд 24Process approach
Business-process types:
Main
Supporting
Development
Corporate management
Process approach
Business-process types:
Main
Supporting
Development
Corporate management
Слайд 25Process approach
Process decomposition
Process 1
Process 2
Process 3
Process 2.1
Process 2.2
Process 2.3
Process 2.3.1
Recording
Process 2.3.2
Recording
Process 2.3.3
Recording
A0
Process approach
Process decomposition
Process 1
Process 2
Process 3
Process 2.1
Process 2.2
Process 2.3
Process 2.3.1
Recording
Process 2.3.2
Recording
Process 2.3.3
Recording
A0
Слайд 26Process approach
Business process and budgets
P&L
Balance
CF
Financial budgets
Operational budgets
Business-processes
Process approach
Business process and budgets
P&L
Balance
CF
Financial budgets
Operational budgets
Business-processes
Слайд 27BASIC PRINCIPLES OF FINANCIAL MANAGEMENT
BASIC PRINCIPLES OF FINANCIAL MANAGEMENT
Слайд 28Concept of cash flows
Cash turnover concept
Concept of cash flows
Cash turnover concept
Слайд 29Concept of cash flows
Cash flow - the movement of cash into or
Concept of cash flows
Cash flow - the movement of cash into or
Слайд 30Relationship between risk & profit
Nothing ventured, nothing gained
Britain’s Special Air Service
Relationship between risk & profit
Nothing ventured, nothing gained
Britain’s Special Air Service
Слайд 31ACCOUNTING SYSTEMS
ACCOUNTING SYSTEMS
Слайд 32Bookkeeping, financial & management accounting
Bookkeeping is the recording of day-to-day financial transactions
Bookkeeping, financial & management accounting
Bookkeeping is the recording of day-to-day financial transactions
Слайд 33Bookkeeping, financial & management accounting
Bookkeeping, financial & management accounting
Слайд 34Financial reporting standards used in Russia
Russian Accounting Standards (RAS) – accounting standards
Financial reporting standards used in Russia
Russian Accounting Standards (RAS) – accounting standards
Слайд 35Financial reporting standards used in Russia
Differences between RAS and IFRS
Financial reporting standards used in Russia
Differences between RAS and IFRS
Слайд 36Financial reporting standards used in Russia
Main concepts of the IFRS:
accrual basis
going
Financial reporting standards used in Russia
Main concepts of the IFRS:
accrual basis
going
Слайд 37FINANCIAL STATEMENTS
FINANCIAL STATEMENTS
Слайд 38Annual reports
Annual reports
Слайд 39BALANCE SHEET
BALANCE SHEET

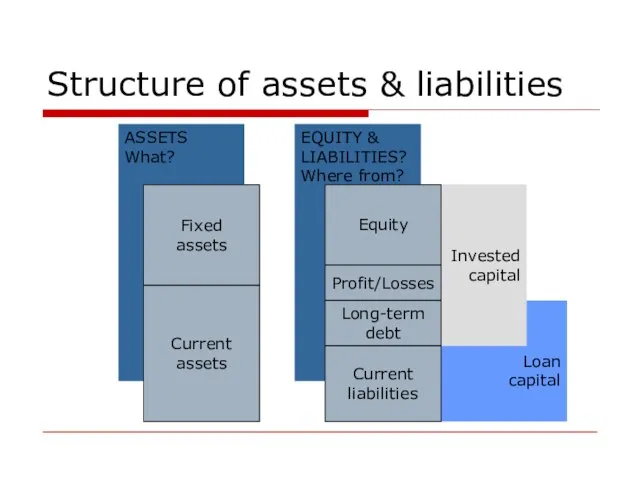
Слайд 40Loan
capital
Invested
capital
EQUITY &
LIABILITIES?
Where from?
ASSETS
What?
Structure of assets & liabilities
Fixed
assets
Current
assets
Equity
Profit/Losses
Long-term
debt
Current
liabilities
Invested
capital
EQUITY &
LIABILITIES?
Where from?
ASSETS
What?
Structure of assets & liabilities
Fixed
assets
Current
assets
Equity
Profit/Losses
Long-term
debt
Current
liabilities
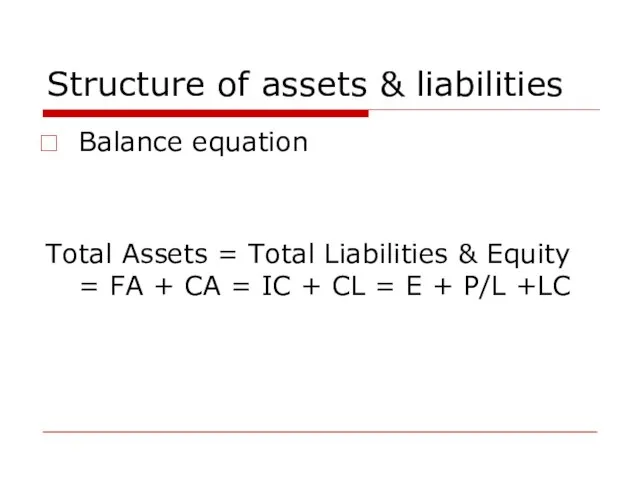
Слайд 41Structure of assets & liabilities
Balance equation
Total Assets = Total Liabilities & Equity
Structure of assets & liabilities
Balance equation
Total Assets = Total Liabilities & Equity
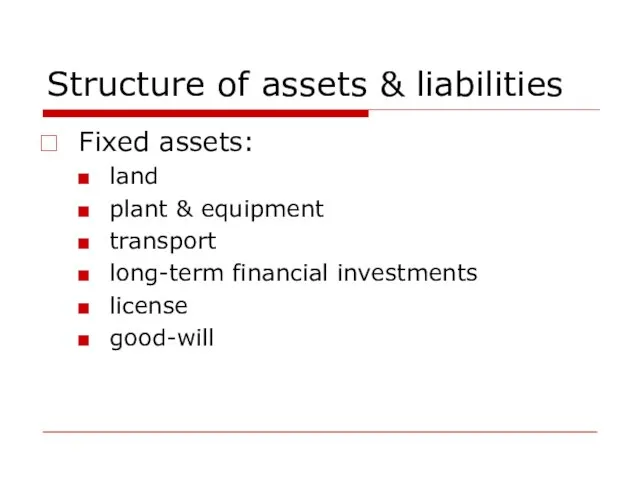
Слайд 42Structure of assets & liabilities
Fixed assets:
land
plant & equipment
transport
long-term financial investments
license
good-will
Structure of assets & liabilities
Fixed assets:
land
plant & equipment
transport
long-term financial investments
license
good-will
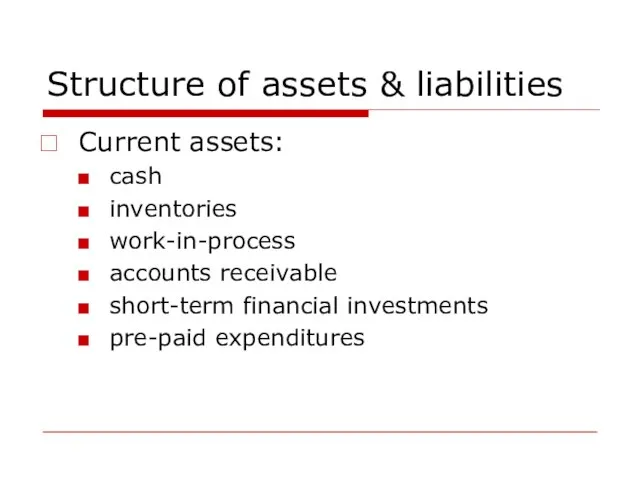
Слайд 43Structure of assets & liabilities
Current assets:
cash
inventories
work-in-process
accounts receivable
short-term financial investments
pre-paid expenditures
Structure of assets & liabilities
Current assets:
cash
inventories
work-in-process
accounts receivable
short-term financial investments
pre-paid expenditures
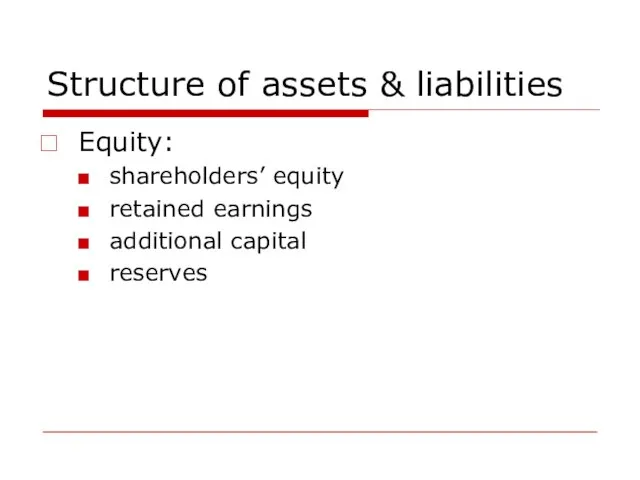
Слайд 44Structure of assets & liabilities
Equity:
shareholders’ equity
retained earnings
additional capital
reserves
Structure of assets & liabilities
Equity:
shareholders’ equity
retained earnings
additional capital
reserves
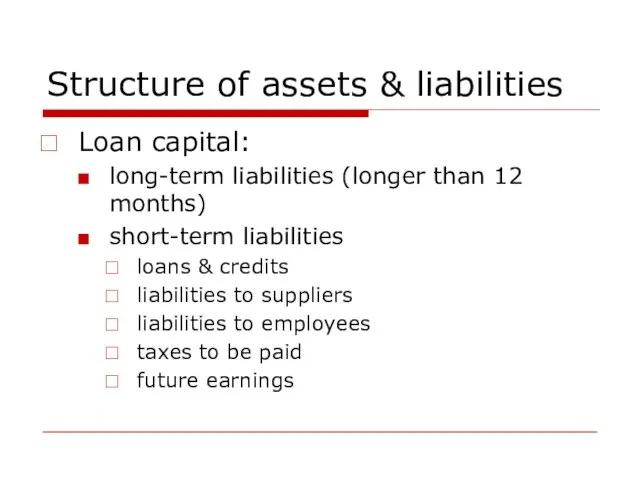
Слайд 45Structure of assets & liabilities
Loan capital:
long-term liabilities (longer than 12 months)
short-term liabilities
loans
Structure of assets & liabilities
Loan capital:
long-term liabilities (longer than 12 months)
short-term liabilities
loans
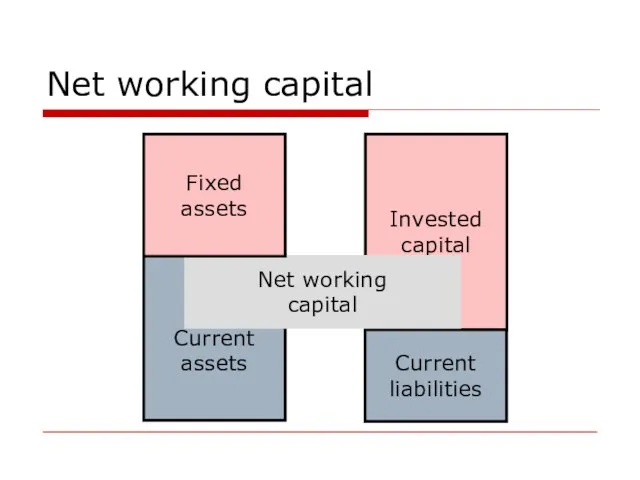
Слайд 46Net working capital
Invested
capital
Current
assets
Current
liabilities
Net working
capital
Fixed
assets
Net working capital
Invested
capital
Current
assets
Current
liabilities
Net working
capital
Fixed
assets
Слайд 47Net working capital
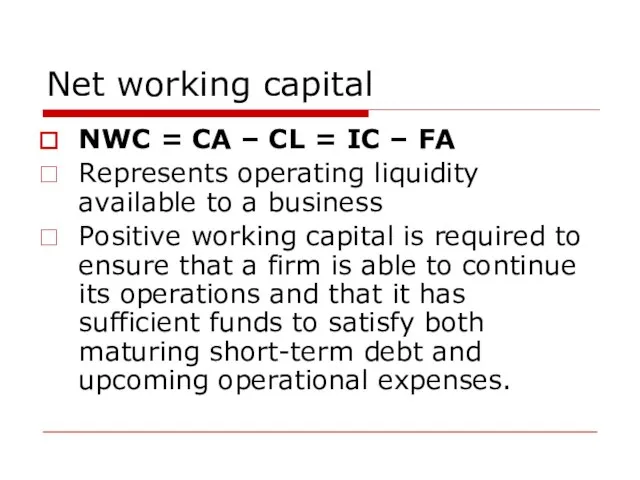
NWC = CA – CL = IC – FA
Represents operating
Net working capital
NWC = CA – CL = IC – FA
Represents operating
Слайд 48INCOME STATEMENT
INCOME STATEMENT

Слайд 49Income statement
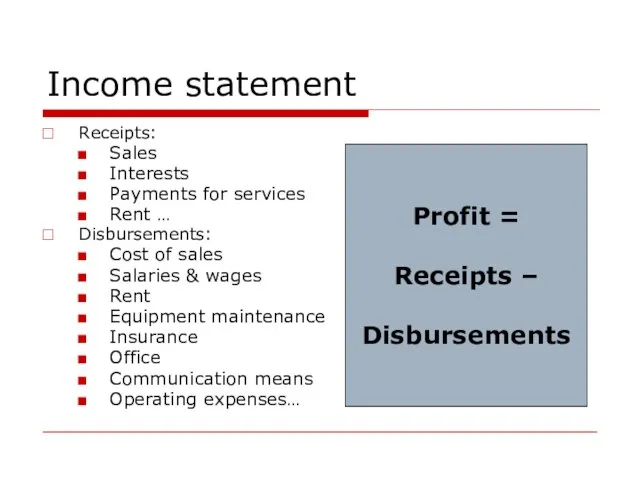
Receipts:
Sales
Interests
Payments for services
Rent …
Disbursements:
Cost of sales
Salaries & wages
Rent
Equipment maintenance
Insurance
Office
Communication means
Operating expenses…
Profit
Income statement
Receipts:
Sales
Interests
Payments for services
Rent …
Disbursements:
Cost of sales
Salaries & wages
Rent
Equipment maintenance
Insurance
Office
Communication means
Operating expenses…
Profit
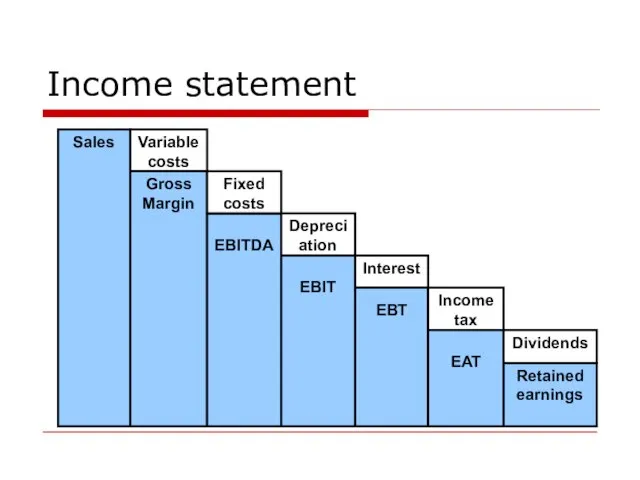
Слайд 50Income statement
Income statement
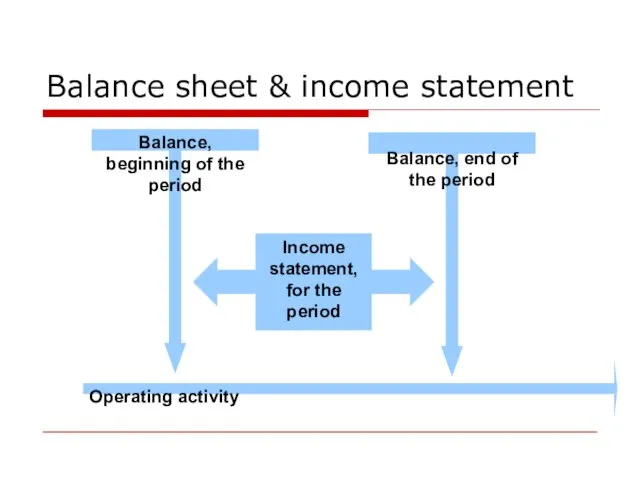
Слайд 51Balance sheet & income statement
Balance sheet & income statement
Слайд 52Balance sheet & income statement
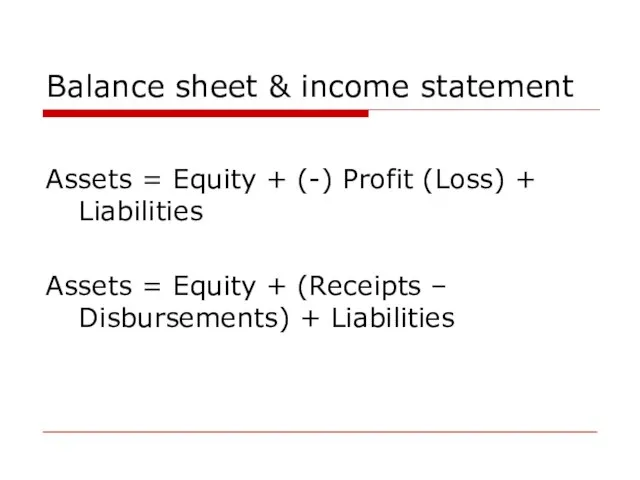
Assets = Equity + (-) Profit (Loss) +
Balance sheet & income statement
Assets = Equity + (-) Profit (Loss) +
Слайд 53STATEMENT OF CASH FLOWS
STATEMENT OF CASH FLOWS
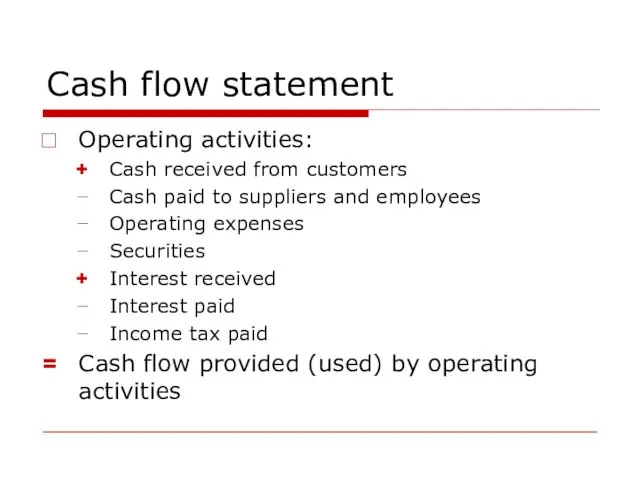
Слайд 54Cash flow statement
Operating activities:
Cash received from customers
Cash paid to suppliers and employees
Cash flow statement
Operating activities:
Cash received from customers
Cash paid to suppliers and employees
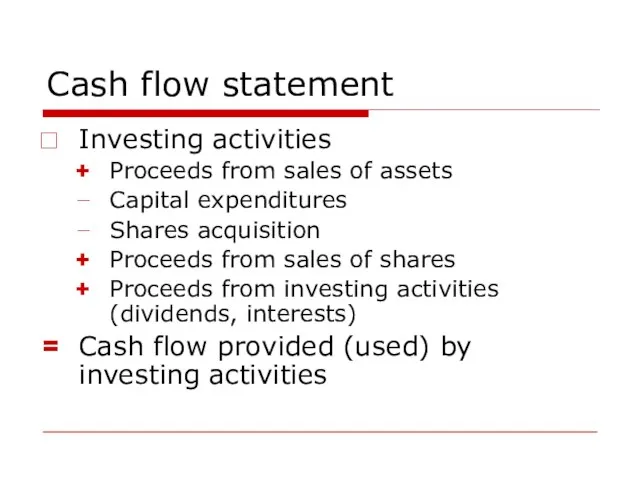
Слайд 55Cash flow statement
Investing activities
Proceeds from sales of assets
Capital expenditures
Shares acquisition
Proceeds from sales
Cash flow statement
Investing activities
Proceeds from sales of assets
Capital expenditures
Shares acquisition
Proceeds from sales
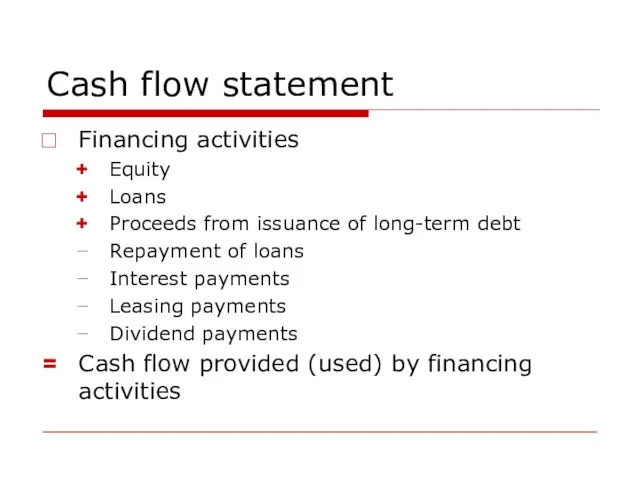
Слайд 56Cash flow statement
Financing activities
Equity
Loans
Proceeds from issuance of long-term debt
Repayment of loans
Interest
Cash flow statement
Financing activities
Equity
Loans
Proceeds from issuance of long-term debt
Repayment of loans
Interest
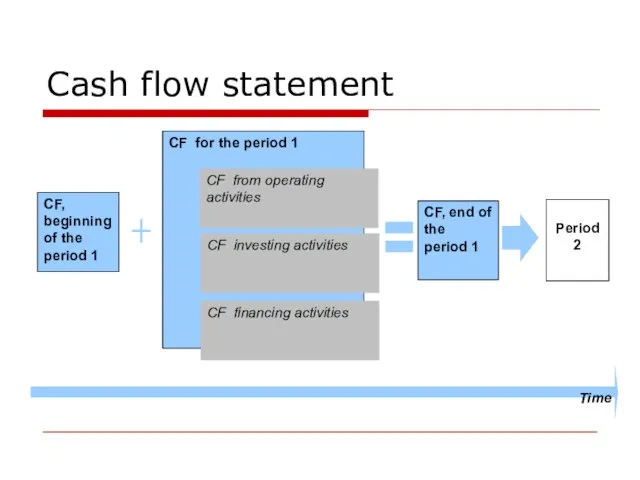
Слайд 57Cash flow statement
Cash flow statement
Слайд 58Cash flow statement
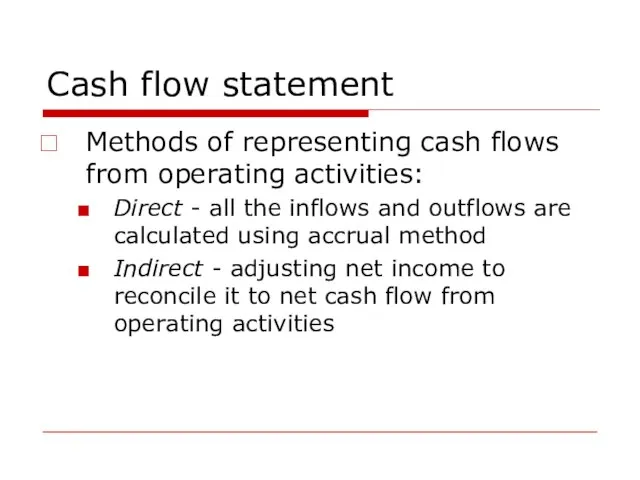
Methods of representing cash flows from operating activities:
Direct -
Cash flow statement
Methods of representing cash flows from operating activities:
Direct -
Слайд 59Cash flow statement
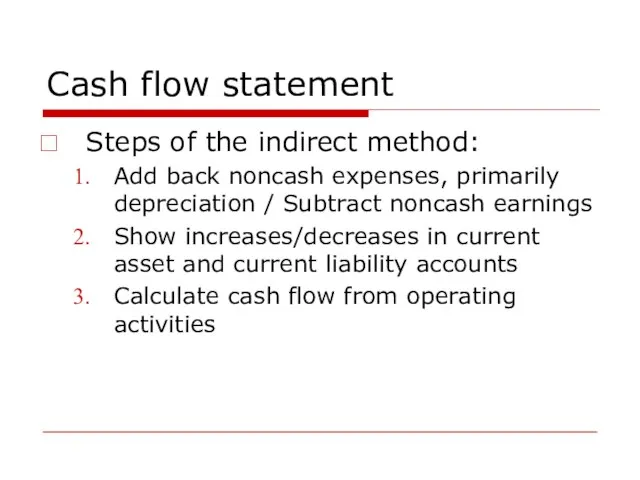
Steps of the indirect method:
Add back noncash expenses, primarily depreciation
Cash flow statement
Steps of the indirect method:
Add back noncash expenses, primarily depreciation
Слайд 60Cash flow statement
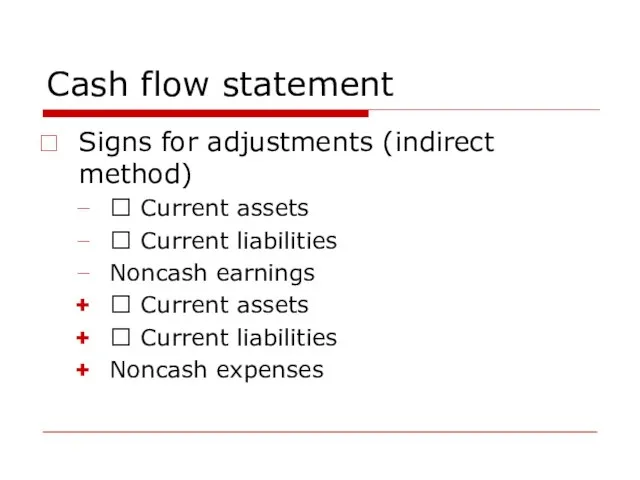
Signs for adjustments (indirect method)
? Current assets
? Current liabilities
Noncash earnings
?
Cash flow statement
Signs for adjustments (indirect method)
? Current assets
? Current liabilities
Noncash earnings
?
Слайд 61Cash flow statement
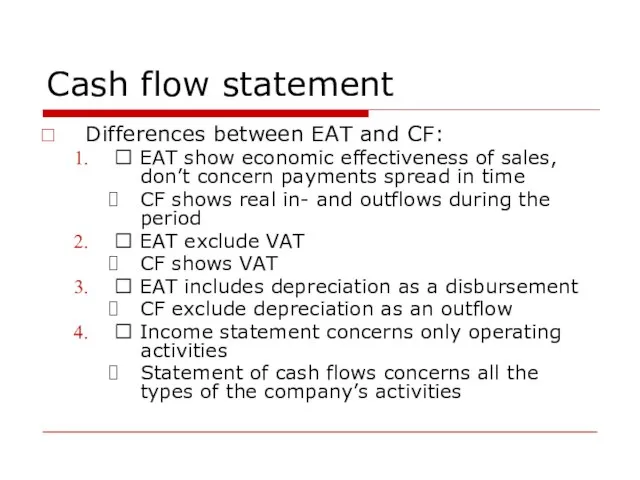
Differences between EAT and CF:
? EAT show economic effectiveness of
Cash flow statement
Differences between EAT and CF:
? EAT show economic effectiveness of
Слайд 62FINANCIAL ANALYSIS
FINANCIAL ANALYSIS
Слайд 63BASIC PRINCIPLES
BASIC PRINCIPLES

Слайд 64Financial ratios
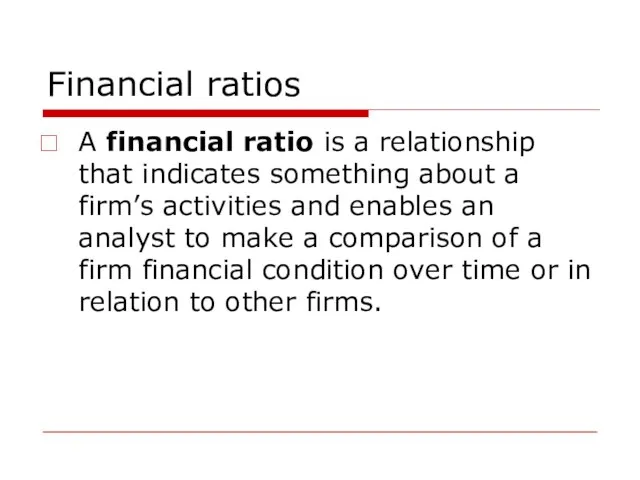
A financial ratio is a relationship that indicates something about a
Financial ratios
A financial ratio is a relationship that indicates something about a
Слайд 65Financial ratios
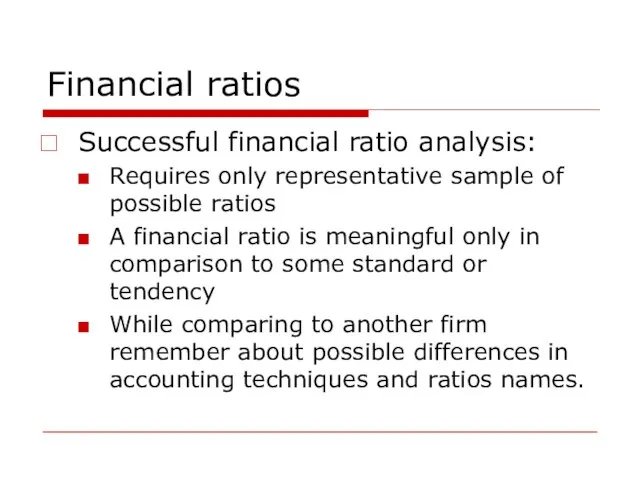
Successful financial ratio analysis:
Requires only representative sample of possible ratios
A financial
Financial ratios
Successful financial ratio analysis:
Requires only representative sample of possible ratios
A financial
Слайд 66Financial ratios
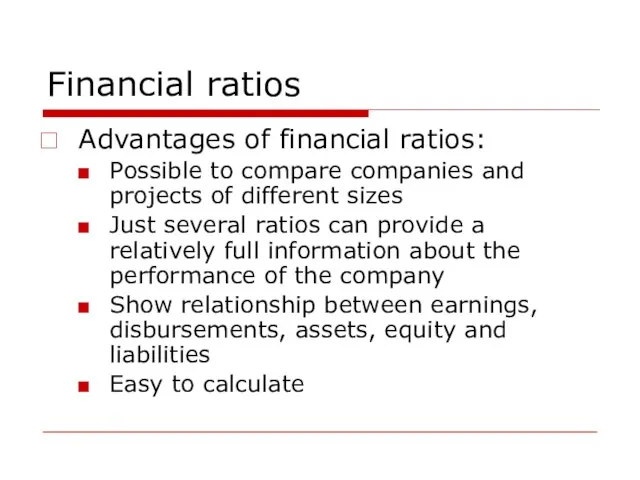
Advantages of financial ratios:
Possible to compare companies and projects of different
Financial ratios
Advantages of financial ratios:
Possible to compare companies and projects of different
Слайд 67Financial ratios
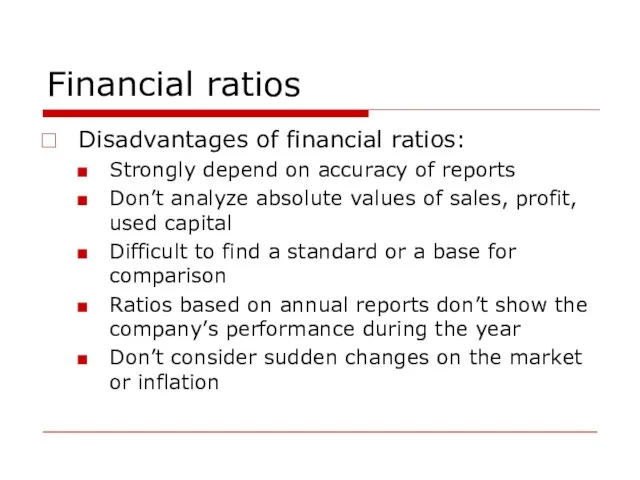
Disadvantages of financial ratios:
Strongly depend on accuracy of reports
Don’t analyze absolute
Financial ratios
Disadvantages of financial ratios:
Strongly depend on accuracy of reports
Don’t analyze absolute
Слайд 68Financial ratios
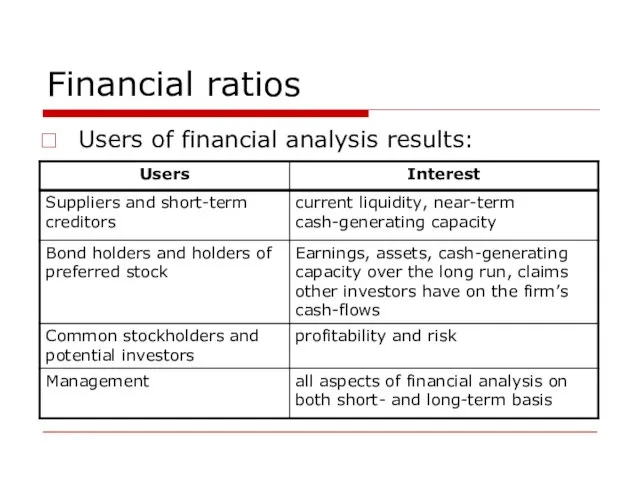
Users of financial analysis results:
Financial ratios
Users of financial analysis results:
Слайд 69FIVE GROUPS OF FINANCIAL RAIOS
FIVE GROUPS OF FINANCIAL RAIOS
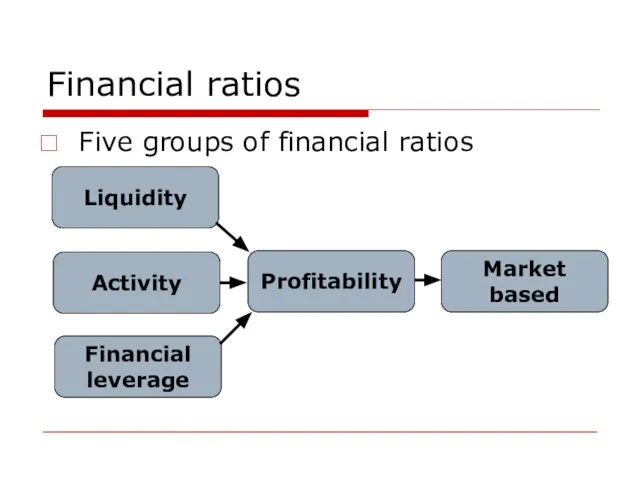
Слайд 70Financial ratios
Five groups of financial ratios
Profitability
Liquidity
Activity
Financial
leverage
Market
based
Financial ratios
Five groups of financial ratios
Profitability
Liquidity
Activity
Financial
leverage
Market
based
Слайд 71Liquidity ratios
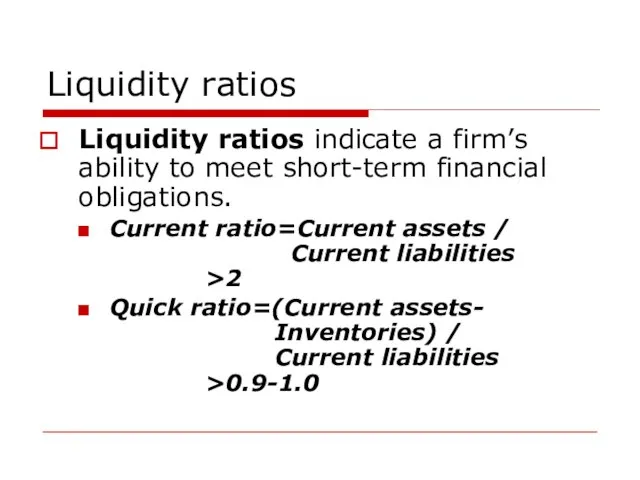
Liquidity ratios indicate a firm’s ability to meet short-term financial obligations.
Current
Liquidity ratios
Liquidity ratios indicate a firm’s ability to meet short-term financial obligations.
Current
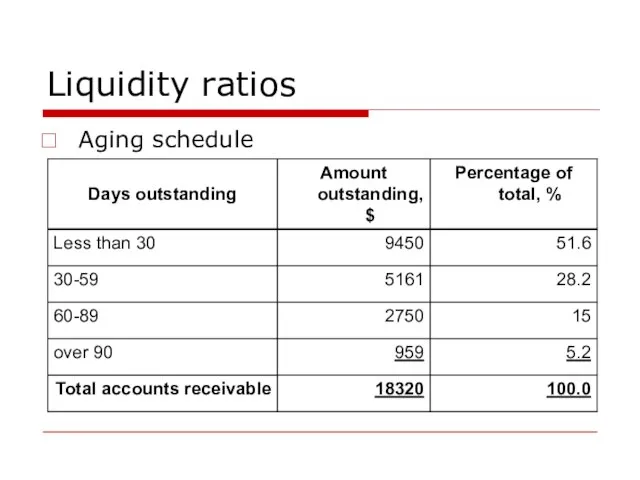
Слайд 72Liquidity ratios
Aging schedule
Liquidity ratios
Aging schedule
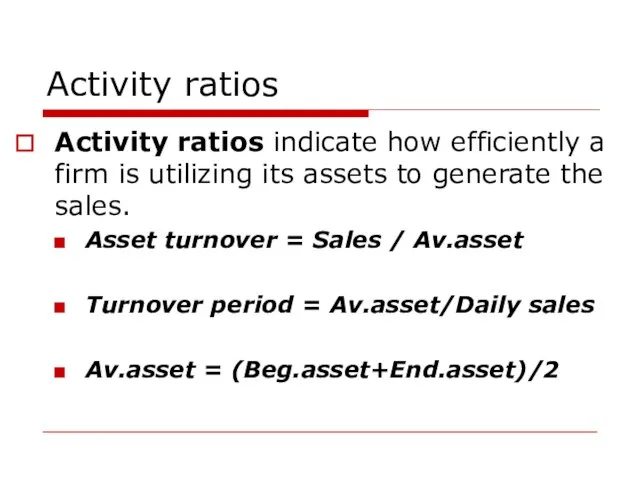
Слайд 73Activity ratios
Activity ratios indicate how efficiently a firm is utilizing its assets
Activity ratios
Activity ratios indicate how efficiently a firm is utilizing its assets
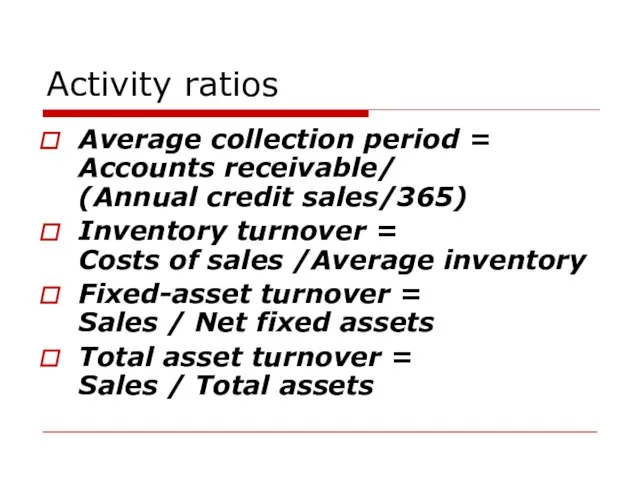
Слайд 74Activity ratios
Average collection period = Accounts receivable/
(Annual credit sales/365)
Inventory turnover =
Costs
Activity ratios
Average collection period = Accounts receivable/
(Annual credit sales/365)
Inventory turnover =
Costs
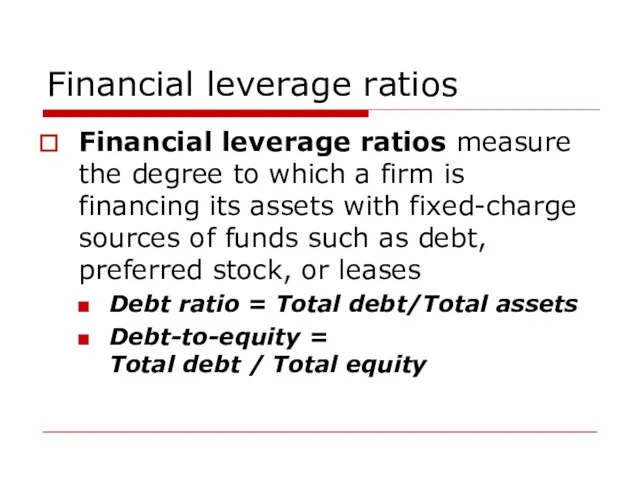
Слайд 75Financial leverage ratios
Financial leverage ratios measure the degree to which a firm
Financial leverage ratios
Financial leverage ratios measure the degree to which a firm
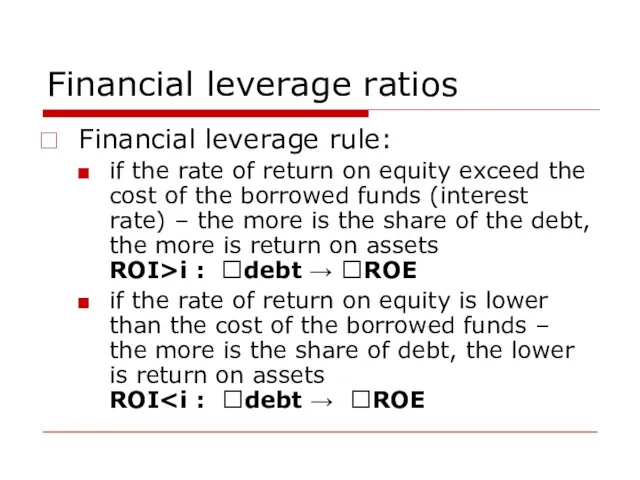
Слайд 76Financial leverage ratios
Financial leverage rule:
if the rate of return on equity exceed
Financial leverage ratios
Financial leverage rule:
if the rate of return on equity exceed
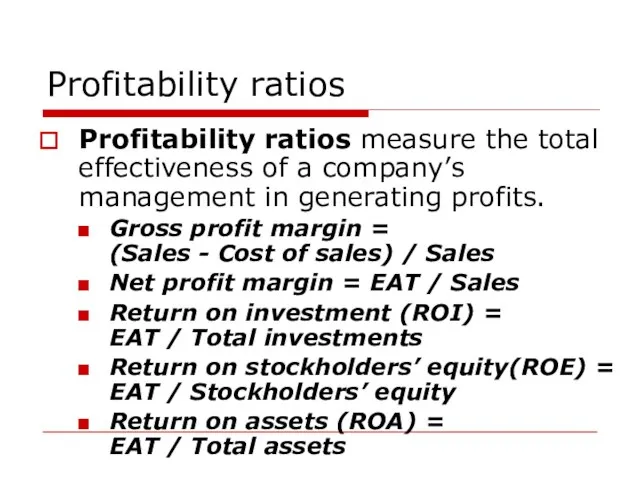
Слайд 77Profitability ratios
Profitability ratios measure the total effectiveness of a company’s management in
Profitability ratios
Profitability ratios measure the total effectiveness of a company’s management in
Слайд 78Market-based ratios
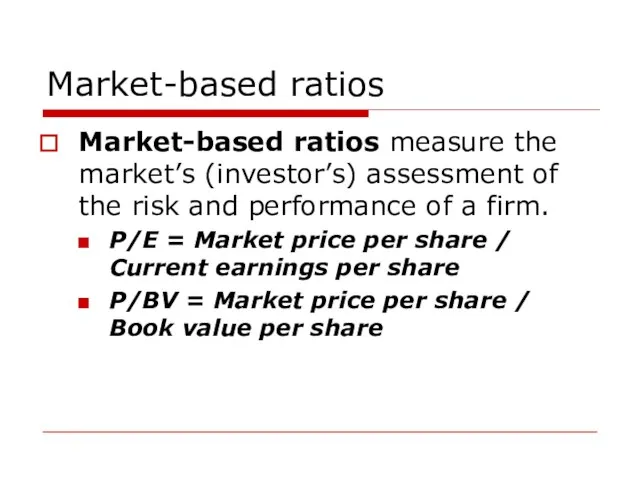
Market-based ratios measure the market’s (investor’s) assessment of the risk and
Market-based ratios
Market-based ratios measure the market’s (investor’s) assessment of the risk and
Слайд 79SOME METHODS OF FINANCIAL ANALYSIS
SOME METHODS OF FINANCIAL ANALYSIS
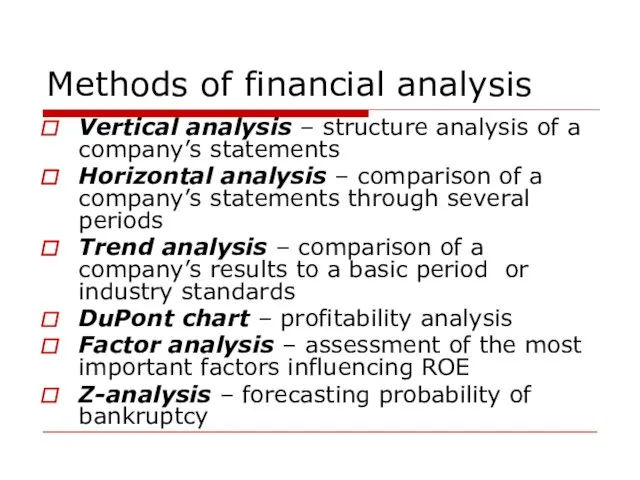
Слайд 80Methods of financial analysis
Vertical analysis – structure analysis of a company’s statements
Horizontal
Methods of financial analysis
Vertical analysis – structure analysis of a company’s statements
Horizontal
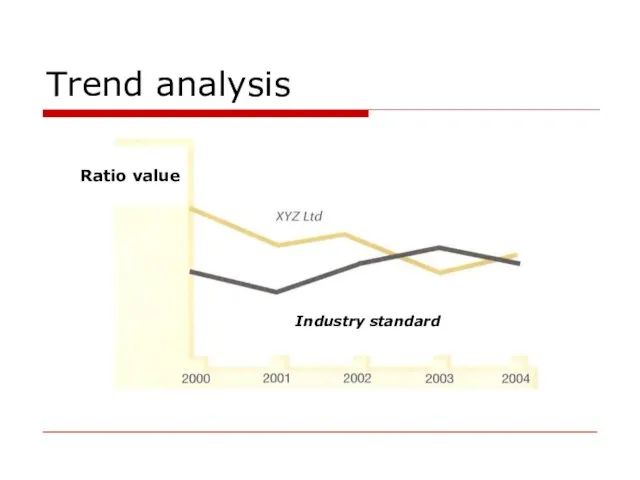
Слайд 81Trend analysis
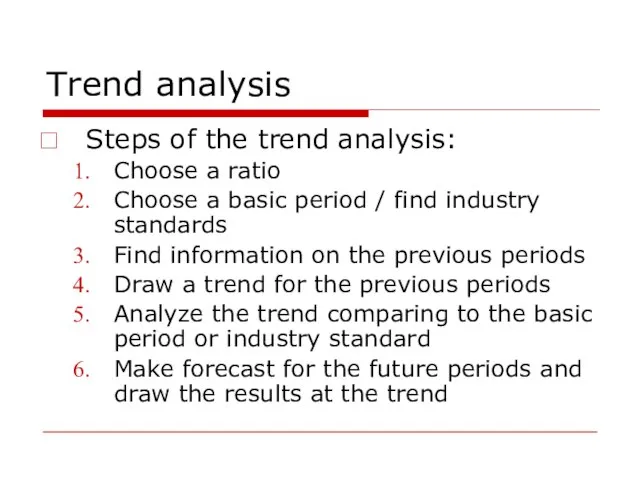
Steps of the trend analysis:
Choose a ratio
Choose a basic period /
Trend analysis
Steps of the trend analysis:
Choose a ratio
Choose a basic period /
Слайд 82Trend analysis
Ratio value
Industry standard
Trend analysis
Ratio value
Industry standard
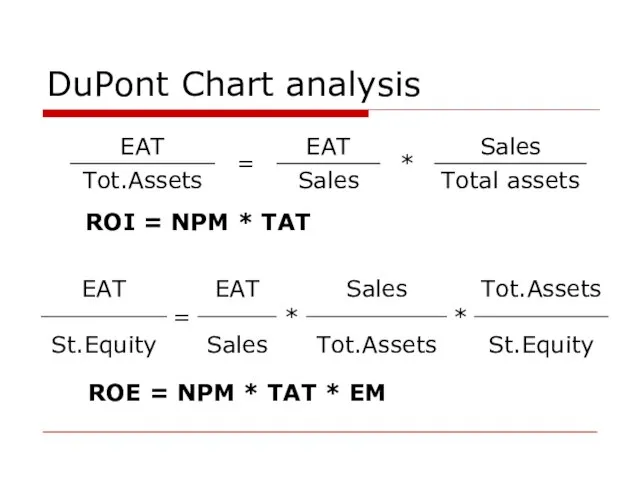
Слайд 83DuPont Chart analysis
ROI = NPM * TAT
ROE = NPM * TAT *
DuPont Chart analysis
ROI = NPM * TAT
ROE = NPM * TAT *
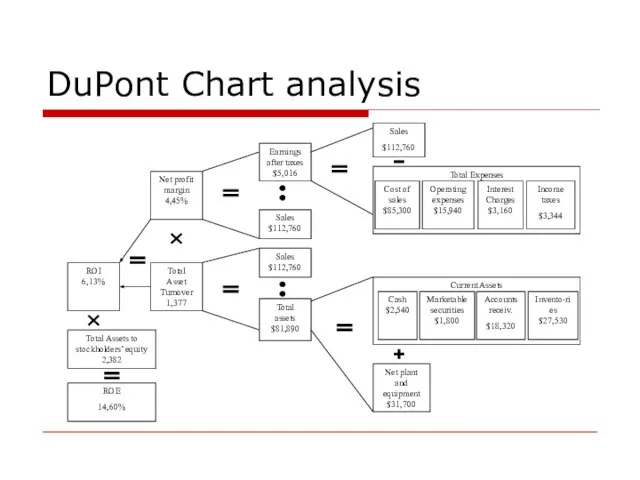
Слайд 84DuPont Chart analysis
Net profit margin
4,45%
Total Asset Turnover
1,377
Earnings after taxes
$5,016
Sales
$112,760
Sales
$112,760
Total assets
$81,890
Sales
$112,760
Total Expenses
Cost of
DuPont Chart analysis
Net profit margin
4,45%
Total Asset Turnover
1,377
Earnings after taxes
$5,016
Sales
$112,760
Sales
$112,760
Total assets
$81,890
Sales
$112,760
Total Expenses
Cost of
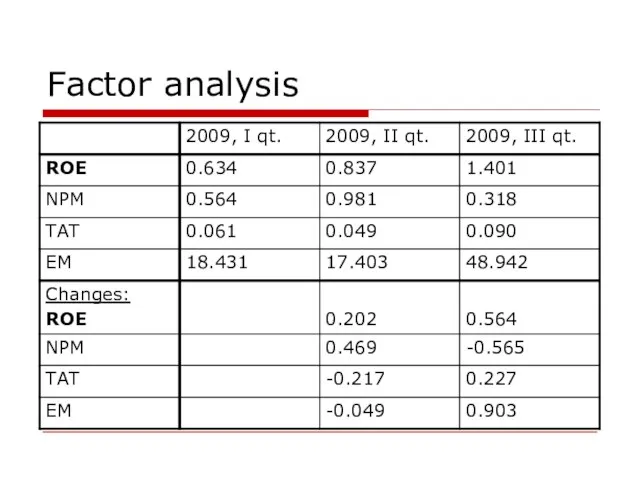
Слайд 85Factor analysis
Factor analysis
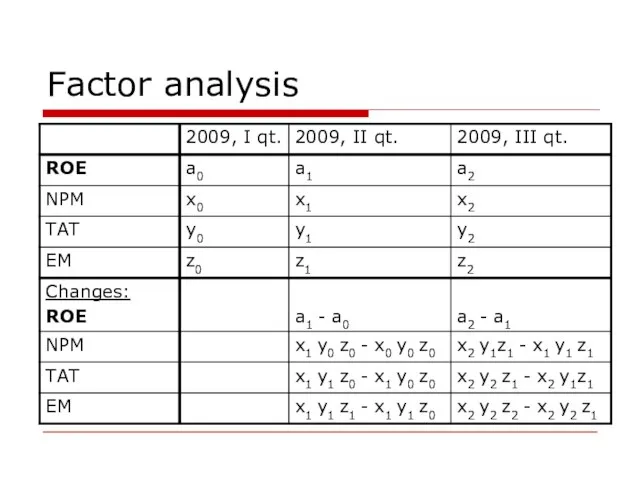
Слайд 86Factor analysis
Factor analysis
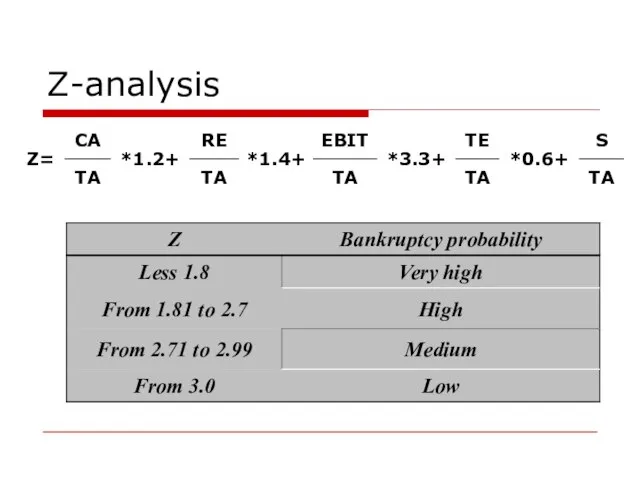
Слайд 87Z-analysis
Z-analysis
Слайд 88CASH FLOW MANAGEMENT
CASH FLOW MANAGEMENT
Слайд 89NET CASH FLOW
NET CASH FLOW
Слайд 90Cash as a company’s working capital
Cash as a company’s working capital
Слайд 91Cash as a company’s working capital
Cash volume depends on:
Production phase
Sales
Collection of accounts
Cash as a company’s working capital
Cash volume depends on:
Production phase
Sales
Collection of accounts
Слайд 92Cash as a company’s working capital
Control of a cash rest
Cash
rest,
RUR
External
Cash as a company’s working capital
Control of a cash rest
Cash
rest,
RUR
External
Слайд 93Cash as a company’s working capital
Cash turnover cycle
Cash as a company’s working capital
Cash turnover cycle
Слайд 94Accounts
payable
payment
period
Accounts
receivable
collection
period
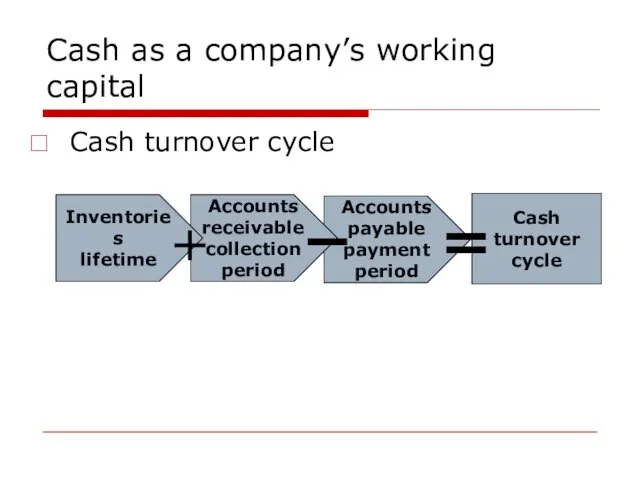
Cash as a company’s working capital
Cash turnover cycle
Inventories
lifetime
Cash
turnover
cycle
Accounts
payable
payment
period
Accounts
receivable
collection
period
Cash as a company’s working capital
Cash turnover cycle
Inventories
lifetime
Cash
turnover
cycle
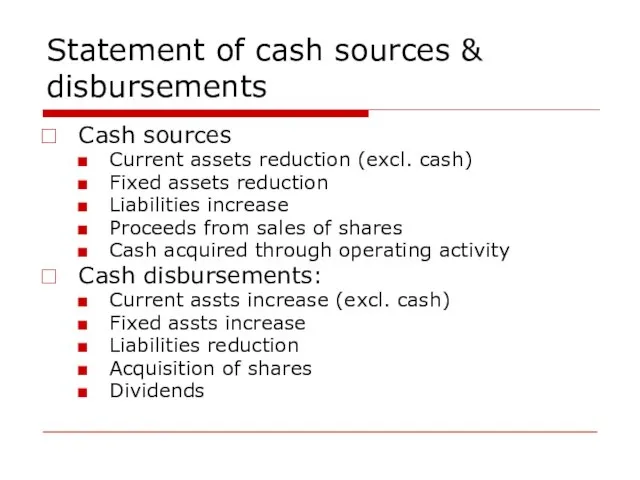
Слайд 95Statement of cash sources & disbursements
Cash sources
Current assets reduction (excl. cash)
Fixed assets
Statement of cash sources & disbursements
Cash sources
Current assets reduction (excl. cash)
Fixed assets
Слайд 96Depreciation
Depreciation norm depends on:
Initial
Lifetime:
Technical
Effective
Rest cost
Method of depreciation:
Straight line
Accelerated
Depreciation
Depreciation norm depends on:
Initial
Lifetime:
Technical
Effective
Rest cost
Method of depreciation:
Straight line
Accelerated
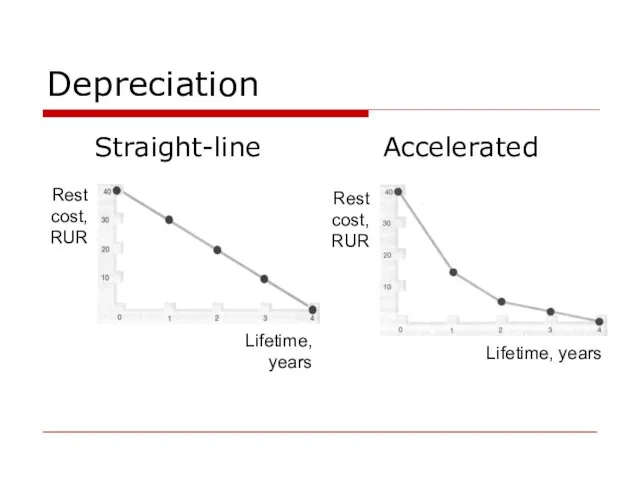
Слайд 97Depreciation
Straight-line
Accelerated
Depreciation
Straight-line
Accelerated
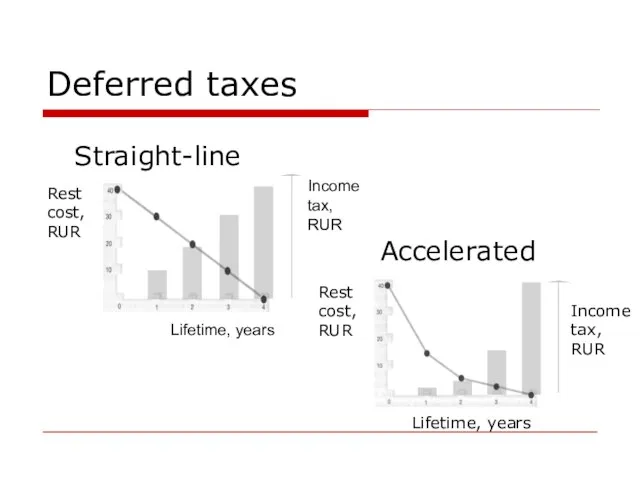
Слайд 98Deferred taxes
Straight-line
Accelerated
Deferred taxes
Straight-line
Accelerated
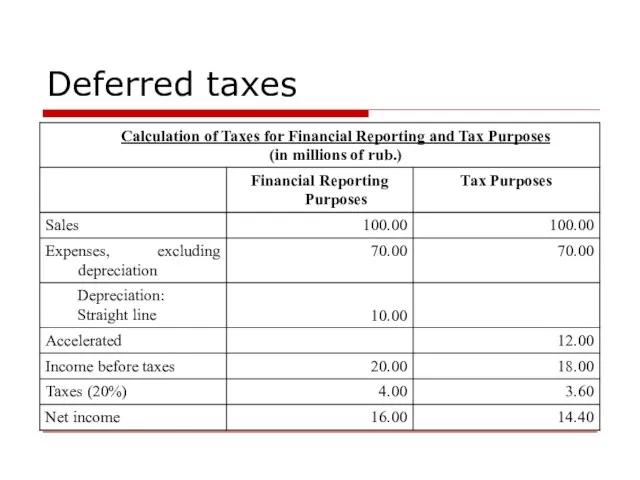
Слайд 99Deferred taxes
Deferred taxes
Слайд 100CASH FLOW FORECASTING
CASH FLOW FORECASTING
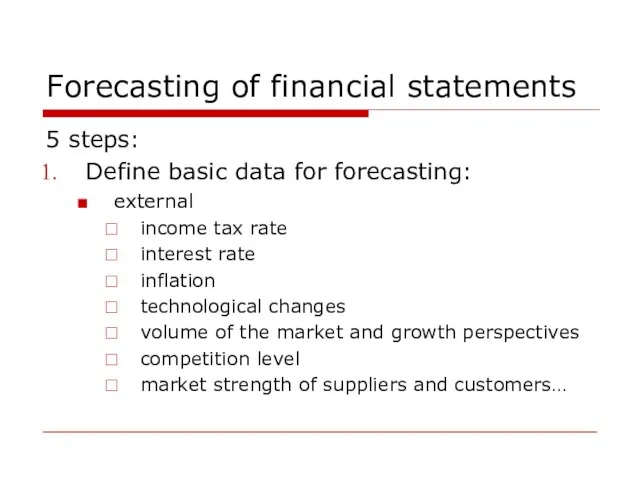
Слайд 101Forecasting of financial statements
5 steps:
Define basic data for forecasting:
external
income tax rate
interest rate
inflation
technological
Forecasting of financial statements
5 steps:
Define basic data for forecasting:
external
income tax rate
interest rate
inflation
technological
Слайд 102Forecasting of financial statements
internal:
investments policy
external financing policy
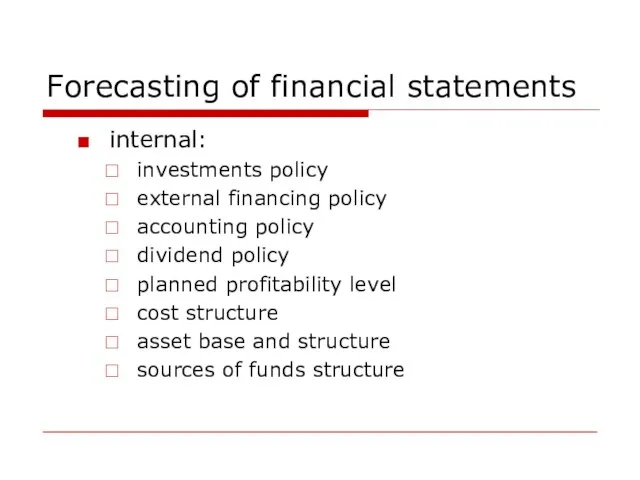
accounting policy
dividend policy
planned profitability level
cost structure
asset
Forecasting of financial statements
internal:
investments policy
external financing policy
accounting policy
dividend policy
planned profitability level
cost structure
asset
Слайд 103Forecasting of financial statements
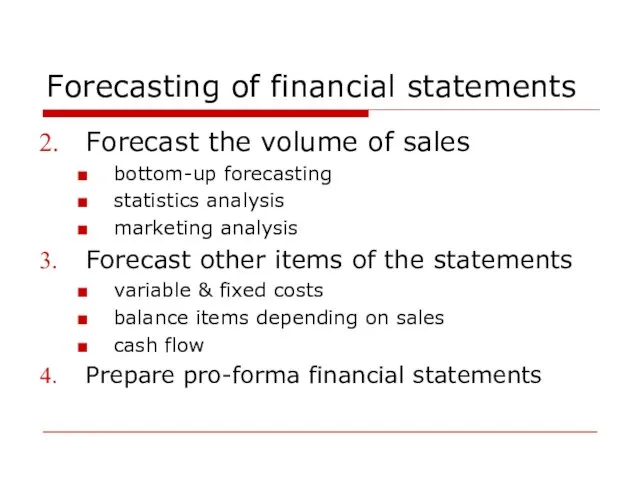
Forecast the volume of sales
bottom-up forecasting
statistics analysis
marketing analysis
Forecast other
Forecasting of financial statements
Forecast the volume of sales
bottom-up forecasting
statistics analysis
marketing analysis
Forecast other
Слайд 104Forecasting of financial statements
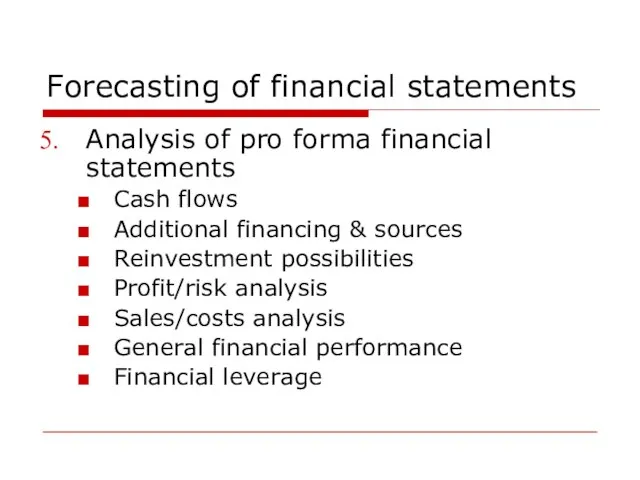
Analysis of pro forma financial statements
Cash flows
Additional financing &
Forecasting of financial statements
Analysis of pro forma financial statements
Cash flows
Additional financing &
Слайд 105Percentage of sales forecasting method
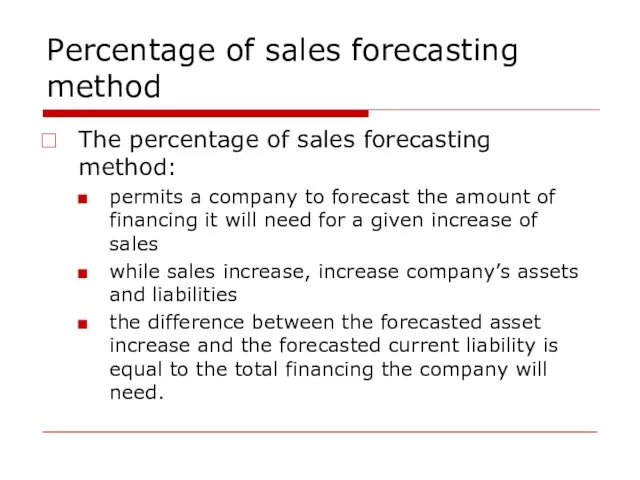
The percentage of sales forecasting method:
permits a
Percentage of sales forecasting method
The percentage of sales forecasting method:
permits a
Слайд 106Percentage of sales forecasting method
Internal net cash provided = Forecasted CF -
Percentage of sales forecasting method
Internal net cash provided = Forecasted CF -
Слайд 107Percentage of sales forecasting method
To support the sales increase the management of
Percentage of sales forecasting method
To support the sales increase the management of
Слайд 108Budgeting
Five steps in preparing a budget
Budgeting
Five steps in preparing a budget
Слайд 109COSTS PLANNING
COSTS PLANNING
Слайд 110Types of costs
Variable costs are expenses that change in proportion to the
Types of costs
Variable costs are expenses that change in proportion to the
Слайд 111Types of costs
Dependence of per unit cost on the volume of production
Per
Types of costs
Dependence of per unit cost on the volume of production
Per
Слайд 112Types of costs
Total costs / quantity
TC =
FC + (VC*Q)
Total costs, RUR
Quantity, units
Fixed
Types of costs
Total costs / quantity
TC =
FC + (VC*Q)
Total costs, RUR
Quantity, units
Fixed
Слайд 113Cost structure
A cost is the value of money that has been used
Cost structure
A cost is the value of money that has been used
Слайд 114Cost structure
Costs usually charged directly
Project staff
Consultants
Project supplies
Publications
Travel
Training
Cost structure
Costs usually charged directly
Project staff
Consultants
Project supplies
Publications
Travel
Training
 ПОРТФОЛИО ВОСПИТАТЕЛЯ
 Презентация на тему Минойская цивилизация
  PHIL 1- Lecture 3 - Week 3 moodle
 Железнодорожный тоннель
 Использование проектной методики в обучении иностранному языку
 Система права
 Гигиена питания
 Гигиена коз и овец
 Использование ФЦИОР на уроках физики
 Налоговый вычет по ценным бумагам
 Доли федеральных телеканалов при национальном и региональном размещении рекламы
 Презентация WasteVEM процесса
 Фея Флора. Богиня цветов и весны. С приходом весны властвовала над всеми живыми существами. Имя образовано от flos ("цветок"). По леген
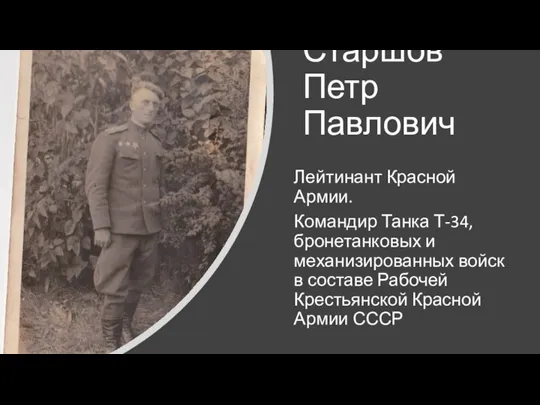 Старшов Петр Павлович
 Классицизм в литературе
 Методическая тема
 He’s. She
 Программа коррекции синдрова эмоционального выгорания и повышения стрессоустойчивости личности
 Пирог Ленивец
 Учебный семинар «Формирование универсальных учебных действий на уроках в начальной школе»
 Диалог о вредной привычке.
 Права та обовязки споживачів
 Mother teresa
 Удаление третьих моляров верхней и нижней челюсти. Ретенция и дистопия зубов мудрости
 Мыс өндіріс қалдықтарынан түсті металл тұздарын алуды жобалау
 Персональное предложение по регистрации товарного знака Баранкино для ИП (ООО) Под ключ
 Семь дней недели