- Index numbers (lecture 4)

Содержание
- 2. LECTURE 4 INDEX NUMBERS Temur Makhkamov Indira Khadjieva QM Module Leaders [email protected] [email protected] Office hours: by
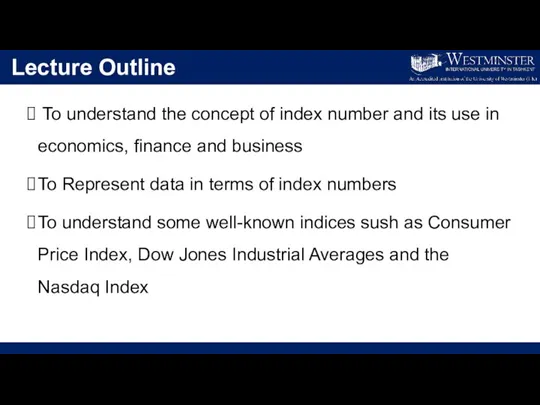
- 3. Lecture Outline To understand the concept of index number and its use in economics, finance and
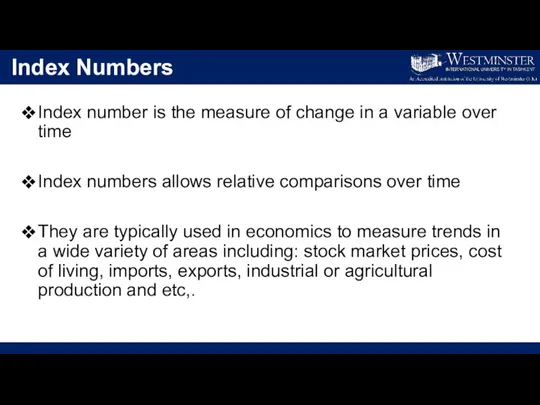
- 4. Index Numbers Index number is the measure of change in a variable over time Index numbers
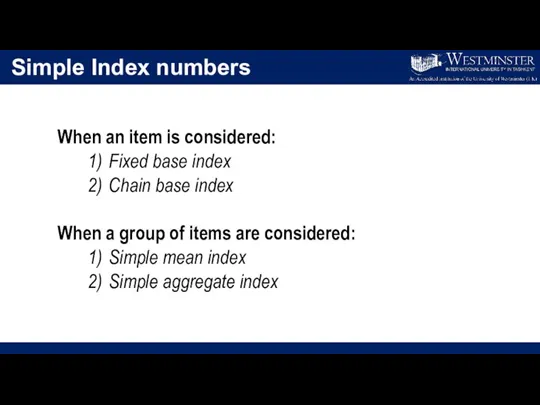
- 5. Simple Index numbers When an item is considered: 1) Fixed base index 2) Chain base index
- 6. AAPL Income Statement
- 7. Fixed Base Index Definition: each value is compared with a value in the same (fixed) base
- 8. AAPL Income statement: Fixed Base Index
- 9. Chain Base Index Definition each value is compared with a value in the preceding period Where
- 10. AAPL Income statement: Chain Base Index
- 11. Hypothetical Index Composites
- 12. Simple Aggregate Index
- 13. Simple Aggregate Index Definition the index is calculated by finding the ratio of the sum of
- 14. Simple Mean Index Definition the index is calculated by finding the average (mean) of all the
- 15. Simple Mean Index
- 16. The Consumer Prices Index Consumer Price Index (CPI) - is defined as the change in the
- 17. Dow Jones Industrial Averages The Dow Jones Industrial Average (DJIA) - price-weighted average of 30 blue-chip
- 18. The Nasdaq Index The Nasdaq 100 includes the shares of the 100 largest American and international
- 19. Concluding remarks Today, you learnt: The method of indexing data The different types of indices used
- 21. Скачать презентацию
Слайд 2LECTURE 4
INDEX NUMBERS
Temur Makhkamov
Indira Khadjieva
QM Module Leaders
[email protected]
[email protected]
Office hours: by appointment
Room
LECTURE 4
INDEX NUMBERS
Temur Makhkamov
Indira Khadjieva
QM Module Leaders
[email protected]
[email protected]
Office hours: by appointment
Room
Слайд 3Lecture Outline
To understand the concept of index number and its use
Lecture Outline
To understand the concept of index number and its use
Слайд 4Index Numbers
Index number is the measure of change in a variable over
Index Numbers
Index number is the measure of change in a variable over
Слайд 5Simple Index numbers
When an item is considered:
1) Fixed base index
2) Chain base index
Simple Index numbers
When an item is considered:
1) Fixed base index
2) Chain base index
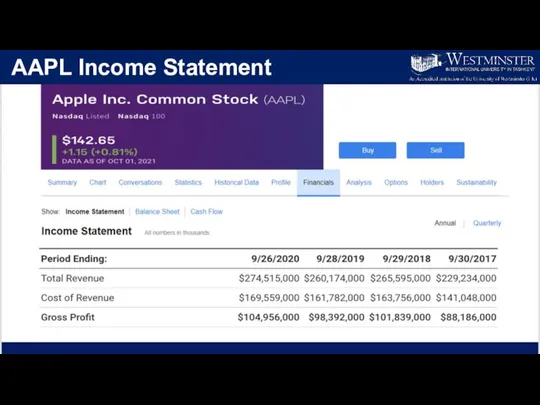
Слайд 6AAPL Income Statement
AAPL Income Statement
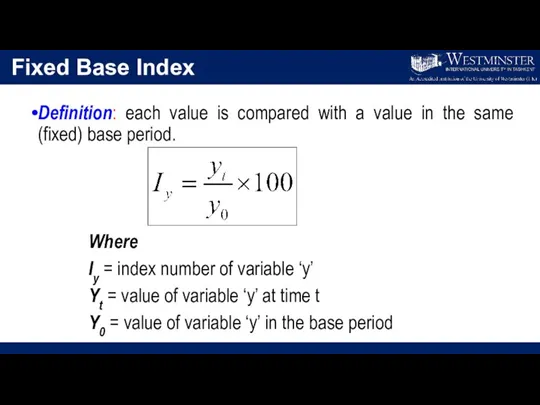
Слайд 7Fixed Base Index
Definition: each value is compared with a value in the
Fixed Base Index
Definition: each value is compared with a value in the
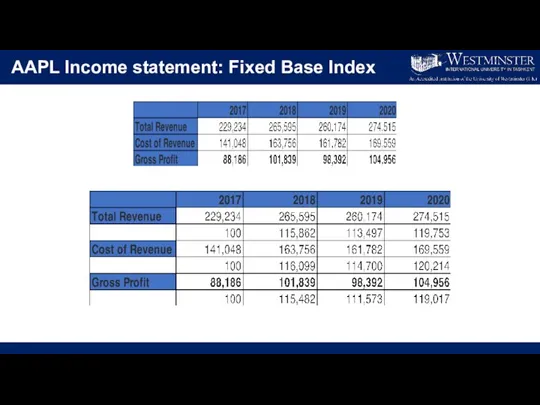
Слайд 8AAPL Income statement: Fixed Base Index
AAPL Income statement: Fixed Base Index
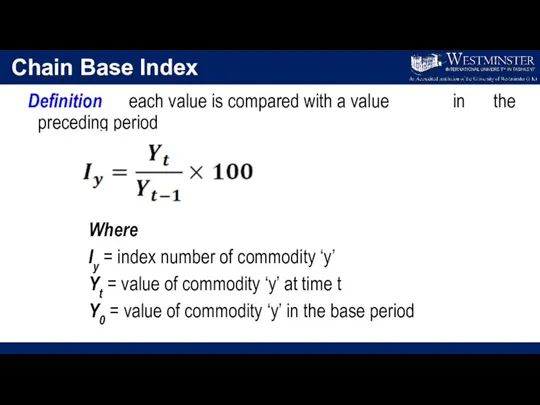
Слайд 9Chain Base Index
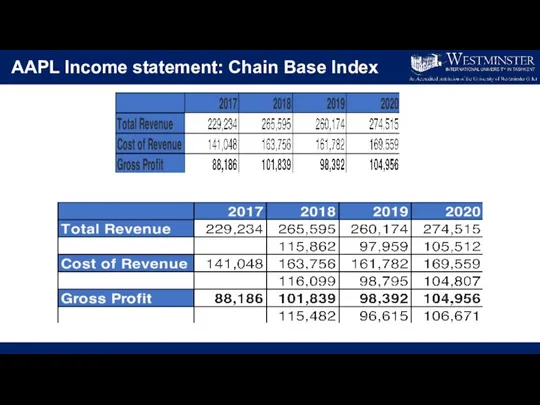
Definition each value is compared with a value in the
Chain Base Index
Definition each value is compared with a value in the
Слайд 10AAPL Income statement: Chain Base Index
AAPL Income statement: Chain Base Index
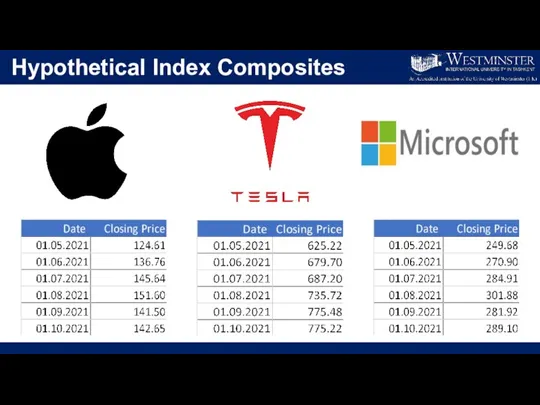
Слайд 11Hypothetical Index Composites
Hypothetical Index Composites
Слайд 12Simple Aggregate Index
Simple Aggregate Index
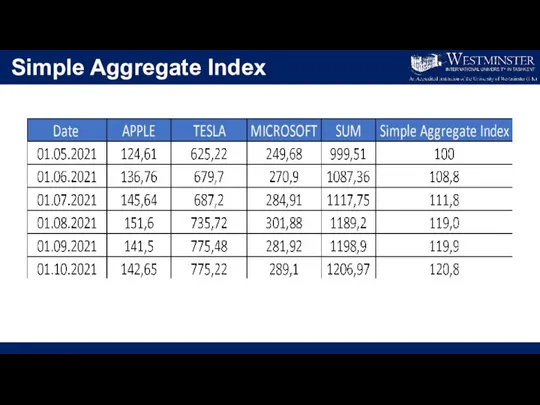
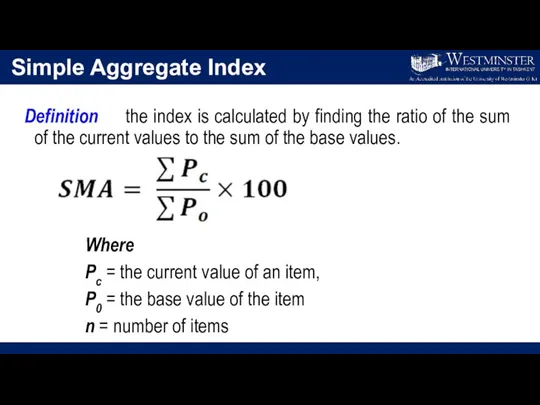
Слайд 13Simple Aggregate Index
Definition the index is calculated by finding the ratio of
Simple Aggregate Index
Definition the index is calculated by finding the ratio of
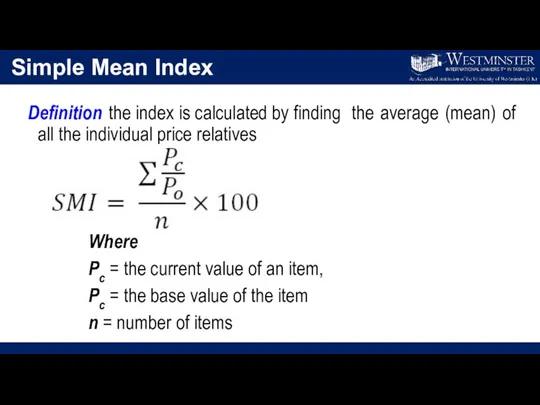
Слайд 14Simple Mean Index
Definition the index is calculated by finding the average (mean)
Simple Mean Index
Definition the index is calculated by finding the average (mean)
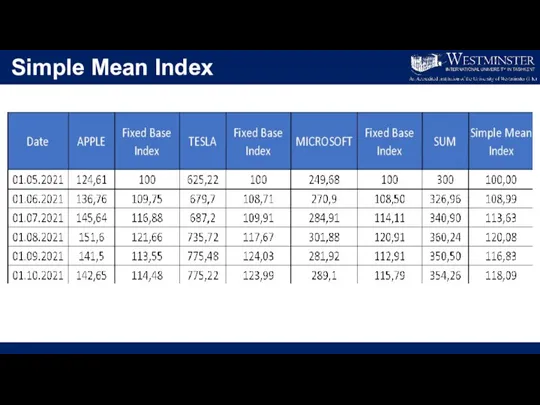
Слайд 15Simple Mean Index
Simple Mean Index
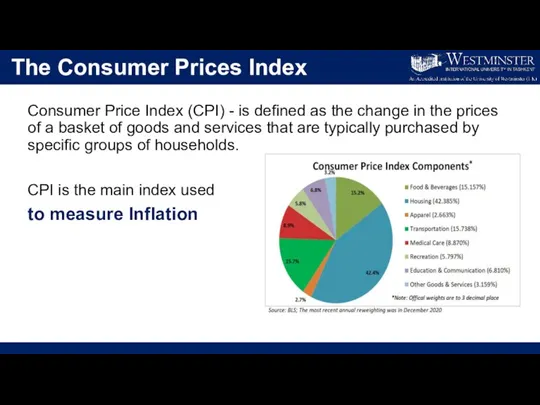
Слайд 16The Consumer Prices Index
Consumer Price Index (CPI) - is defined as the
The Consumer Prices Index
Consumer Price Index (CPI) - is defined as the
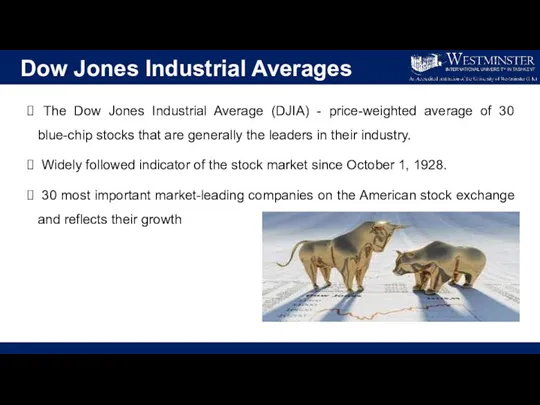
Слайд 17Dow Jones Industrial Averages
The Dow Jones Industrial Average (DJIA) - price-weighted
Dow Jones Industrial Averages
The Dow Jones Industrial Average (DJIA) - price-weighted
Слайд 18The Nasdaq Index
The Nasdaq 100 includes the shares of the 100
The Nasdaq Index
The Nasdaq 100 includes the shares of the 100
Слайд 19Concluding remarks
Today, you learnt:
The method of indexing data
The different types of indices
Concluding remarks
Today, you learnt:
The method of indexing data
The different types of indices
 Вода - главный источник жизни
 Презентация на тему Все про медведей
 Интерактивная игра-викторина О чем расскажет памятник…
 ustanovka_denvera
 День Конституции. Интерактивная викторина - раскраска
 Все народы воспевают материнство
 Понятие и виды временной нетрудоспособности. Пособия
 Презентация на тему Урок Photoshop
 Семейный бюджет
 1136315
 Презентация на тему Чудеса архитектуры
  Создание единого китайского государства
 Анималистика в творчестве Л. В. Позена
 СИСТЕМА РАБОТЫ МОУ ГИМНАЗИЯ №5 ПО ДУХОВНО-НРАВСТВЕННОМУ ВОСПИТАНИЮ И РЕЛИГИОВЕДЧЕСКОМУ ОБРАЗОВАНИЮ2011г.
 Основные направления введения нормативно-подушевого финансирования и новой системы оплаты труда педагогических работников
 Справочник колориста. Описание цветных компонентов
 Тестируем производительность: результаты нагрузочного тестирования, выполненного компаниями «1С-Битрикс», «Онтико» и .masterhost
 Проведение капитального ремонта на участке железной дороги, содержащем водопропускные сооружения
 Менеджмент. Основные понятия
 Внимание!
 ПЕДАГОГИЧЕСКИЙ СОВЕТНА ТЕМУ
 МедСофт 2009 Андрей Хаустов Менеджер по развитию бизнеса Департамент комплексных мобильных решений Email:
  Создание проекта Zend
 План муниципальной площадки по образовательной области Физическое развития для инструкторов ФИЗО г. Чебоксары
 Цветовое решение интерьера гостиничных номеров. Практическая № 19
 Теории научения в современной психологии
 Приемная кампания 2012
 Конкурскультурно-образовательных инициатив