- living_room_acoustics_llrevit

Содержание
- 2. Introduction The sound we experience from our stereo or home theater systems in our living rooms
- 3. Introduction The analysis is useful, for example, when optimizing for loudspeaker locations inside a living room
- 4. Model Definition Geometry The geometry for the living room used in this analysis is synchronized from
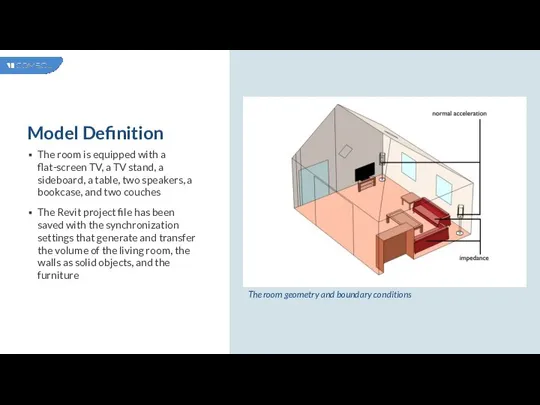
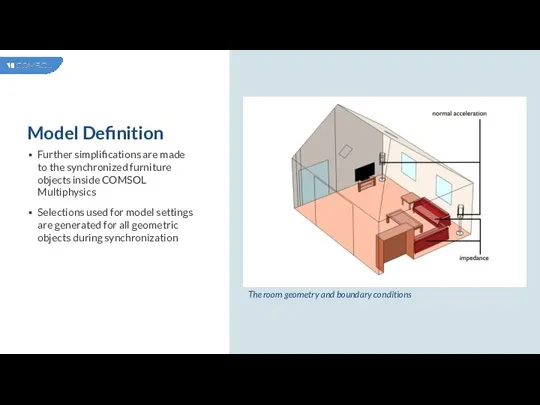
- 5. Model Definition The room geometry and boundary conditions The room is equipped with a flat-screen TV,
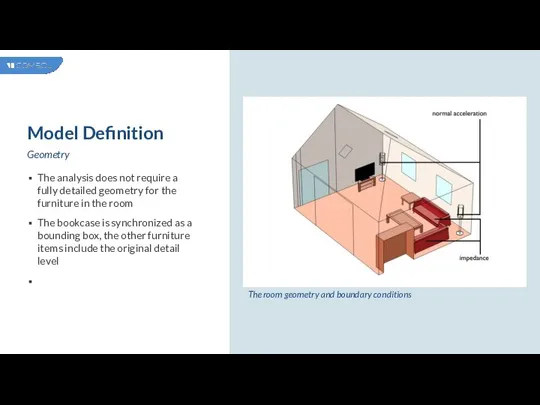
- 6. Model Definition Geometry The analysis does not require a fully detailed geometry for the furniture in
- 7. Model Definition The room geometry and boundary conditions Further simplifications are made to the synchronized furniture
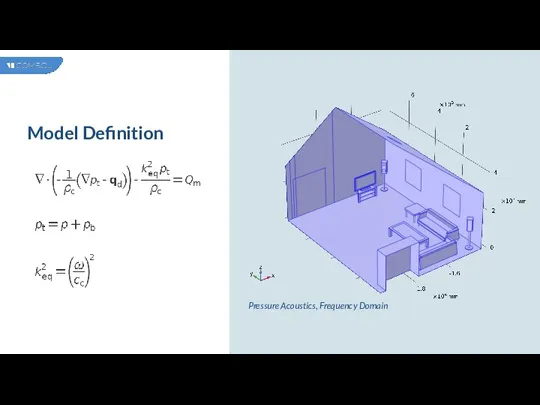
- 8. Model Definition Pressure Acoustics, Frequency Domain
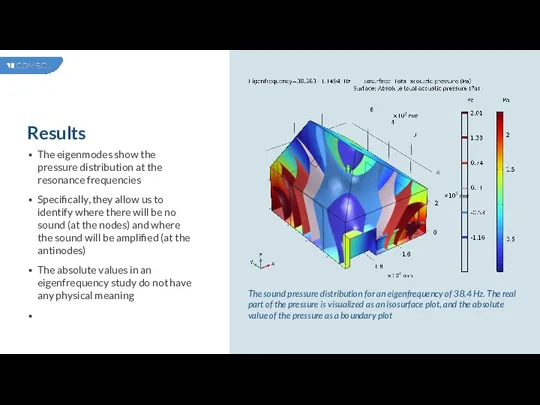
- 9. Results The eigenmodes show the pressure distribution at the resonance frequencies Specifically, they allow us to
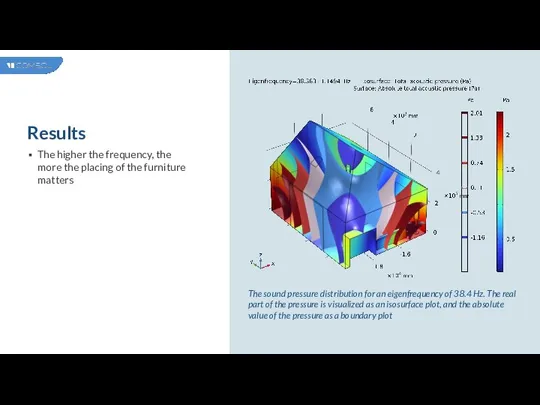
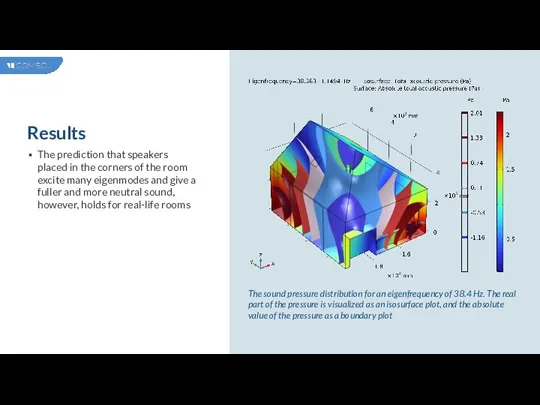
- 10. Results The sound pressure distribution for an eigenfrequency of 38.4 Hz. The real part of the
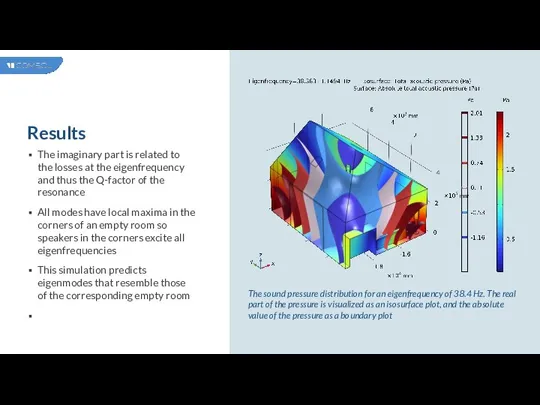
- 11. Results The imaginary part is related to the losses at the eigenfrequency and thus the Q-factor
- 12. Results The sound pressure distribution for an eigenfrequency of 38.4 Hz. The real part of the
- 13. Results The prediction that speakers placed in the corners of the room excite many eigenmodes and
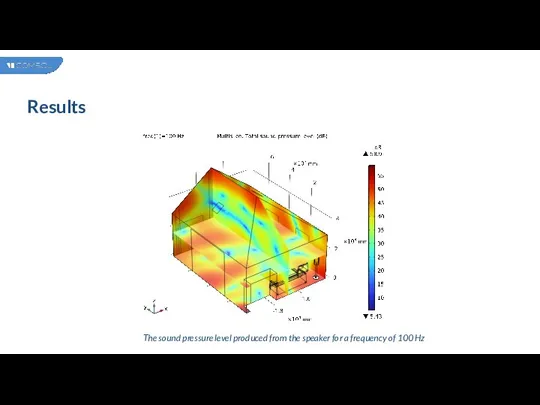
- 14. Results The sound pressure level produced from the speaker for a frequency of 100 Hz
- 16. Скачать презентацию
Слайд 3Introduction
The analysis is useful, for example, when optimizing for loudspeaker locations inside
Introduction
The analysis is useful, for example, when optimizing for loudspeaker locations inside
Слайд 4Model Definition
Geometry
The geometry for the living room used in this analysis is
Model Definition
Geometry
The geometry for the living room used in this analysis is

Слайд 5Model Definition
The room geometry and boundary conditions
The room is equipped with a
Model Definition
The room geometry and boundary conditions
The room is equipped with a
Слайд 6Model Definition
Geometry
The analysis does not require a fully detailed geometry for the
Model Definition
Geometry
The analysis does not require a fully detailed geometry for the
Слайд 7Model Definition
The room geometry and boundary conditions
Further simplifications are made to the
Model Definition
The room geometry and boundary conditions
Further simplifications are made to the
Слайд 8Model Definition
Pressure Acoustics, Frequency Domain
Model Definition
Pressure Acoustics, Frequency Domain
Слайд 9Results
The eigenmodes show the pressure distribution at the resonance frequencies
Specifically, they allow
Results
The eigenmodes show the pressure distribution at the resonance frequencies
Specifically, they allow
Слайд 10Results
The sound pressure distribution for an eigenfrequency of 38.4 Hz. The real
Results
The sound pressure distribution for an eigenfrequency of 38.4 Hz. The real

Слайд 11Results
The imaginary part is related to the losses at the eigenfrequency and
Results
The imaginary part is related to the losses at the eigenfrequency and
Слайд 12Results
The sound pressure distribution for an eigenfrequency of 38.4 Hz. The real
Results
The sound pressure distribution for an eigenfrequency of 38.4 Hz. The real
Слайд 13Results
The prediction that speakers placed in the corners of the room excite
Results
The prediction that speakers placed in the corners of the room excite
Слайд 14Results
The sound pressure level produced from the speaker for a frequency of
Results
The sound pressure level produced from the speaker for a frequency of
 Методы общественной экспертизы
 УПРАВЛЕНИЕ РИСКОМ
  Язык и человек
 Русская старина
 Презентация на тему Вторая война Рима с Карфагеном
 Презентация на тему Виды связи в словосочетаниях
 Финансы. Введение
 Происхождение государства
 Создание продающих сайтов-лендингов с высокой конверсией
 Основные понятия процесса. Модуль 1
 Теоретико-методологические подходы в современной науке
 Звуки Д и Д . Буква Д
 Какие бывают цветочные композиции? (технология)
 Практические аспекты введения с 1 января 2007 года новой редакции ТН ВЭД России Чуков Александр Михайлович, директор по спецпроек
 История Деда Мороза
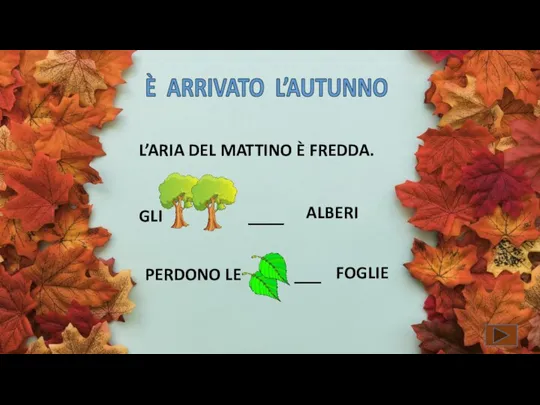 L’aria del mattino è fredda
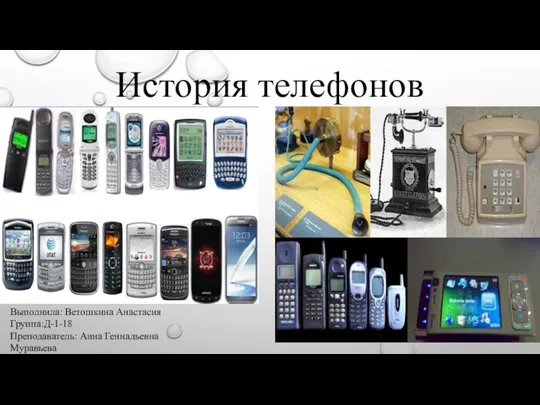 История телефонов
 Разработка технической документации на установку, настройку и техническую эксплуатацию портативного маршрутизатора TP-linkM7350
 Кто хочет стать миллионером
 Степень с целым отрицательным показателем (8 класс)
 Загадки Владимира Ивановича Даля
 Выбор количества изображений и главного изображения при выполнении чертежа
 Районный конкурс компьютерных проектов «Нобелевские надежды»
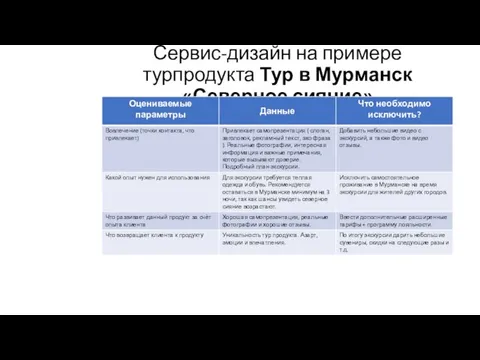 Сервис-дизайн на примере турпродукта: Тур в Мурманск Северное сияние
 4 funny and 1 usual facts about TV
 Презентация на тему Форма слова и окончание
  petr1
petr1 Информационно-новостной портал www.SEGODNYA.ua