- National Accounts Measuring Aggregate Output

Содержание
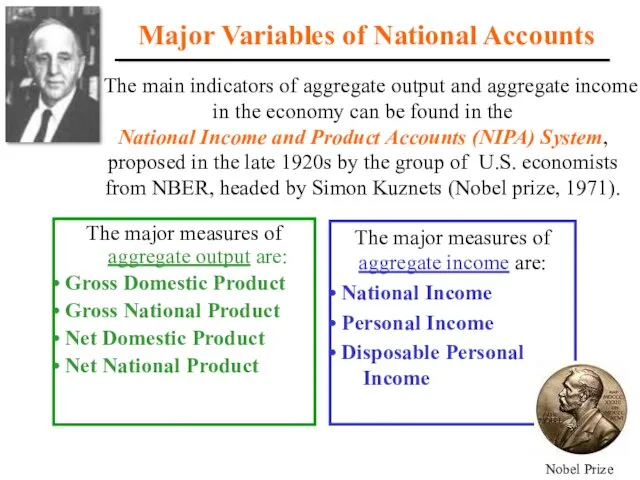
- 2. Major Variables of National Accounts The major measures of aggregate output are: Gross Domestic Product Gross
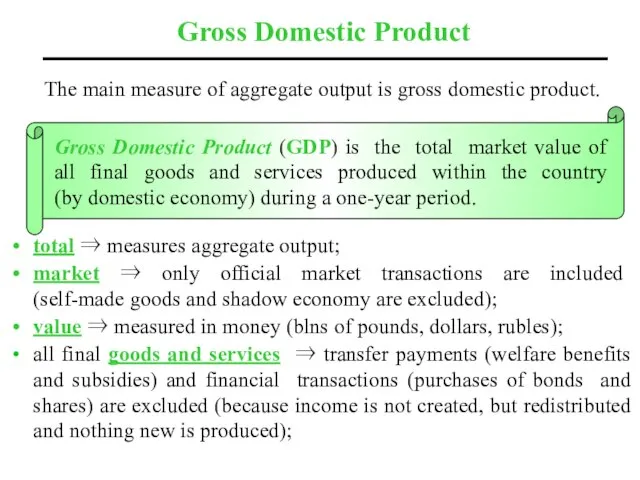
- 3. total ⇒ measures aggregate output; market ⇒ only official market transactions are included (self-made goods and
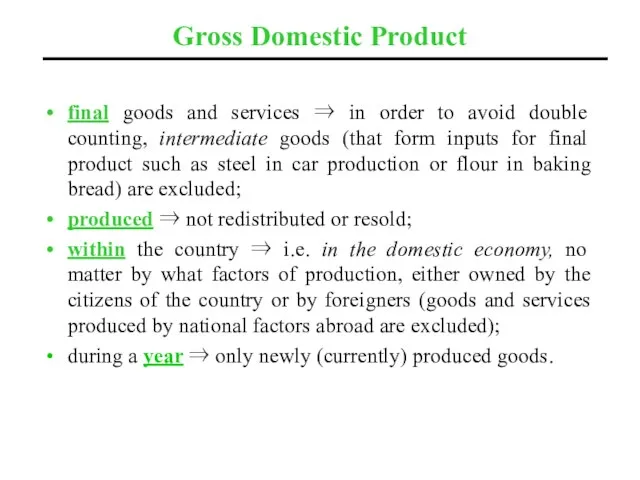
- 4. Gross Domestic Product final goods and services ⇒ in order to avoid double counting, intermediate goods
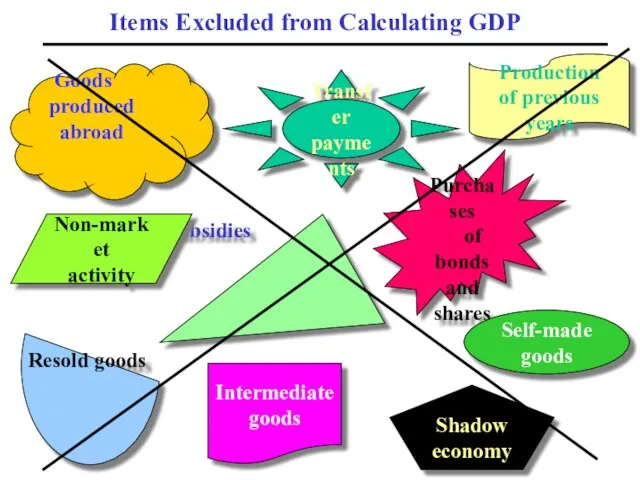
- 5. Self-made production Shadow economy Resold goods Goods produced abroad Subsidies Purchases of bonds and shares Production
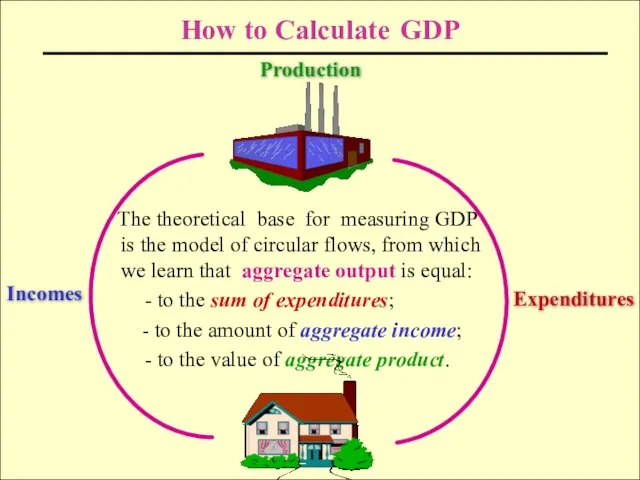
- 6. How to Calculate GDP The theoretical base for measuring GDP is the model of circular flows,
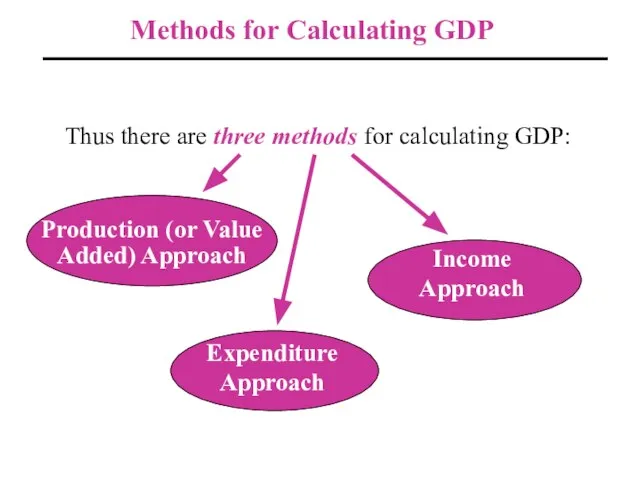
- 7. Methods for Calculating GDP Thus there are three methods for calculating GDP:
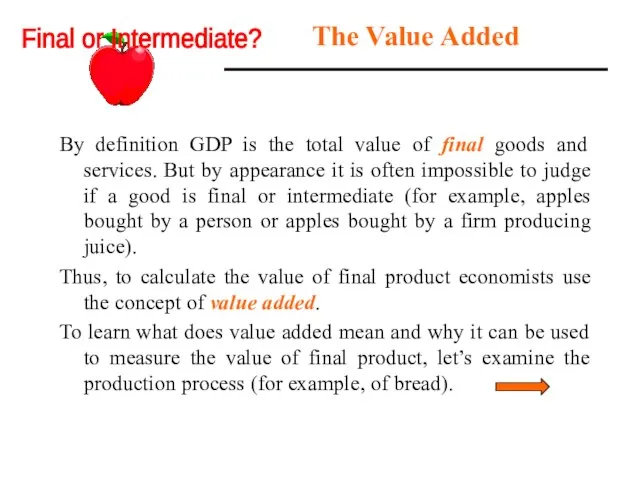
- 8. The Value Added By definition GDP is the total value of final goods and services. But
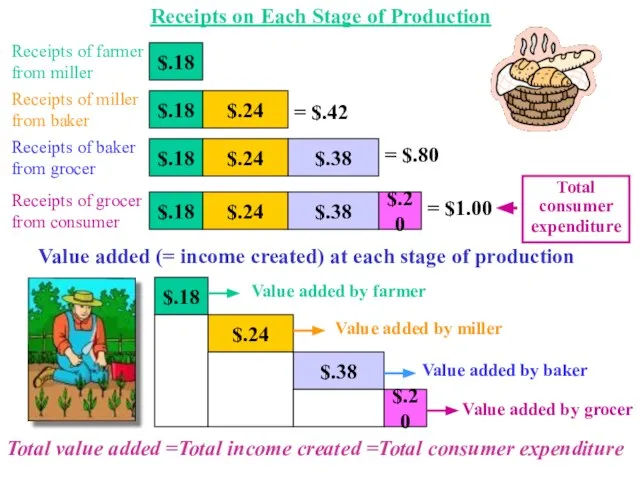
- 9. Receipts of farmer from miller Receipts of miller from baker Receipts of grocer from consumer Receipts
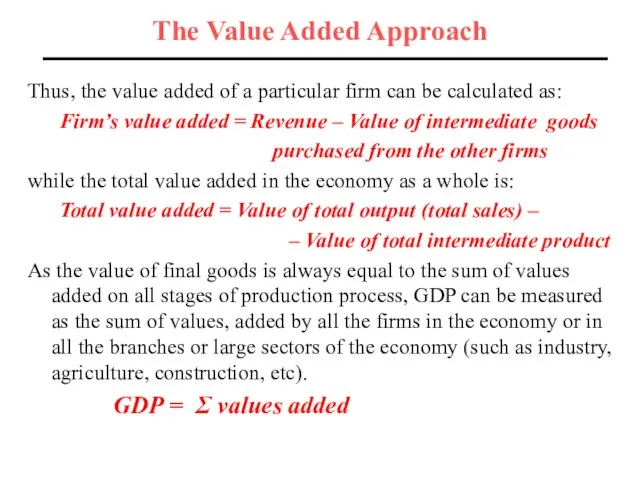
- 10. The Value Added Approach Thus, the value added of a particular firm can be calculated as:
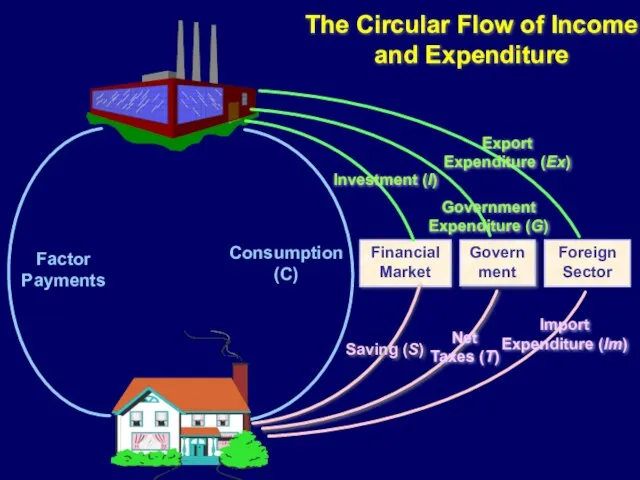
- 11. Financial Market Foreign Sector Import Expenditure (Im) The Circular Flow of Income and Expenditure Factor Payments
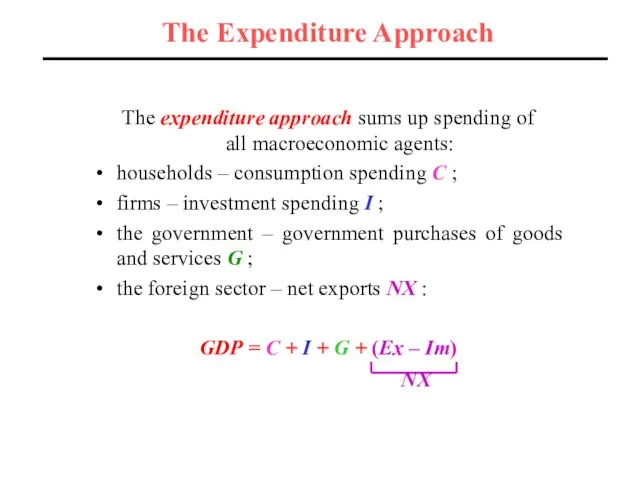
- 12. The expenditure approach sums up spending of all macroeconomic agents: households – consumption spending C ;
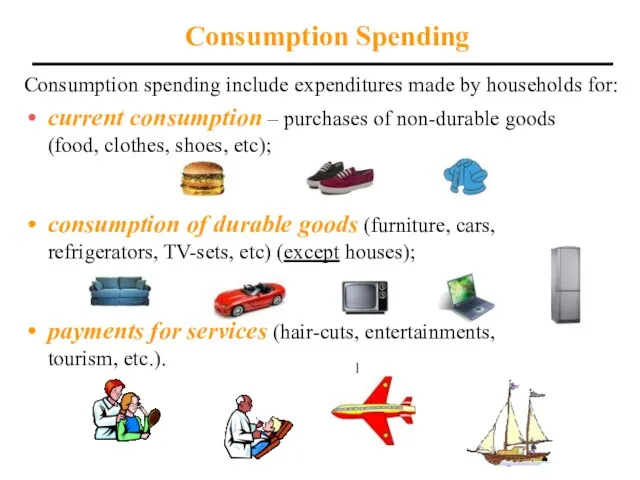
- 13. Consumption spending include expenditures made by households for: current consumption – purchases of non-durable goods (food,
- 14. Investment Spending Investment spending represent expenditures made by private business firms and households to buy capital
- 15. Inventory Investment Three first components of investment spending form domestic private fixed investment. Inventory investment (Iinv)
- 16. Composition of Investment Spending Purchases of new durable equipment New non-residential construction New residential construction Fixed
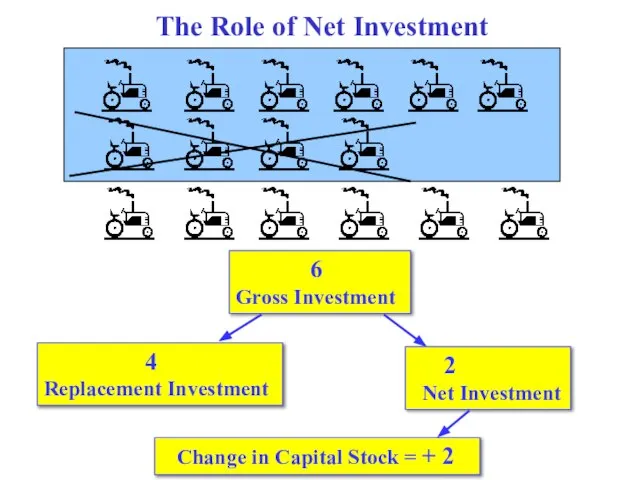
- 17. Investment spending are divided into: gross investment (Igross); replacement investment (= depreciation = capital consumption allowances
- 18. 6 Gross Investment 4 Replacement Investment 2 Net Investment Change in Capital Stock = + 2
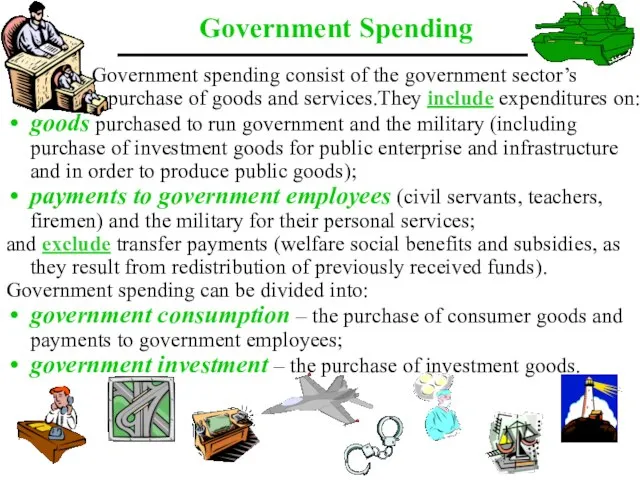
- 19. Government spending consist of the government sector’s purchase of goods and services.They include expenditures on: goods
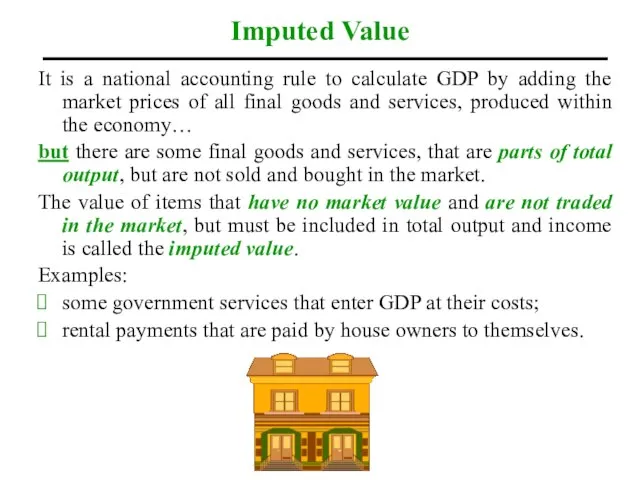
- 20. Imputed Value It is a national accounting rule to calculate GDP by adding the market prices
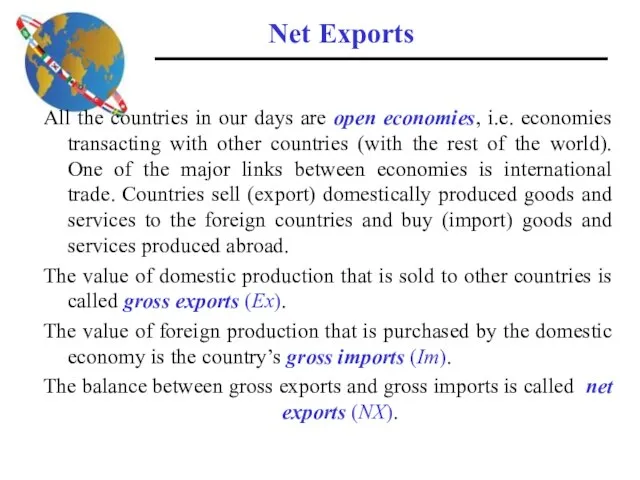
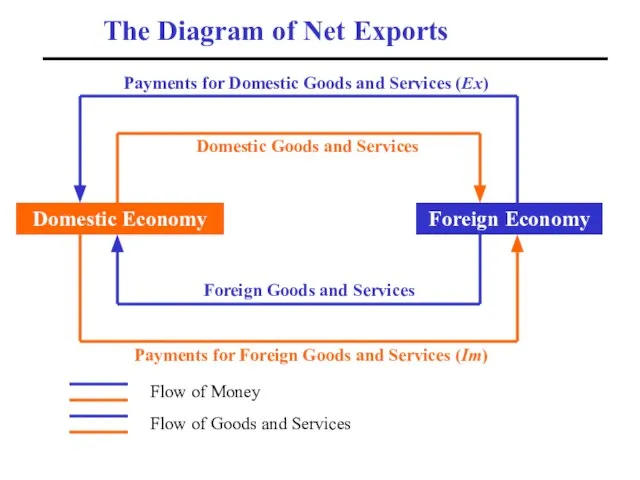
- 21. Net Exports All the countries in our days are open economies, i.e. economies transacting with other
- 22. Domestic Economy Foreign Economy The Diagram of Net Exports Domestic Goods and Services Foreign Goods and
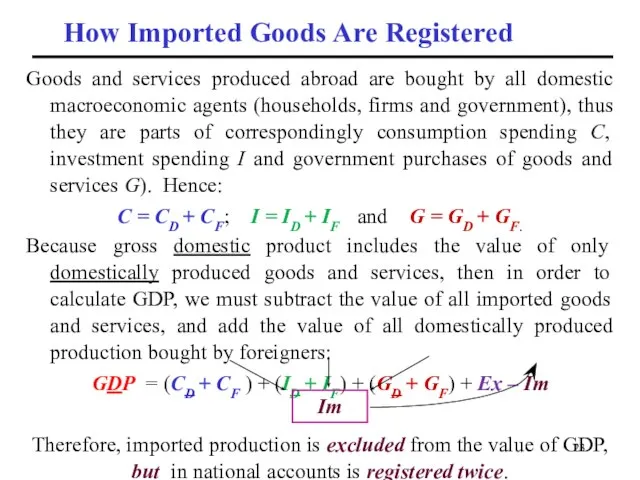
- 23. How Imported Goods Are Registered Goods and services produced abroad are bought by all domestic macroeconomic
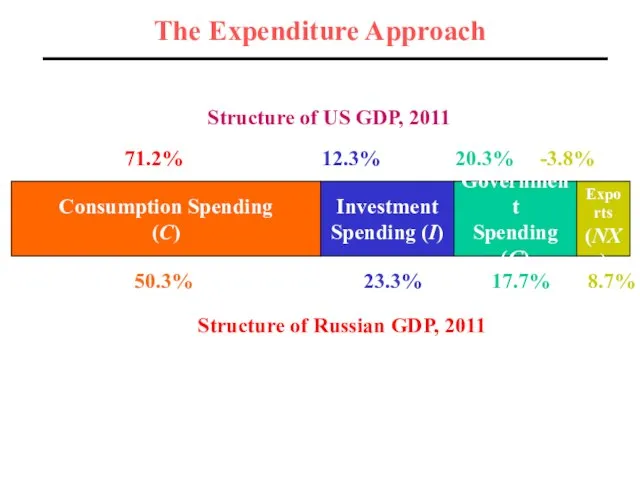
- 24. The Expenditure Approach Consumption Spending (C) Investment Spending (I) Government Spending (G) Net Exports (NX) Structure
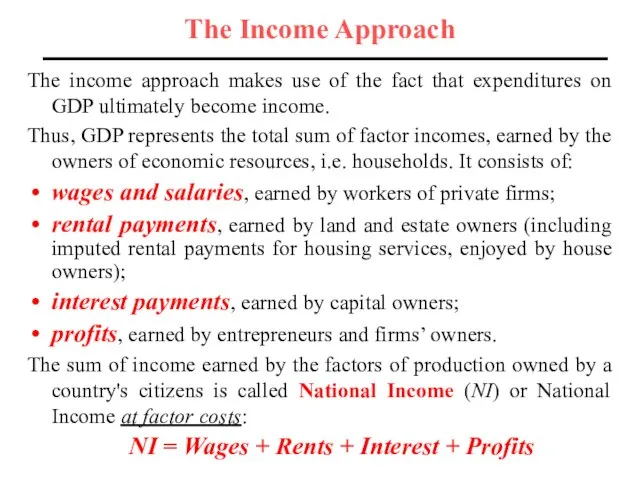
- 25. The Income Approach The income approach makes use of the fact that expenditures on GDP ultimately
- 26. Interest Payments According to U.S. national accounts interest payments is called “net interest”. Net interest =
- 27. The Types of Profits In accordance with the existing forms of business organization, national accounts distinguish
- 28. The Structure of Profits Profits Proprietors’ Income Corporate Profits Undistributed Profits (retained earnings) Distributed Profits (dividends)
- 29. The Structure of Factor Payments The dominant factor of production is labor. The share of labor
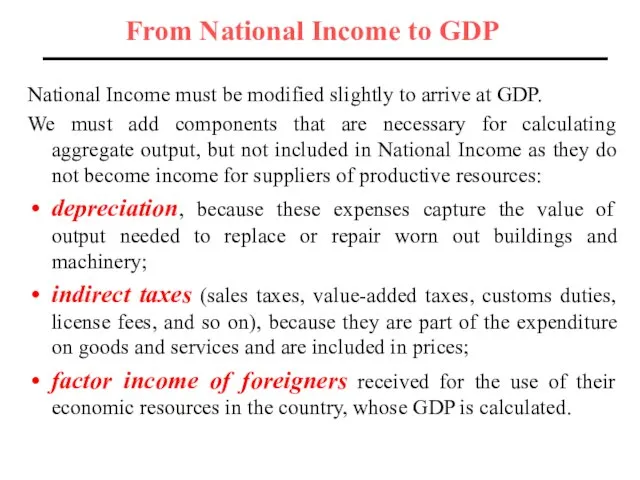
- 30. From National Income to GDP National Income must be modified slightly to arrive at GDP. We
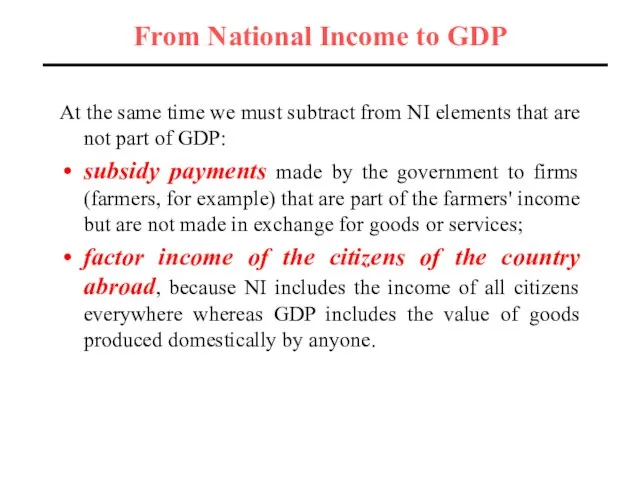
- 31. From National Income to GDP At the same time we must subtract from NI elements that
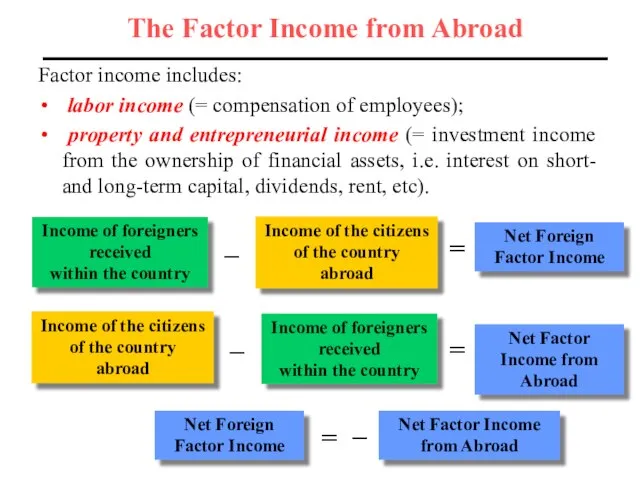
- 32. The Factor Income from Abroad Income of foreigners received within the country Income of the citizens
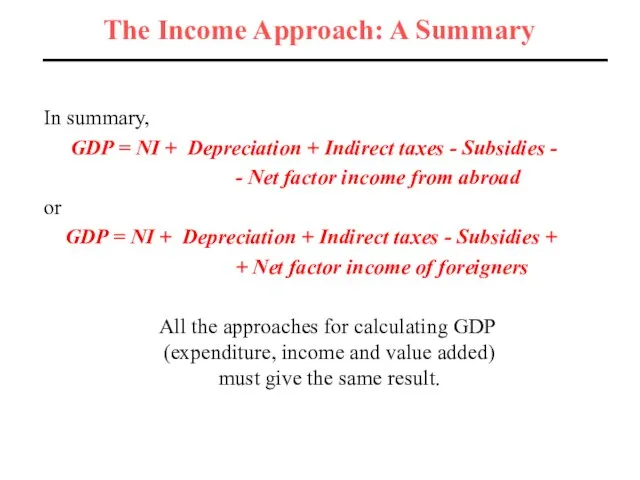
- 33. The Income Approach: A Summary In summary, GDP = NI + Depreciation + Indirect taxes -
- 34. Gross National Product Gross National Product (GNP) is the total market value of all final goods
- 35. GDP versus GNP He adds to: Gross Domestic Product of Germany Gross National Product of Italy
- 36. Net Domestic and Net National Product Net Domestic Product (NDP) = GDP – Depreciation Net National
- 37. National Income National Income = NNP – Net Indirect Taxes = = NNP – Indirect taxes
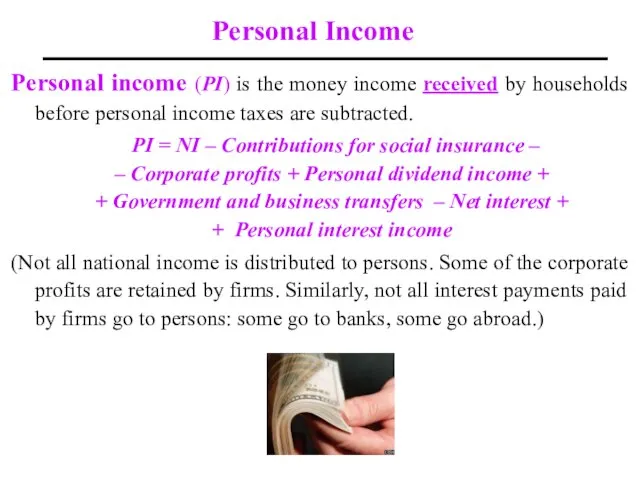
- 38. Personal Income Personal income (PI) is the money income received by households before personal income taxes
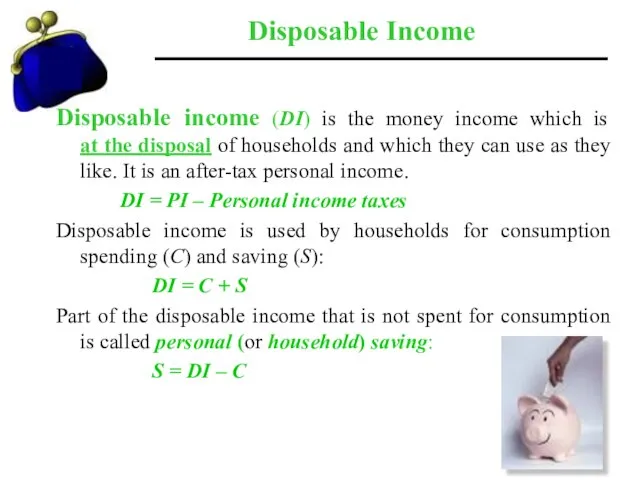
- 39. Disposable Income Disposable income (DI) is the money income which is at the disposal of households
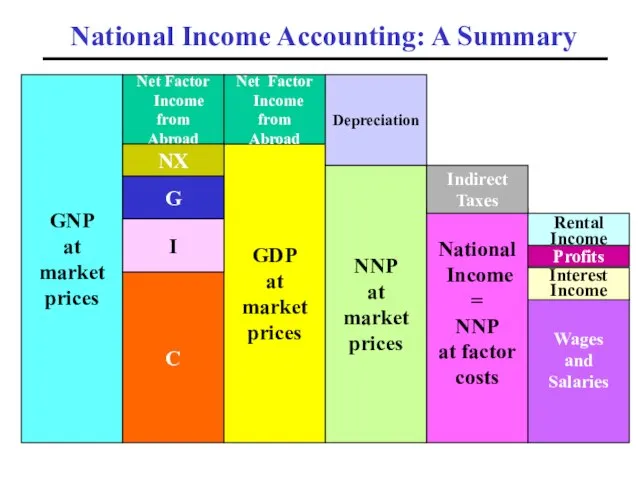
- 40. National Income Accounting: A Summary GNP at market prices C GDP at market prices NNP at
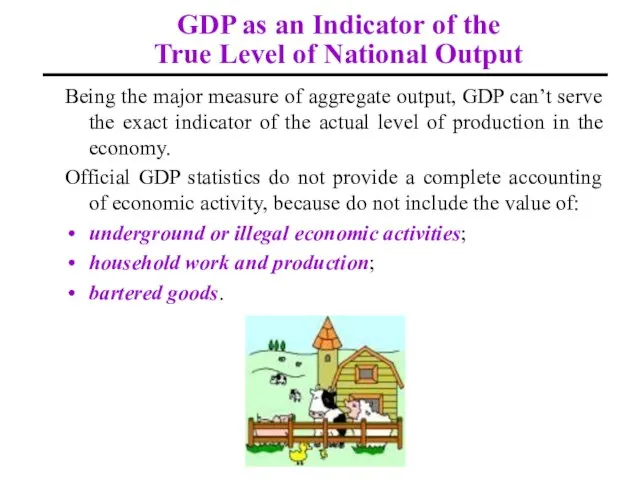
- 41. GDP as an Indicator of the True Level of National Output Being the major measure of
- 42. GDP as the Indicator of the Welfare and the Well-being GDP and GNP can’t serve the
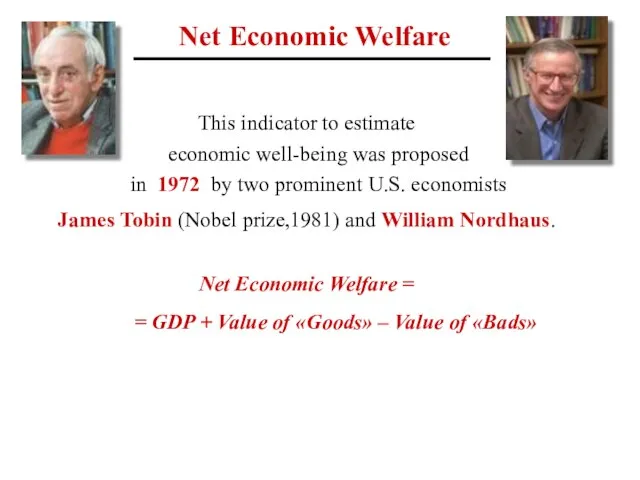
- 43. Net Economic Welfare This indicator to estimate economic well-being was proposed in 1972 by two prominent
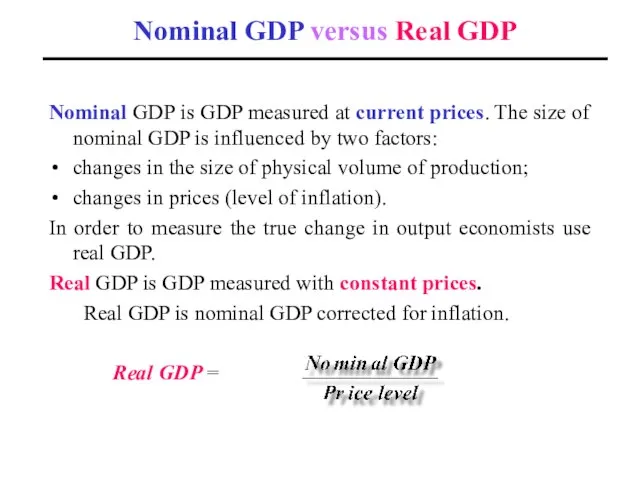
- 44. Nominal GDP versus Real GDP Nominal GDP is GDP measured at current prices. The size of
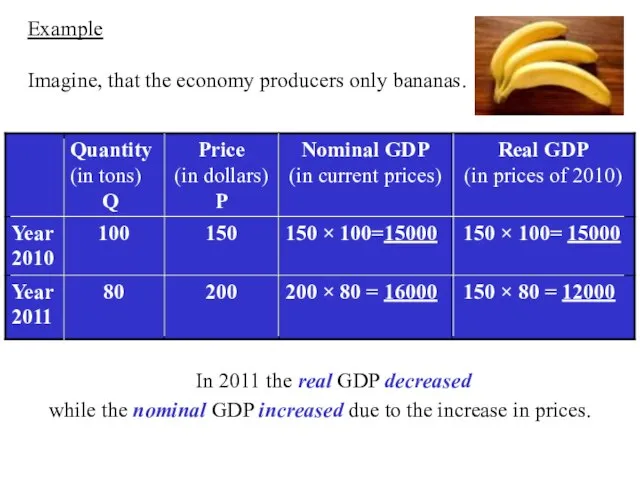
- 45. Example Imagine, that the economy producers only bananas. In 2011 the real GDP decreased while the
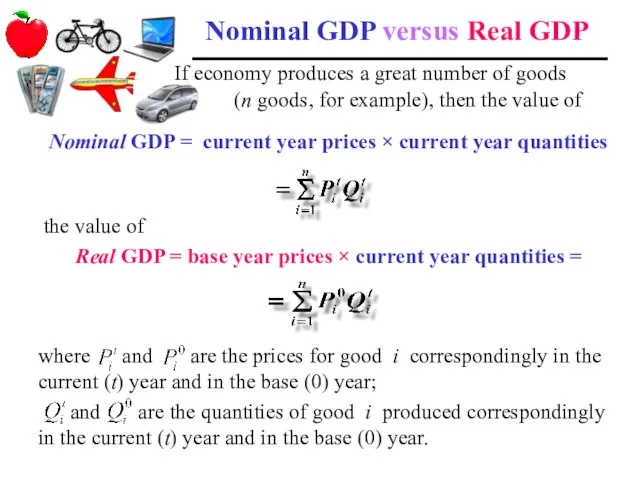
- 46. If economy produces a great number of goods (n goods, for example), then the value of
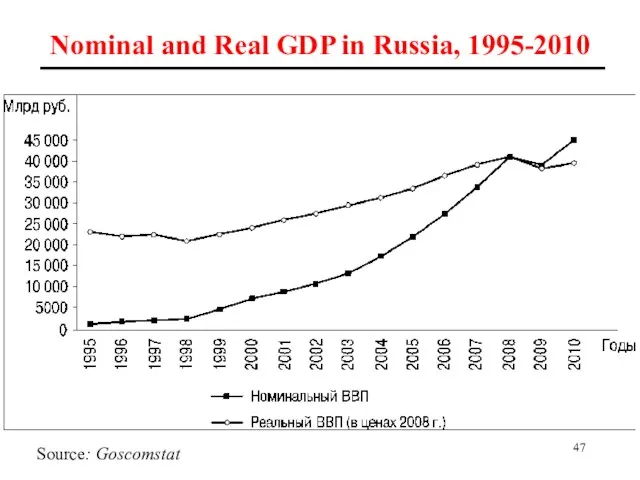
- 47. Nominal and Real GDP in Russia, 1995-2010 Source: Goscomstat
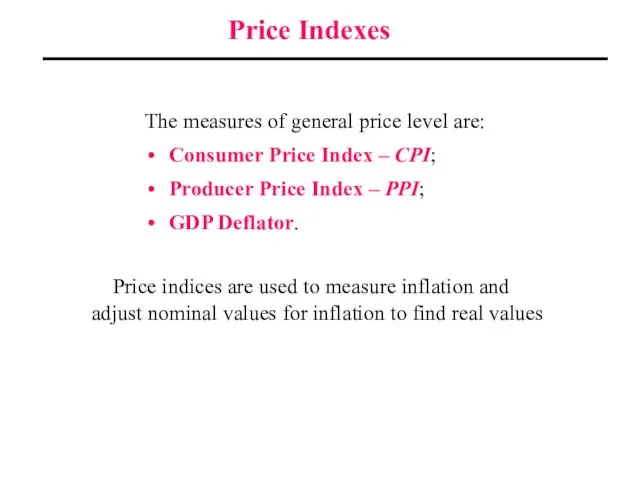
- 48. Price Indexes The measures of general price level are: Consumer Price Index – CPI; Producer Price
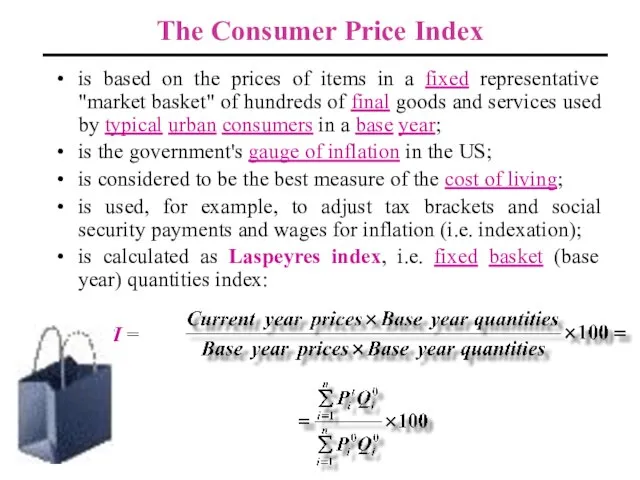
- 49. The Consumer Price Index is based on the prices of items in a fixed representative "market
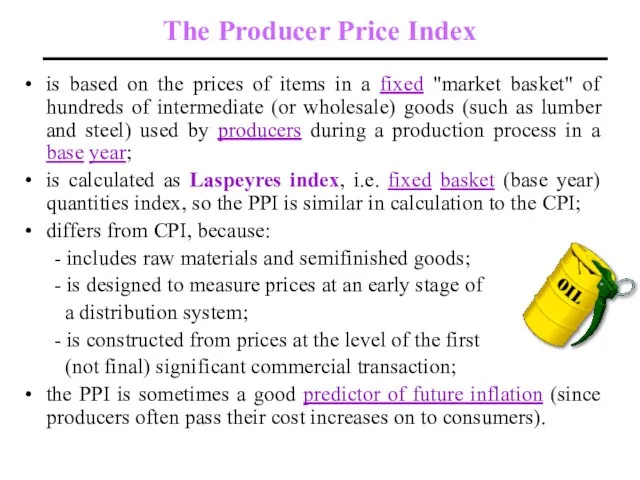
- 50. The Producer Price Index is based on the prices of items in a fixed "market basket"
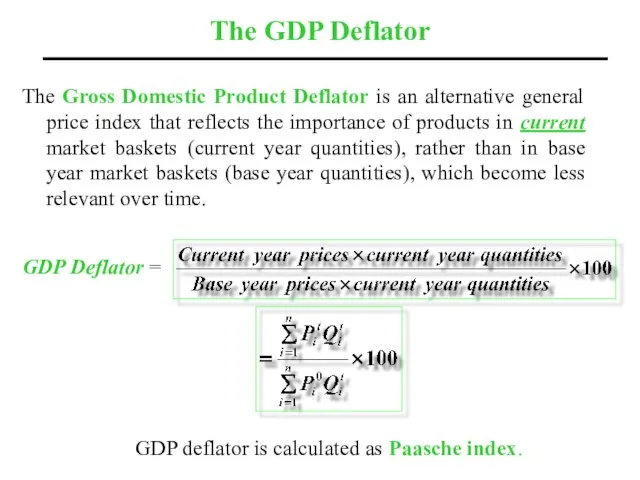
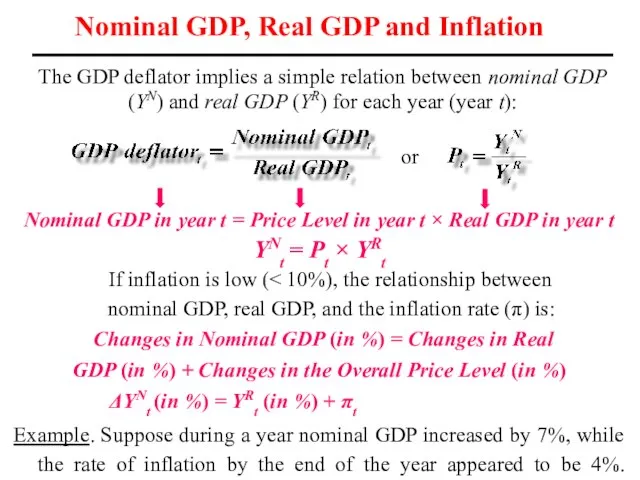
- 51. The GDP Deflator The Gross Domestic Product Deflator is an alternative general price index that reflects
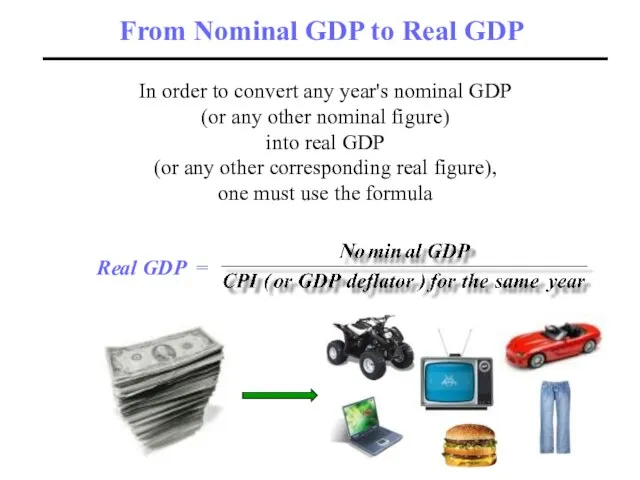
- 52. In order to convert any year's nominal GDP (or any other nominal figure) into real GDP
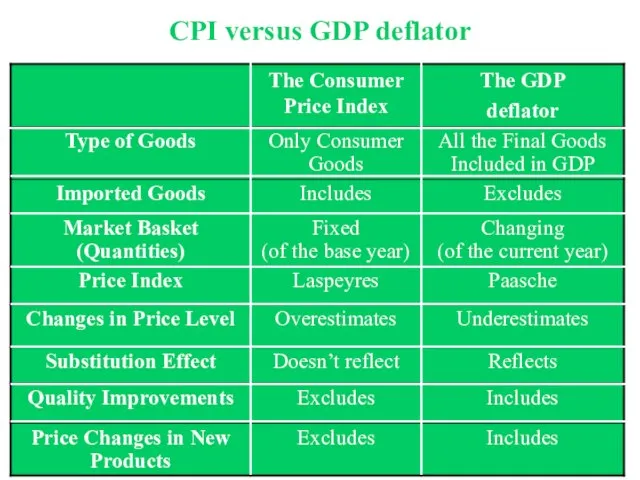
- 53. CPI versus GDP deflator
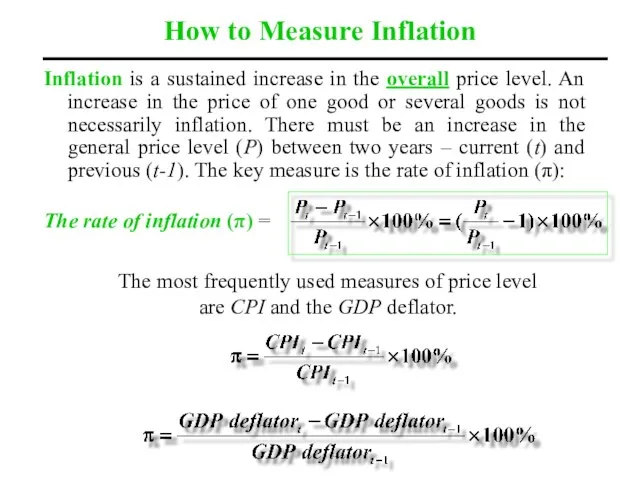
- 54. How to Measure Inflation Inflation is a sustained increase in the overall price level. An increase
- 55. Nominal GDP in year t = Price Level in year t × Real GDP in year
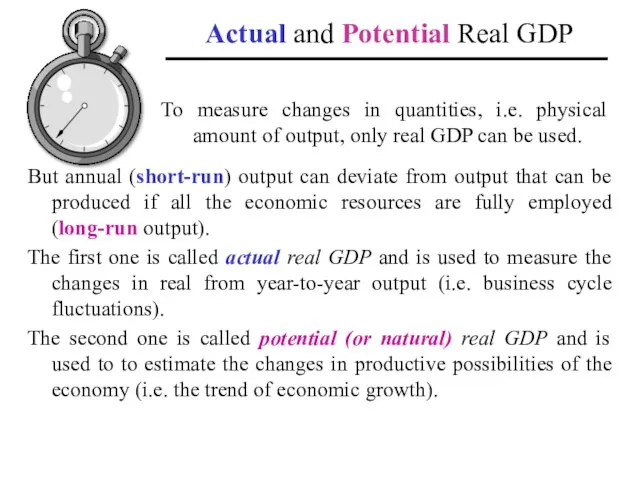
- 56. Actual and Potential Real GDP But annual (short-run) output can deviate from output that can be
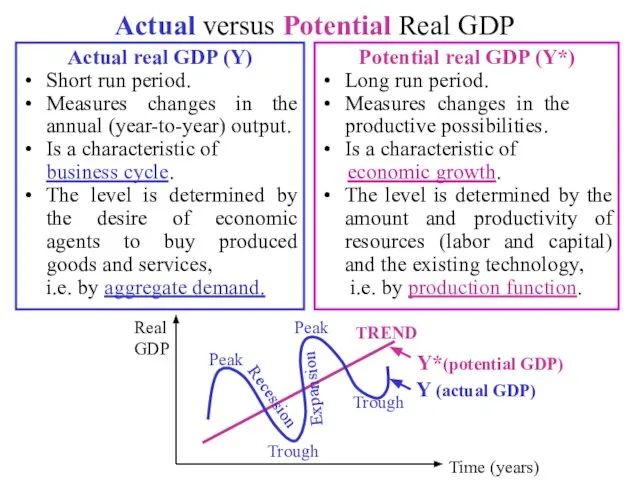
- 57. Actual versus Potential Real GDP Actual real GDP (Y) Short run period. Measures changes in the
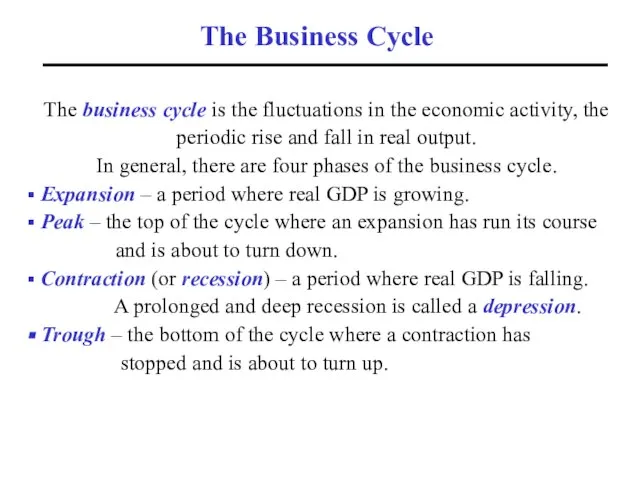
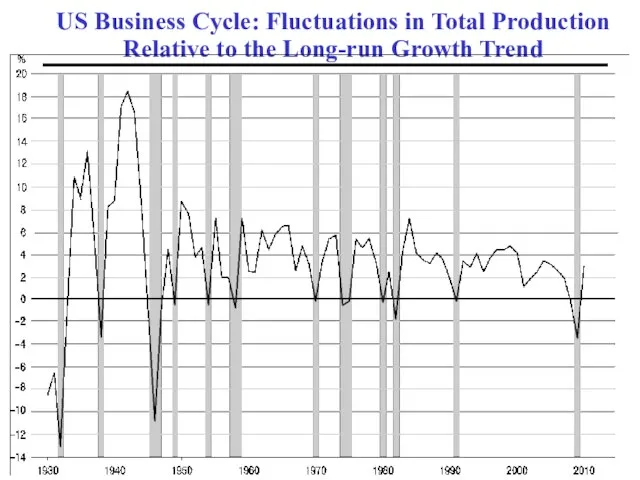
- 58. The Business Cycle The business cycle is the fluctuations in the economic activity, the periodic rise
- 59. US Business Cycle: Fluctuations in Total Production Relative to the Long-run Growth Trend
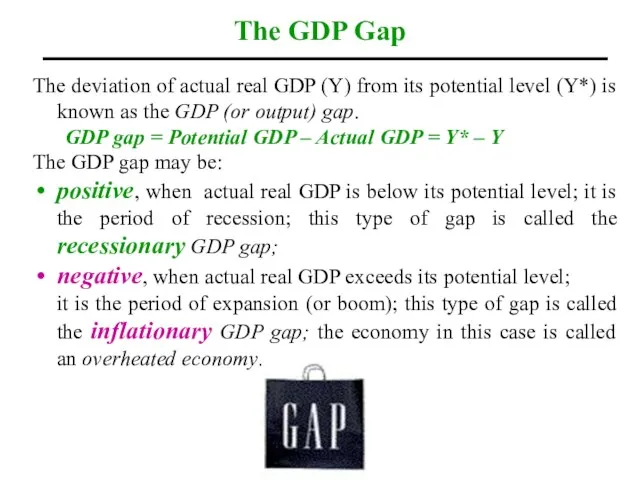
- 60. The GDP Gap The deviation of actual real GDP (Y) from its potential level (Y*) is
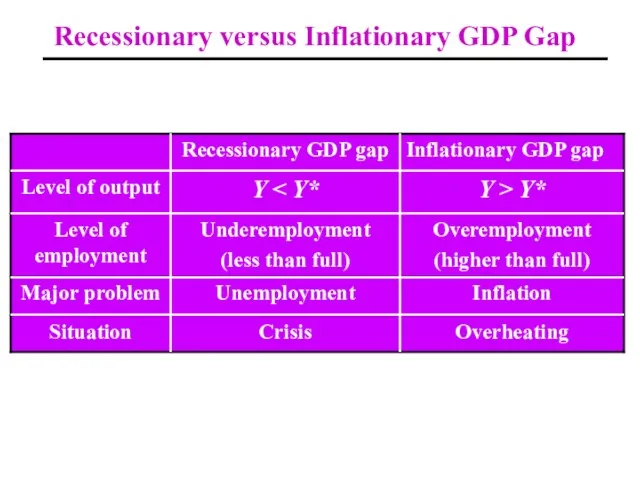
- 61. Recessionary versus Inflationary GDP Gap
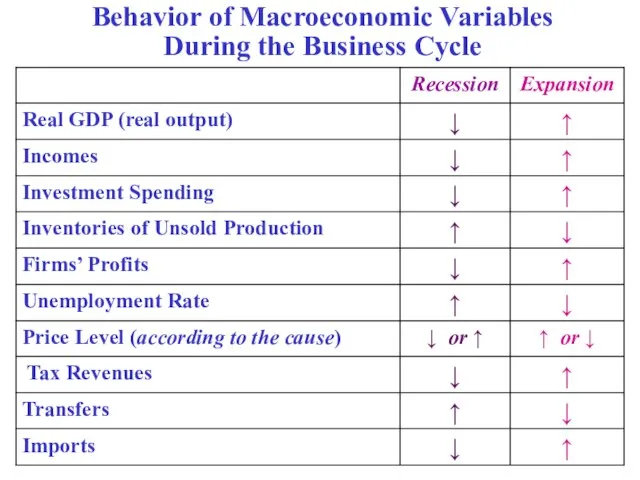
- 62. Behavior of Macroeconomic Variables During the Business Cycle
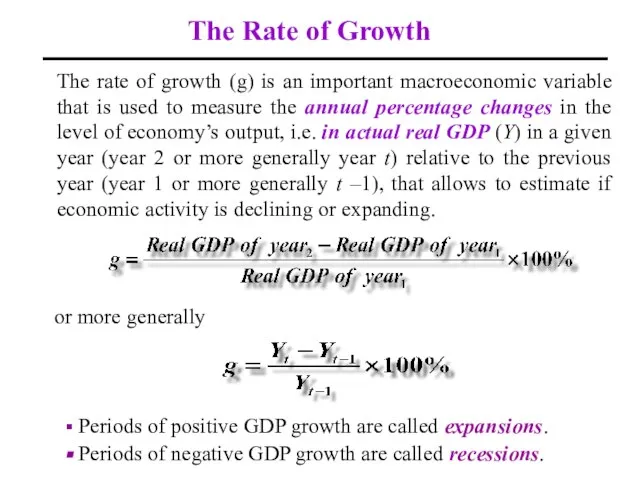
- 63. The Rate of Growth The rate of growth (g) is an important macroeconomic variable that is
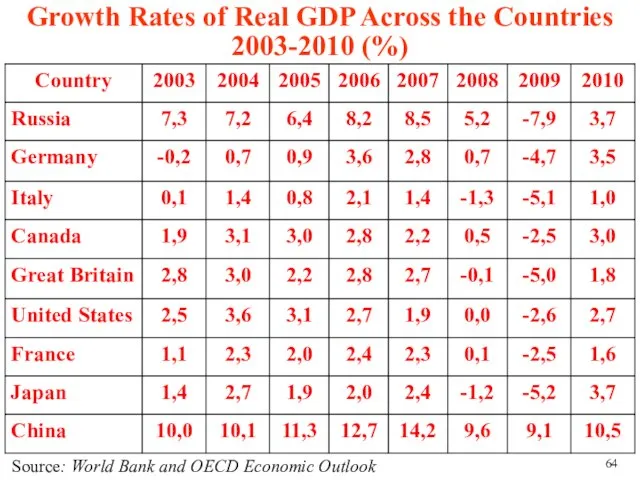
- 64. Growth Rates of Real GDP Across the Countries 2003-2010 (%) Source: World Bank and OECD Economic
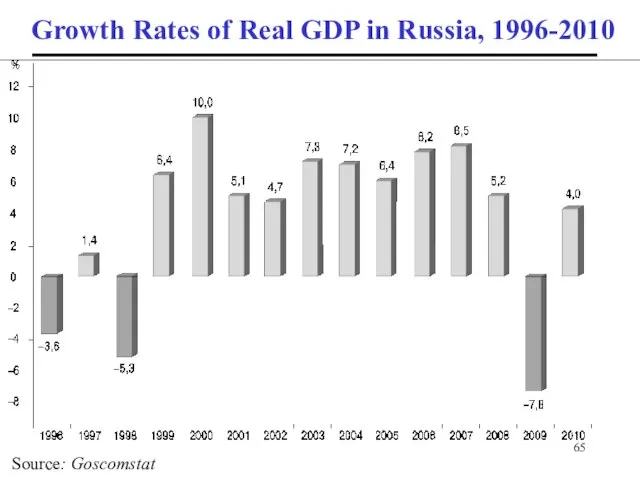
- 65. Growth Rates of Real GDP in Russia, 1996-2010 Source: Goscomstat
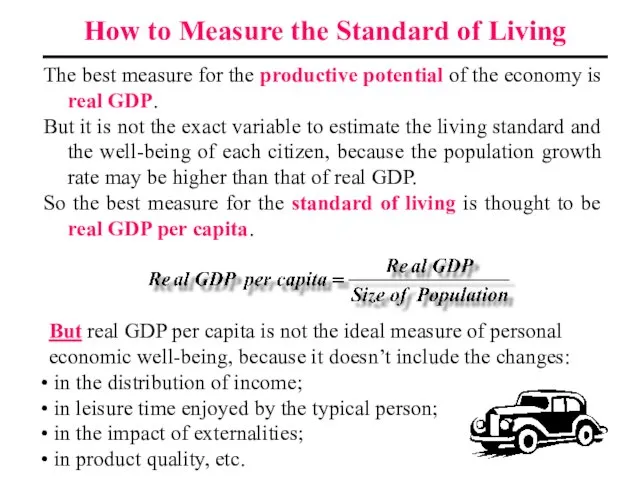
- 66. How to Measure the Standard of Living The best measure for the productive potential of the
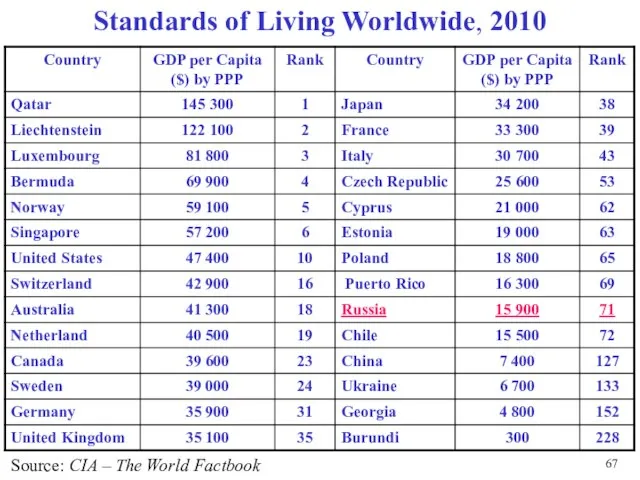
- 67. Standards of Living Worldwide, 2010 Source: CIA – The World Factbook
- 69. Скачать презентацию
Слайд 3
total ⇒ measures aggregate output;
market ⇒ only official market transactions are
total ⇒ measures aggregate output;
market ⇒ only official market transactions are
Слайд 4Gross Domestic Product
final goods and services ⇒ in order to avoid double
Gross Domestic Product
final goods and services ⇒ in order to avoid double
Слайд 5Self-made production
Shadow
economy
Resold goods
Goods
produced
abroad
Subsidies
Purchases
of
Self-made production
Shadow
economy
Resold goods
Goods
produced
abroad
Subsidies
Purchases
of
Слайд 6How to Calculate GDP
The theoretical base for measuring GDP is the
How to Calculate GDP
The theoretical base for measuring GDP is the
Слайд 7Methods for Calculating GDP
Thus there are three methods for calculating GDP:
Methods for Calculating GDP
Thus there are three methods for calculating GDP:
Слайд 8The Value Added
By definition GDP is the total value of final goods
The Value Added
By definition GDP is the total value of final goods
Слайд 9Receipts of farmer from miller
Receipts of miller from baker
Receipts of grocer from
Receipts of farmer from miller
Receipts of miller from baker
Receipts of grocer from
Слайд 10The Value Added Approach
Thus, the value added of a particular firm can
The Value Added Approach
Thus, the value added of a particular firm can
Слайд 11Financial
Market
Foreign
Sector
Import
Expenditure (Im)
The Circular Flow of Income
and Expenditure
Factor
Payments
Export
Expenditure (Ex)
Saving (S)
Government
Net
Taxes
Financial
Market
Foreign
Sector
Import
Expenditure (Im)
The Circular Flow of Income
and Expenditure
Factor
Payments
Export
Expenditure (Ex)
Saving (S)
Government
Net
Taxes
Слайд 12The expenditure approach sums up spending of all macroeconomic agents:
households –
The expenditure approach sums up spending of all macroeconomic agents:
households –
Слайд 13Consumption spending include expenditures made by households for:
current consumption – purchases of
Consumption spending include expenditures made by households for:
current consumption – purchases of
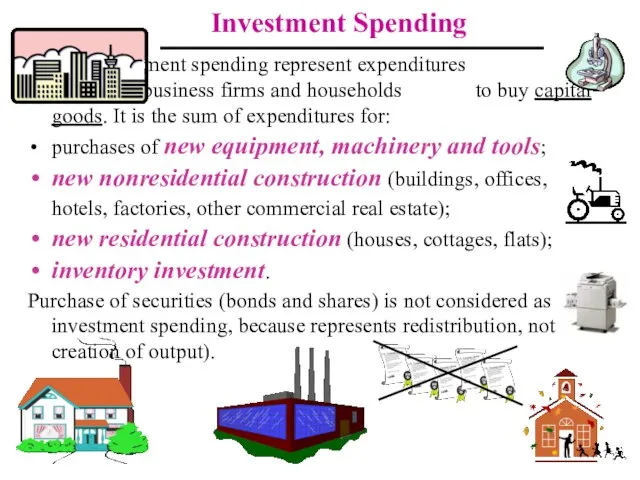
Слайд 14Investment Spending
Investment spending represent expenditures made by private business firms and households
Investment Spending
Investment spending represent expenditures made by private business firms and households
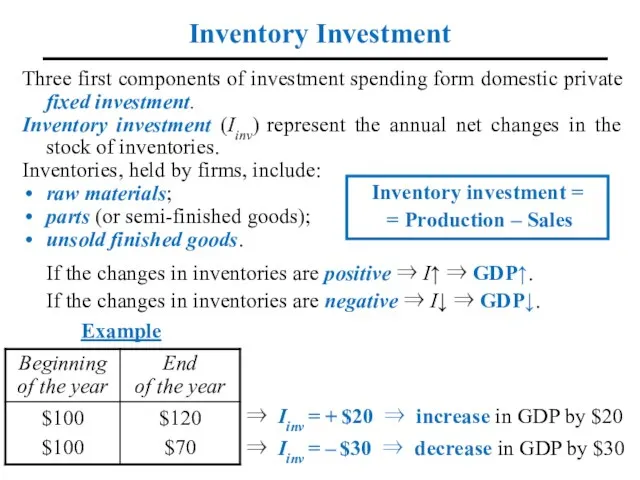
Слайд 15Inventory Investment
Three first components of investment spending form domestic private fixed investment.
Inventory
Inventory Investment
Three first components of investment spending form domestic private fixed investment.
Inventory
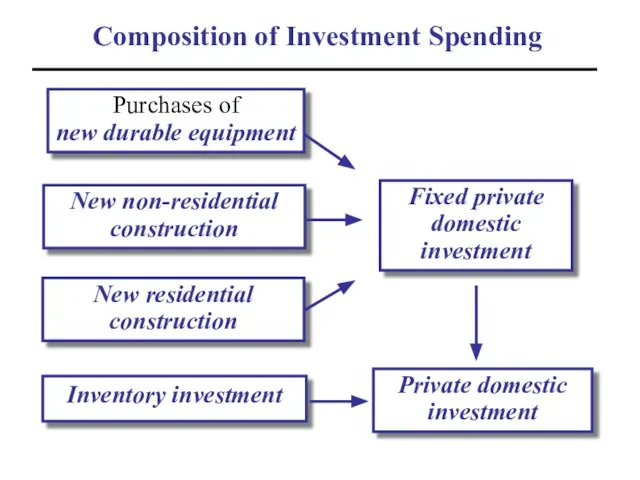
Слайд 16Composition of Investment Spending
Purchases of
new durable equipment
New non-residential construction
New residential
Composition of Investment Spending
Purchases of
new durable equipment
New non-residential construction
New residential
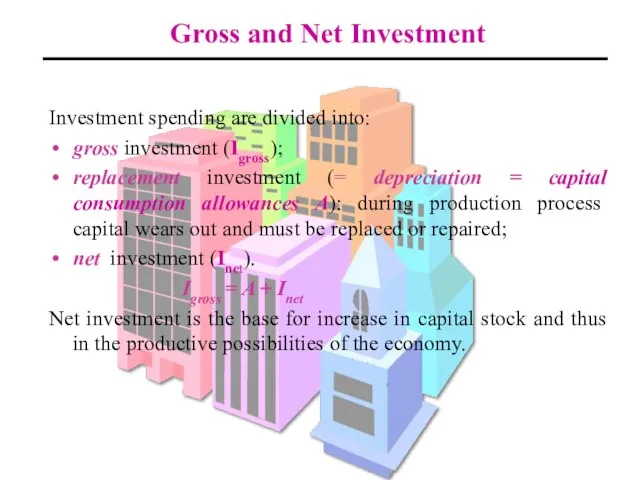
Слайд 17Investment spending are divided into:
gross investment (Igross);
replacement investment (= depreciation = capital
Investment spending are divided into:
gross investment (Igross);
replacement investment (= depreciation = capital
Слайд 18 6
Gross Investment
4
Replacement Investment
2
Net Investment
Change in Capital Stock
6
Gross Investment
4
Replacement Investment
2
Net Investment
Change in Capital Stock
Слайд 19
Government spending consist of the government sector’s
purchase of
Government spending consist of the government sector’s
purchase of
Слайд 20Imputed Value
It is a national accounting rule to calculate GDP by adding
Imputed Value
It is a national accounting rule to calculate GDP by adding
Слайд 21Net Exports
All the countries in our days are open economies, i.e. economies
Net Exports
All the countries in our days are open economies, i.e. economies
Слайд 22Domestic Economy
Foreign Economy
The Diagram of Net Exports
Domestic Goods and Services
Foreign
Domestic Economy
Foreign Economy
The Diagram of Net Exports
Domestic Goods and Services
Foreign
Слайд 23 How Imported Goods Are Registered
Goods and services produced abroad are bought by
How Imported Goods Are Registered
Goods and services produced abroad are bought by
Слайд 24The Expenditure Approach
Consumption Spending
(C)
Investment
Spending (I)
Government
Spending (G)
Net
Exports
(NX)
Structure of US GDP,
The Expenditure Approach
Consumption Spending
(C)
Investment
Spending (I)
Government
Spending (G)
Net
Exports
(NX)
Structure of US GDP,
Слайд 25The Income Approach
The income approach makes use of the fact that
The Income Approach
The income approach makes use of the fact that
Слайд 26Interest Payments
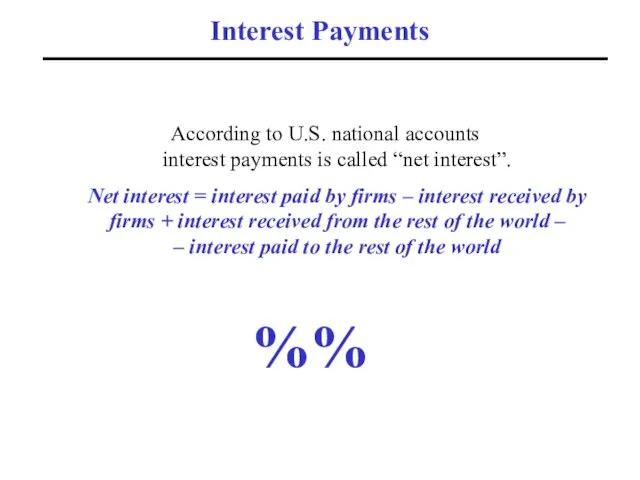
According to U.S. national accounts interest payments is called “net interest”.
Interest Payments
According to U.S. national accounts interest payments is called “net interest”.
Слайд 27The Types of Profits
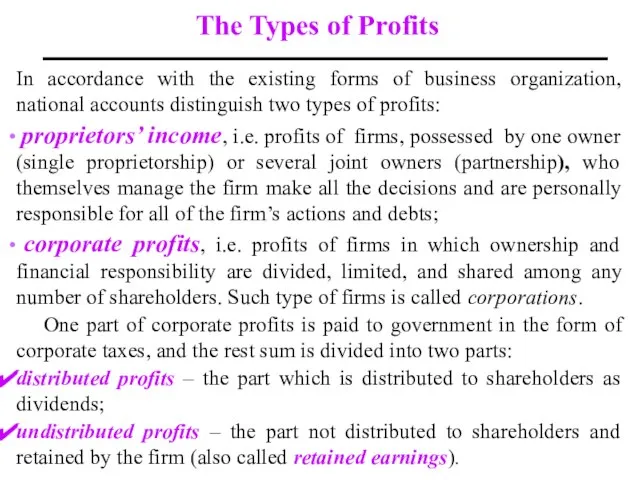
In accordance with the existing forms of business organization,
The Types of Profits
In accordance with the existing forms of business organization,
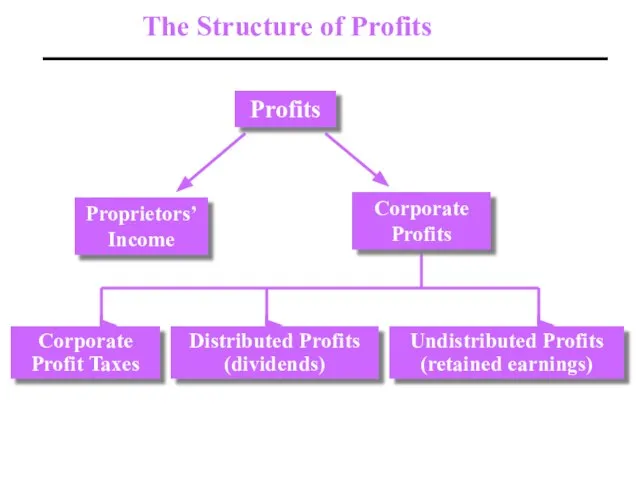
Слайд 28 The Structure of Profits
Profits
Proprietors’ Income
Corporate
Profits
Undistributed Profits (retained earnings)
Distributed Profits (dividends)
Corporate
Profit
The Structure of Profits
Profits
Proprietors’ Income
Corporate
Profits
Undistributed Profits (retained earnings)
Distributed Profits (dividends)
Corporate
Profit
Слайд 29The Structure of Factor Payments
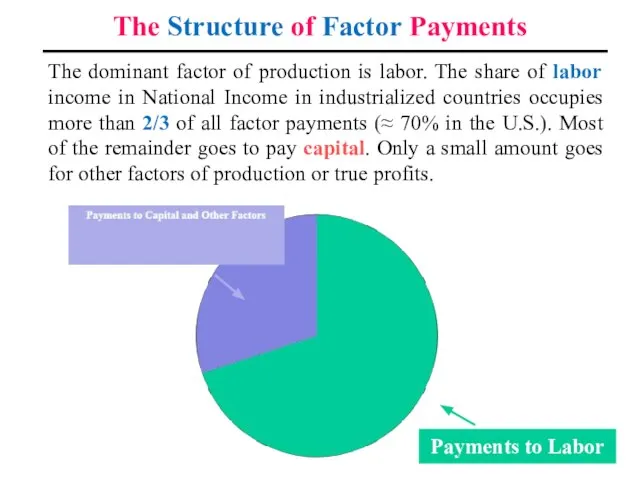
The dominant factor of production is labor. The
The Structure of Factor Payments
The dominant factor of production is labor. The
Слайд 30From National Income to GDP
National Income must be modified slightly to arrive
From National Income to GDP
National Income must be modified slightly to arrive
Слайд 31From National Income to GDP
At the same time we must subtract from
From National Income to GDP
At the same time we must subtract from
Слайд 32The Factor Income from Abroad
Income of foreigners received
within the country
Income of
The Factor Income from Abroad
Income of foreigners received
within the country
Income of
Слайд 33The Income Approach: A Summary
In summary,
GDP = NI + Depreciation
The Income Approach: A Summary
In summary,
GDP = NI + Depreciation
Слайд 34
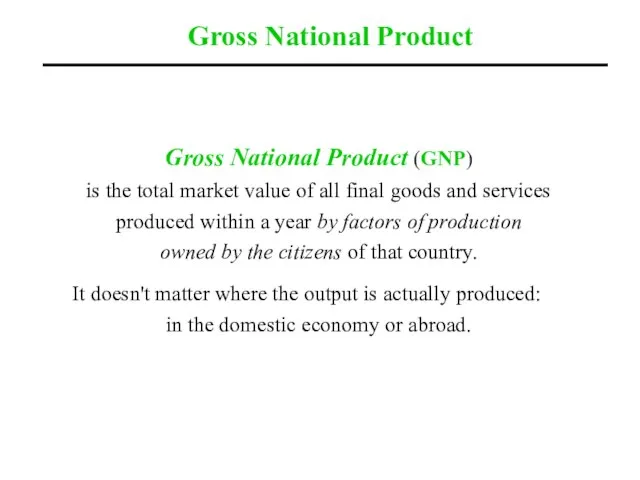
Gross National Product
Gross National Product (GNP) is the total market value
Gross National Product
Gross National Product (GNP) is the total market value
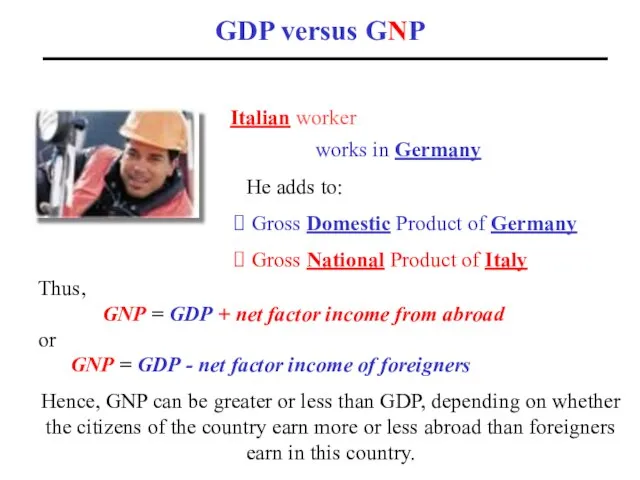
Слайд 35GDP versus GNP
He adds to:
Gross Domestic Product of Germany
Gross National
GDP versus GNP
He adds to:
Gross Domestic Product of Germany
Gross National
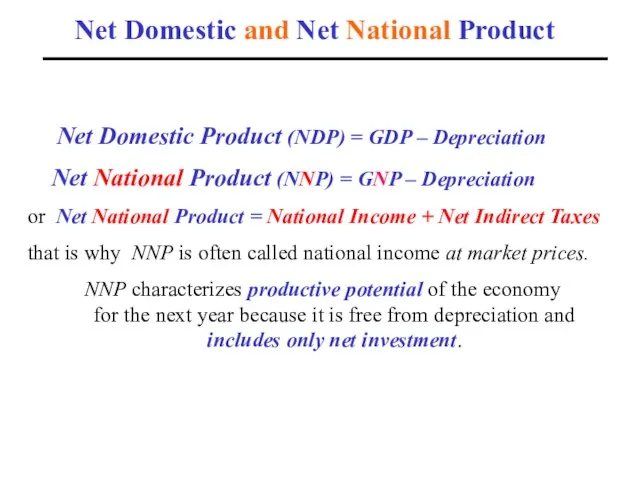
Слайд 36Net Domestic and Net National Product
Net Domestic Product (NDP) = GDP
Net Domestic and Net National Product
Net Domestic Product (NDP) = GDP
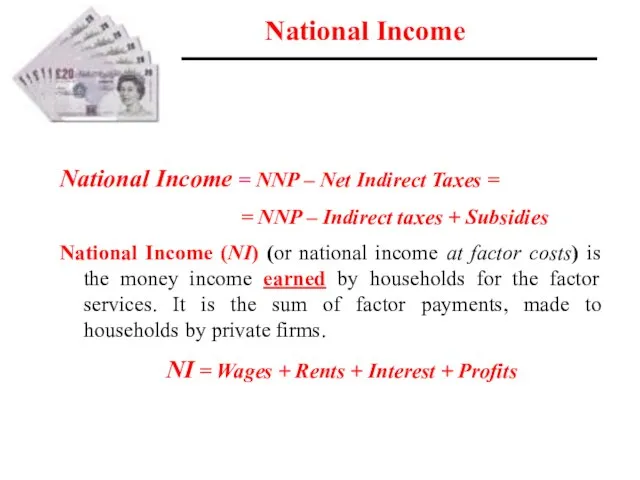
Слайд 37National Income
National Income = NNP – Net Indirect Taxes =
= NNP
National Income
National Income = NNP – Net Indirect Taxes =
= NNP
Слайд 38Personal Income
Personal income (PI) is the money income received by households before
Personal Income
Personal income (PI) is the money income received by households before
Слайд 39Disposable Income
Disposable income (DI) is the money income which is at the
Disposable Income
Disposable income (DI) is the money income which is at the
Слайд 40National Income Accounting: A Summary
GNP
at market
prices
C
GDP
at market
prices
NNP
at market
prices
Net Factor
Income
National Income Accounting: A Summary
GNP
at market
prices
C
GDP
at market
prices
NNP
at market
prices
Net Factor
Income
Слайд 41GDP as an Indicator of the True Level of National Output
Being the
GDP as an Indicator of the True Level of National Output
Being the
Слайд 42GDP as the Indicator of the Welfare and the Well-being
GDP and GNP
GDP as the Indicator of the Welfare and the Well-being
GDP and GNP

Слайд 43Net Economic Welfare
This indicator to estimate economic well-being was proposed in 1972
Net Economic Welfare
This indicator to estimate economic well-being was proposed in 1972
Слайд 44Nominal GDP versus Real GDP
Nominal GDP is GDP measured at current prices.
Nominal GDP versus Real GDP
Nominal GDP is GDP measured at current prices.
Слайд 45Example
Imagine, that the economy producers only bananas.
In 2011 the real GDP
Example
Imagine, that the economy producers only bananas.
In 2011 the real GDP
Слайд 46 If economy produces a great number of goods
(n goods,
If economy produces a great number of goods
(n goods,
Слайд 47Nominal and Real GDP in Russia, 1995-2010
Source: Goscomstat
Nominal and Real GDP in Russia, 1995-2010
Source: Goscomstat
Слайд 48Price Indexes
The measures of general price level are:
Consumer Price Index – CPI;
Producer
Price Indexes
The measures of general price level are:
Consumer Price Index – CPI;
Producer
Слайд 49The Consumer Price Index
is based on the prices of items in a
The Consumer Price Index
is based on the prices of items in a
Слайд 50The Producer Price Index
is based on the prices of items in a
The Producer Price Index
is based on the prices of items in a
Слайд 51The GDP Deflator
The Gross Domestic Product Deflator is an alternative general price
The GDP Deflator
The Gross Domestic Product Deflator is an alternative general price
Слайд 52
In order to convert any year's nominal GDP
(or any other nominal
In order to convert any year's nominal GDP (or any other nominal
Слайд 53CPI versus GDP deflator
CPI versus GDP deflator
Слайд 54How to Measure Inflation
Inflation is a sustained increase in the overall price
How to Measure Inflation
Inflation is a sustained increase in the overall price
Слайд 55
Nominal GDP in year t = Price Level in year t ×
Nominal GDP in year t = Price Level in year t ×
Слайд 56Actual and Potential Real GDP
But annual (short-run) output can deviate from output
Actual and Potential Real GDP
But annual (short-run) output can deviate from output
Слайд 57Actual versus Potential Real GDP
Actual real GDP (Y)
Short run period.
Measures changes in
Actual versus Potential Real GDP
Actual real GDP (Y)
Short run period.
Measures changes in
Слайд 58The Business Cycle
The business cycle is the fluctuations in the economic
The Business Cycle
The business cycle is the fluctuations in the economic
Слайд 59US Business Cycle: Fluctuations in Total Production Relative to the Long-run Growth
US Business Cycle: Fluctuations in Total Production Relative to the Long-run Growth
Слайд 60The GDP Gap
The deviation of actual real GDP (Y) from its potential
The GDP Gap
The deviation of actual real GDP (Y) from its potential
Слайд 61Recessionary versus Inflationary GDP Gap
Recessionary versus Inflationary GDP Gap
Слайд 62Behavior of Macroeconomic Variables During the Business Cycle
Behavior of Macroeconomic Variables During the Business Cycle
Слайд 63The Rate of Growth
The rate of growth (g) is an important macroeconomic
The Rate of Growth
The rate of growth (g) is an important macroeconomic
Слайд 64Growth Rates of Real GDP Across the Countries
2003-2010 (%)
Source: World Bank and
Growth Rates of Real GDP Across the Countries
2003-2010 (%)
Source: World Bank and
Слайд 65Growth Rates of Real GDP in Russia, 1996-2010
Source: Goscomstat
Growth Rates of Real GDP in Russia, 1996-2010
Source: Goscomstat
Слайд 66How to Measure the Standard of Living
The best measure for the productive
How to Measure the Standard of Living
The best measure for the productive
Слайд 67Standards of Living Worldwide, 2010
Source: CIA – The World Factbook
Standards of Living Worldwide, 2010
Source: CIA – The World Factbook
 Отчёт о деятельности исполкома TARENA в 2007году и задачи на 2008 год. Руководитель Исполкома TARENA академик МИА и МАНВШ, профессор Садык
 Презентация на тему Проверь свои знания правил пожарной безопасности
 Животный мир степей России
 Шаблон презентации для магистерской диссертации. Луганский национальный университет имени Тараса Шевченко
 Викторина о профессиях
 Песколовки
 Презентация на тему Суд и процесс
  Лекция 7. Городское и сельское население.
 Офисное помещение 181 кв.м на Невском, напротив метро «Маяковская»
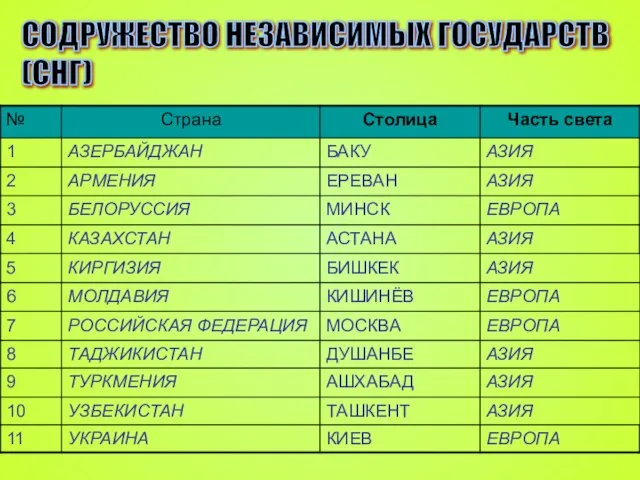 Содружество Независимых Государств (СНГ)
 ФИЗИОЛОГИЧЕСКИЕ ОСНОВЫ АДАПТАЦИИ К ФИЗИЧЕСКИМ НАГРУЗКАМ
 МОНТЁРСКИЙ РЭП
 «Я не писательница, у меня есть профессия…»
 Презентация на тему Социальная мобильность
  Ателье-мастерская
 Подготовка к ЕГЭ по обществознанию
 Методики управления материальными запасами хозяйствующего субъекта
 Моя конвенция
 Техника бега на короткие дистанции
 Обои и шторы
 Презентация Научная и популярная психология для Клуба
 Сборочный чертёж
  ДЕКЛАРИРОВАНИЕ РОЗНИЧНОЙ ПРОДАЖИ АЛКОГОЛЬНОЙ И СПИРТОСОДЕРЖАЩЕЙ ПРОДУКЦИИ
 Класс Земноводные или Амфибии
 Суперкомпьютеры
 в школе
 Научно-производственное предприятие «Грант»
 Открытие магазина DNS в г. Межгорье, требуются универсальные продавцы-консультанты