- nature of the data

Содержание
- 2. Planned 1.1 Statistical process and its stages. 1.2 Primary and secondary data. 1.3 Data collection process.
- 3. The branch of mathematics that transforms data into useful information for decision makers Collecting, summarizing, presenting
- 4. 1.1 Statistical process and its stages Statistical process is a series of steps that lead to
- 5. 1.1 Statistical process and its stages Statistical process is a series of steps that lead to
- 6. 1.1 Statistical process and its stages Statistical process is a series of steps that lead to
- 7. 1.1 Statistical process and its stages Statistical process is a series of steps that lead to
- 8. Practice Identify the population, sample, individual for each research objective: A quality control manager randomly selects
- 9. Terms and Definitions Data represents information, usually numerical or categorical. A variable is a characteristic of
- 10. Types of variables Examples: Marital Status Political Party Eye Color (Defined categories) Examples: Number of Children
- 11. Sources of data A census Survey sampling (observational study) Designed experiments
- 12. 1.2 Primary and secondary data Primary Sources: The data collector is the one using the data
- 13. 1.3 Data collection process. A census A modern Population Census is a total process of collecting,
- 14. 1.4 Survey sampling Survey sampling describes the process of selecting a sample of elements from a
- 15. Examples of Survey Data Political polls of registered voters during political campaigns. People being surveyed to
- 16. Types of questions for the survey Single-select multiple choice Multi-select multiple choice Rating on a scale
- 17. Observational study Data obtained from a survey sample or census lead to an observational study, …which
- 18. 1.5 Designed experiment A designed experiment applies a treatment to individuals (experimental units) and attempts to
- 19. Examples of Data From A Designed Experiment Consumer testing of different versions of a product to
- 20. Experiment or Observational study? Observational study To learn characteristics of a population To determine whether there
- 21. Assess your understanding Explain the difference between a population and a sample. Give 5 examples of
- 22. Methods of Data Collection Between-group/Between-subject/independent Different entities in experimental conditions Repeated measures (within-subject) The same entities
- 23. Class Assignment #1 Select your favorite brand / company (Ex. Pepsi-Cola or PepsiCo Inc.) for survey
- 24. Course content 1. Data Collection 2. Sampling methods 3. Data Visualization 4. Variation 5. Basic Probability
- 26. Скачать презентацию
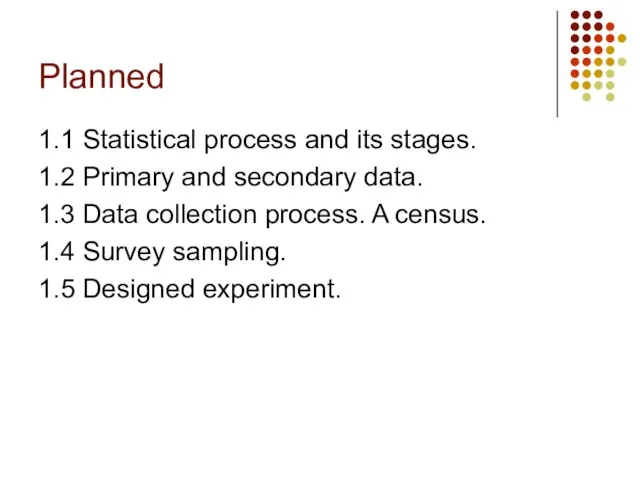
Слайд 2Planned
1.1 Statistical process and its stages.
1.2 Primary and secondary data.
1.3 Data collection
Planned
1.1 Statistical process and its stages.
1.2 Primary and secondary data.
1.3 Data collection
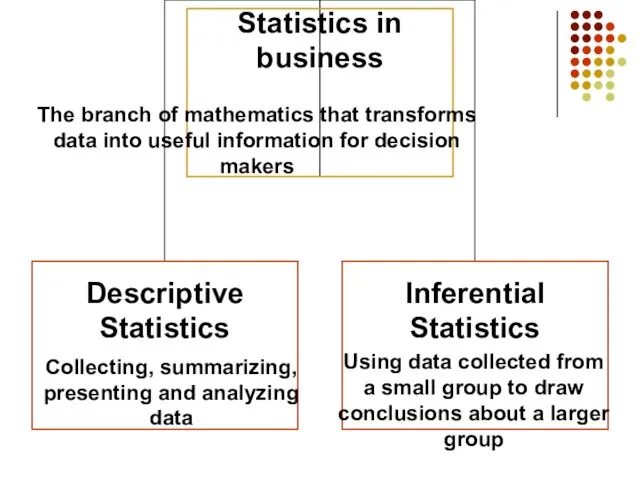
Слайд 3The branch of mathematics that transforms data into useful information for decision
The branch of mathematics that transforms data into useful information for decision
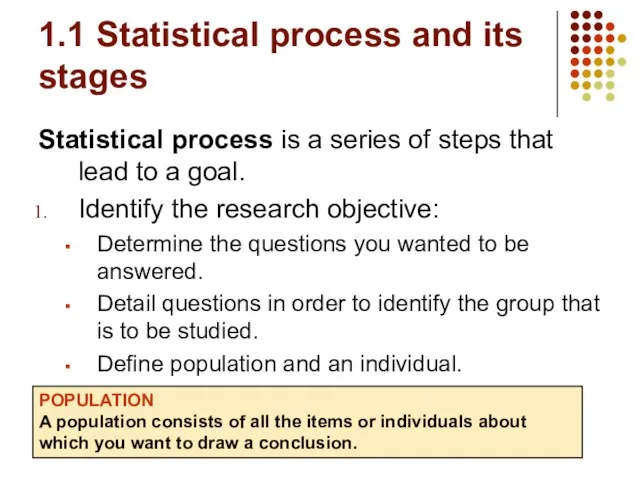
Слайд 41.1 Statistical process and its stages
Statistical process is a series of steps
1.1 Statistical process and its stages
Statistical process is a series of steps
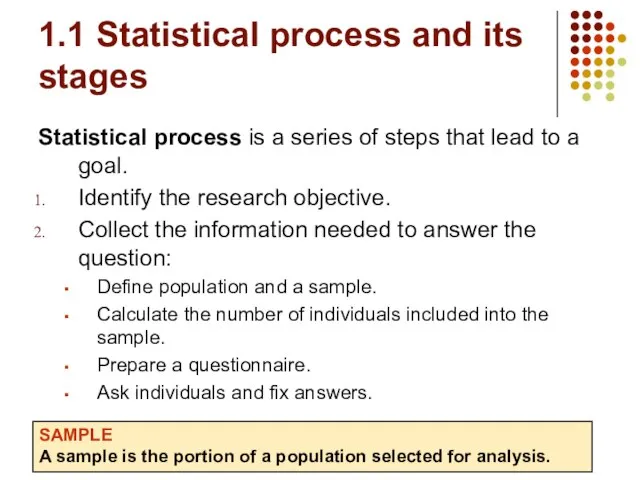
Слайд 51.1 Statistical process and its stages
Statistical process is a series of steps
1.1 Statistical process and its stages
Statistical process is a series of steps
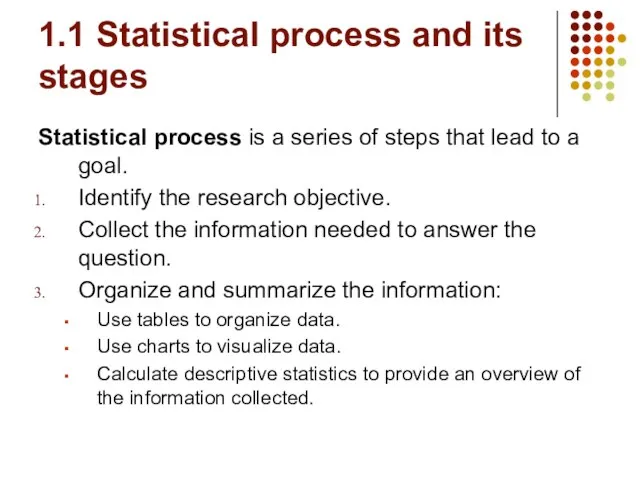
Слайд 61.1 Statistical process and its stages
Statistical process is a series of steps
1.1 Statistical process and its stages
Statistical process is a series of steps
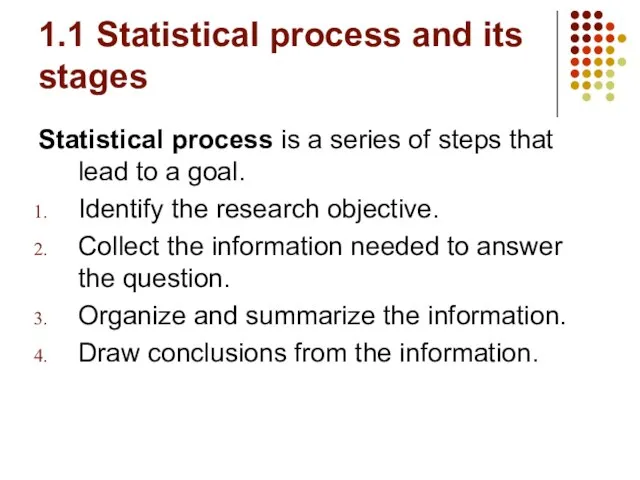
Слайд 71.1 Statistical process and its stages
Statistical process is a series of steps
1.1 Statistical process and its stages
Statistical process is a series of steps
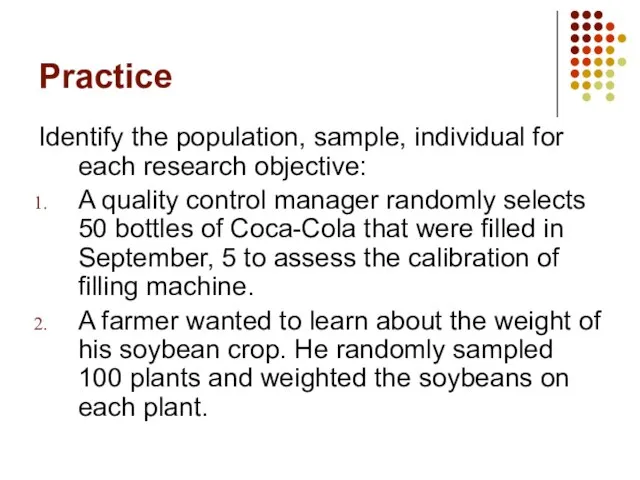
Слайд 8Practice
Identify the population, sample, individual for each research objective:
A quality control manager
Practice
Identify the population, sample, individual for each research objective:
A quality control manager
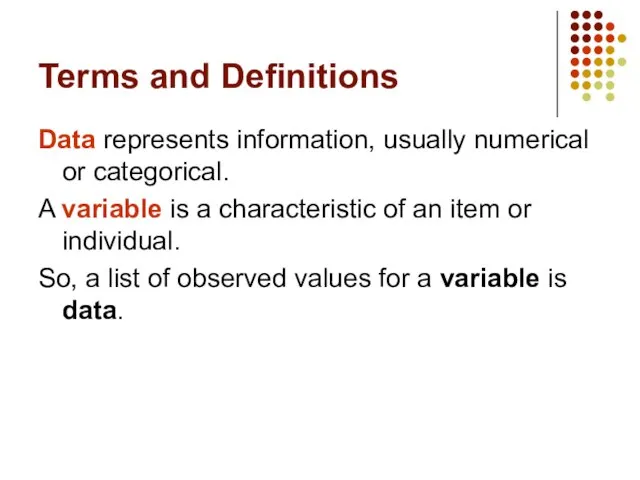
Слайд 9Terms and Definitions
Data represents information, usually numerical or categorical.
A variable is a
Terms and Definitions
Data represents information, usually numerical or categorical.
A variable is a
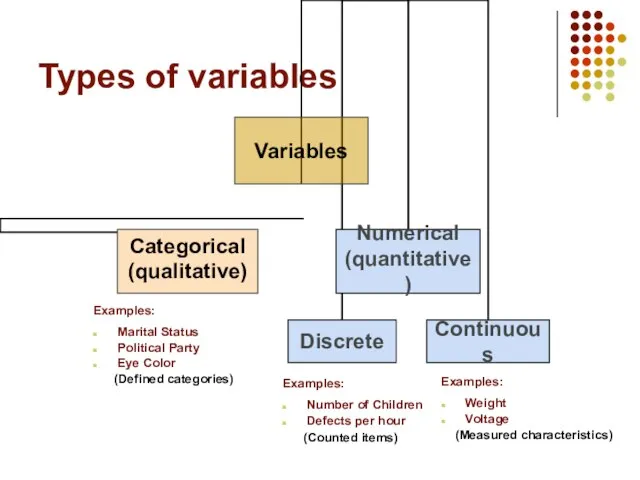
Слайд 10Types of variables
Examples:
Marital Status
Political Party
Eye Color
(Defined categories)
Examples:
Number of Children
Defects per hour
Types of variables
Examples:
Marital Status
Political Party
Eye Color
(Defined categories)
Examples:
Number of Children
Defects per hour
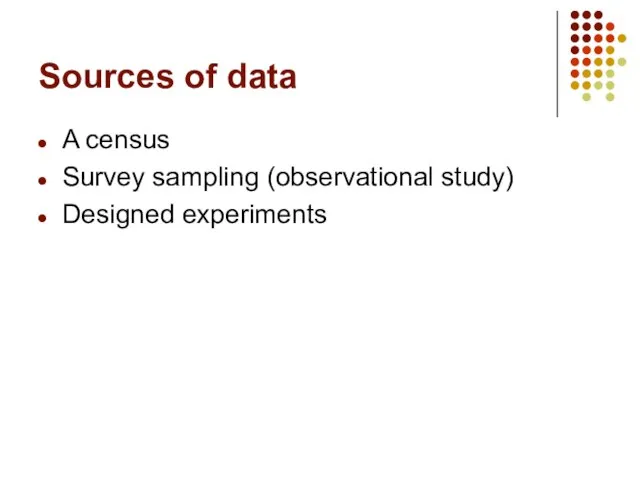
Слайд 11Sources of data
A census
Survey sampling (observational study)
Designed experiments
Sources of data
A census
Survey sampling (observational study)
Designed experiments
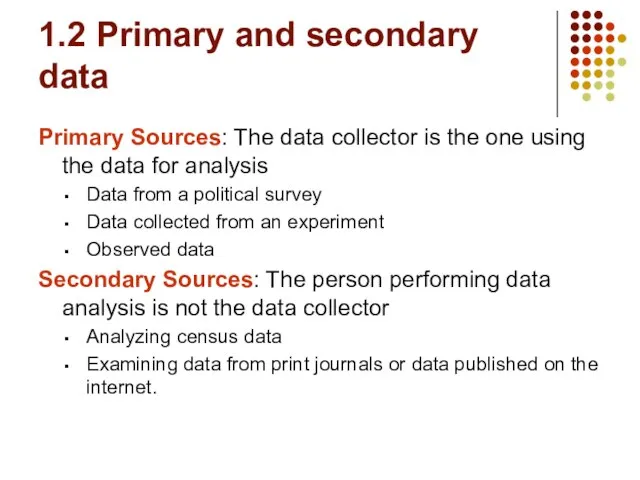
Слайд 121.2 Primary and secondary data
Primary Sources: The data collector is the one
1.2 Primary and secondary data
Primary Sources: The data collector is the one
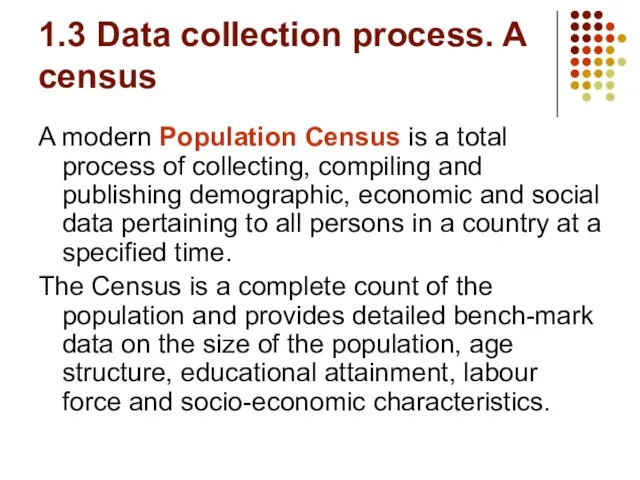
Слайд 131.3 Data collection process. A census
A modern Population Census is a total
1.3 Data collection process. A census
A modern Population Census is a total
Слайд 141.4 Survey sampling
Survey sampling describes the process of selecting a sample of elements
1.4 Survey sampling
Survey sampling describes the process of selecting a sample of elements
Слайд 15Examples of Survey Data
Political polls of registered voters during political campaigns.
People being
Examples of Survey Data
Political polls of registered voters during political campaigns.
People being
Слайд 16Types of questions for the survey
Single-select multiple choice
Multi-select multiple choice
Rating on a
Types of questions for the survey
Single-select multiple choice
Multi-select multiple choice
Rating on a
Слайд 17Observational study
Data obtained from a survey sample or census lead to an
Observational study
Data obtained from a survey sample or census lead to an
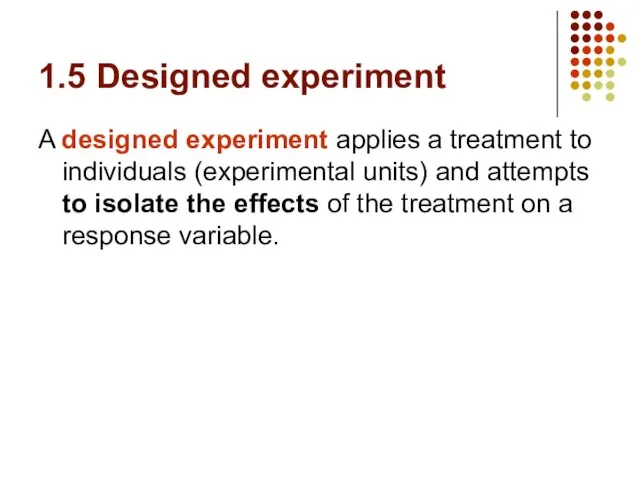
Слайд 181.5 Designed experiment
A designed experiment applies a treatment to individuals (experimental units)
1.5 Designed experiment
A designed experiment applies a treatment to individuals (experimental units)
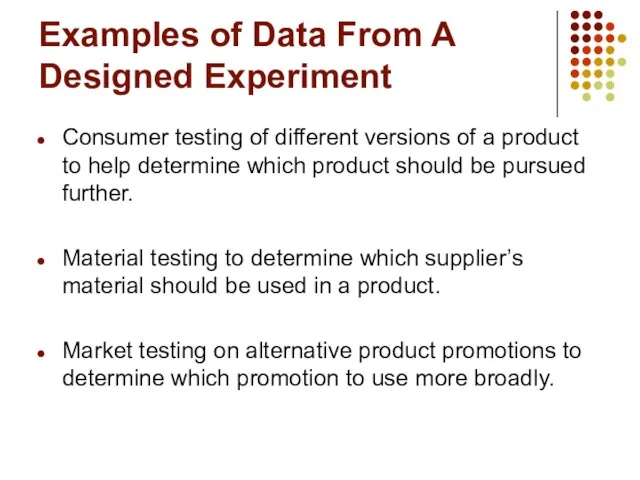
Слайд 19Examples of Data From A Designed Experiment
Consumer testing of different versions of
Examples of Data From A Designed Experiment
Consumer testing of different versions of
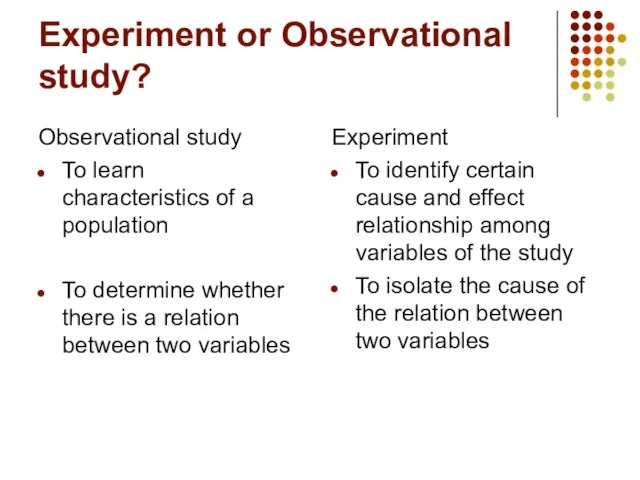
Слайд 20Experiment or Observational study?
Observational study
To learn characteristics of a population
To determine whether
Experiment or Observational study?
Observational study
To learn characteristics of a population
To determine whether
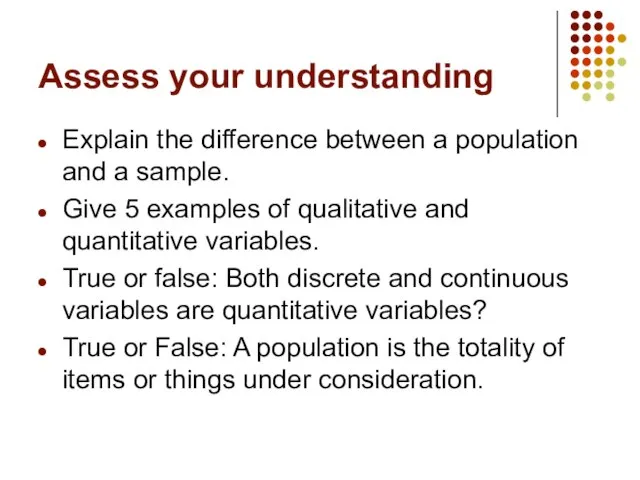
Слайд 21Assess your understanding
Explain the difference between a population and a sample.
Give 5
Assess your understanding
Explain the difference between a population and a sample.
Give 5
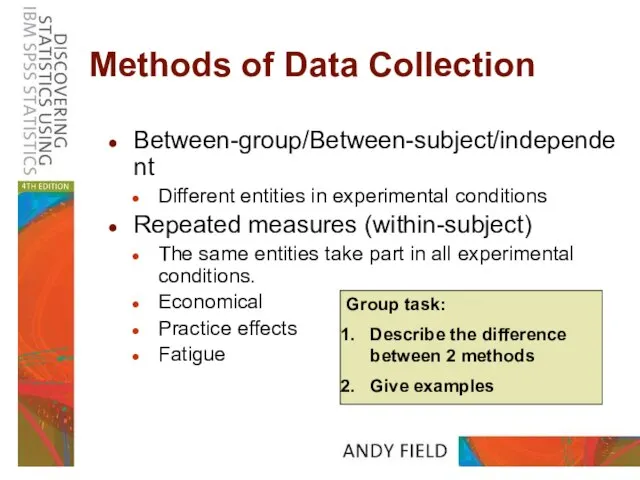
Слайд 22Methods of Data Collection
Between-group/Between-subject/independent
Different entities in experimental conditions
Repeated measures (within-subject)
The same entities
Methods of Data Collection
Between-group/Between-subject/independent
Different entities in experimental conditions
Repeated measures (within-subject)
The same entities
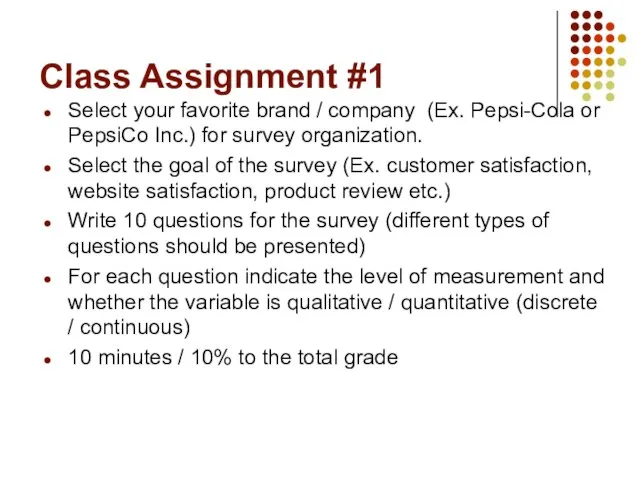
Слайд 23Class Assignment #1
Select your favorite brand / company (Ex. Pepsi-Cola or PepsiCo
Class Assignment #1
Select your favorite brand / company (Ex. Pepsi-Cola or PepsiCo
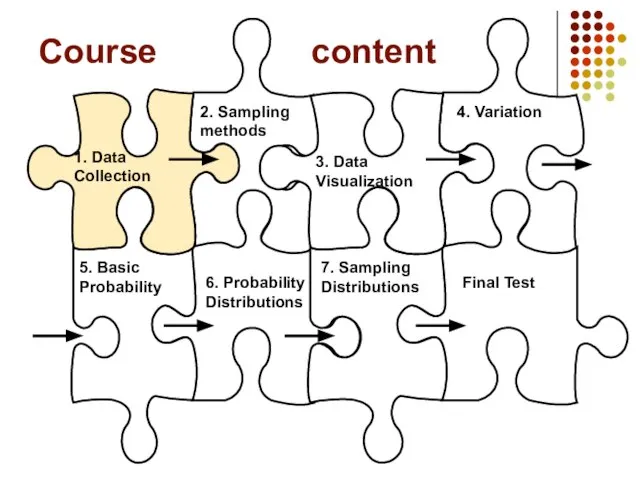
Слайд 24Course content
1. Data
Collection
2. Sampling
methods
3. Data
Visualization
4. Variation
5. Basic
Probability
6. Probability
Distributions
7. Sampling
Course content
1. Data
Collection
2. Sampling
methods
3. Data
Visualization
4. Variation
5. Basic
Probability
6. Probability
Distributions
7. Sampling
 ЭКОНОМИКА ПРИРОДОПОЛЬЗОВАНИЯ
 Заполнение формы 0503737. Отчет об исполнении учреждением плана его финансово-хозяйственной деятельности
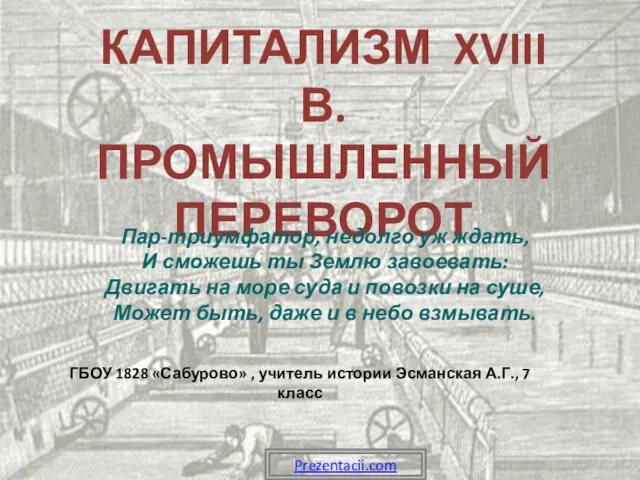 Капитализм в XVIII в. Промышленный переворот
 Наша мануфактура – это команда профессионалов. Нас объединяет жизненный оптимизм и желание изменить жизнь к лучшему. Мы ценим про
 ГБУ Озеленение и МОСЗЕЛЕНХОЗ
 Кружок "Ловкие пальчики"
 20220906___1__v3
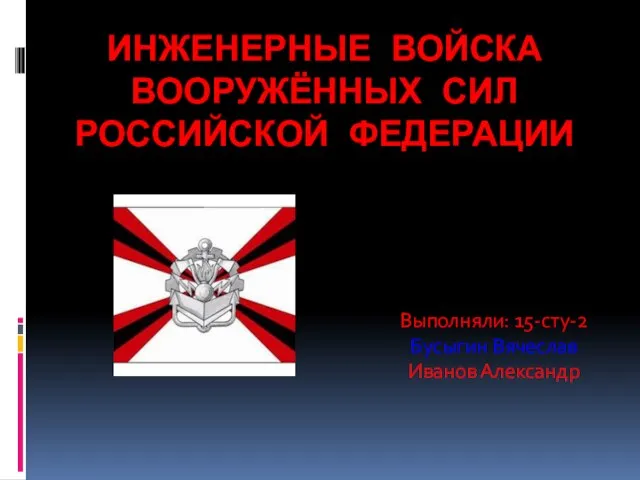 Инженерные войска Вооружённых Сил Российской Федерации
 Маркетинг в социальных сетях
 Динамика инцидентов
 3.6. Определение, прогнозирование и оценка риска
 Толерантность
  В наших выступлениях соединены самые искусные и эффектные виды фристайла: Футбольный фристайл (Чемпион России по версии Red Bull Street St
 Основные достижения Павла I
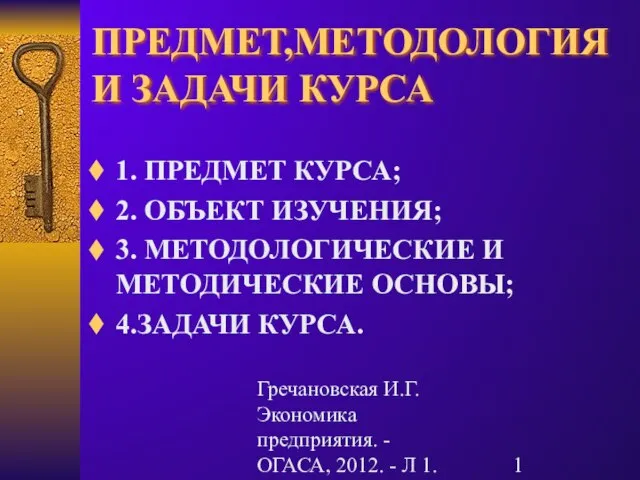 Предмет, методология и задачи курса
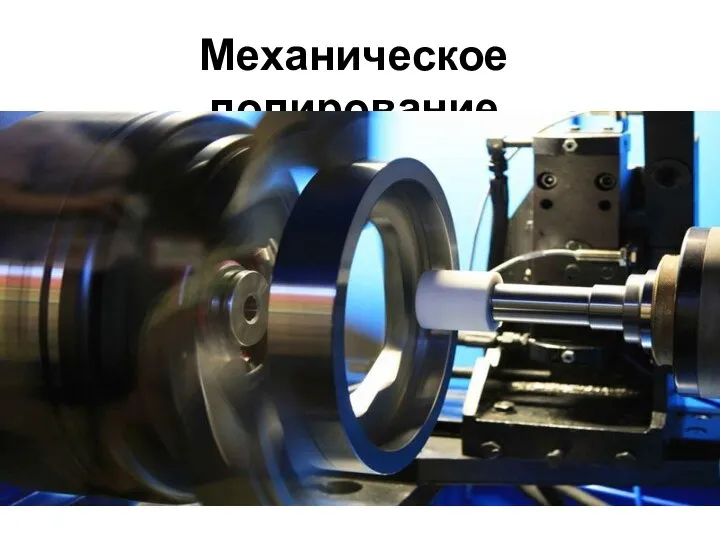 Механическое полирование
 Законодательное регулирование льготного социального обеспечения
 Одежда и обувь
 Центр Милтон по изучению юдаики
 Культура Тибета
 Магазин детских игрушек SPEED PIPES. Доставка по всей Украине
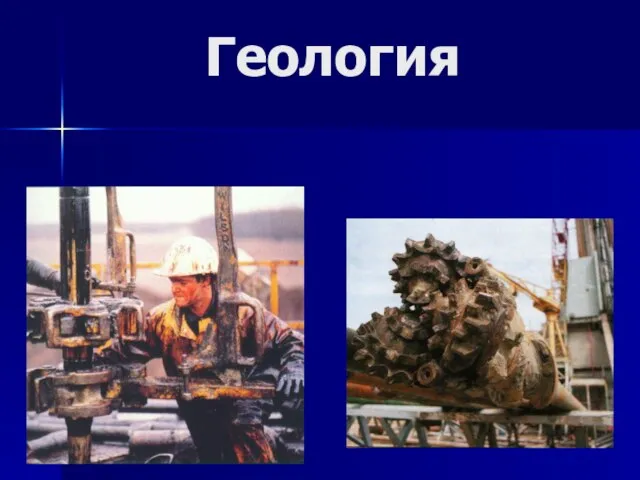 Геология
 Эволюция телефонной связи
 Формирование состава экспертов в соответствии с порядком проведения ГИА с применением механизма ДЭ и НОК
 Юридическая обработка информации в спс
 Техника метания малого мяча. Задание 2
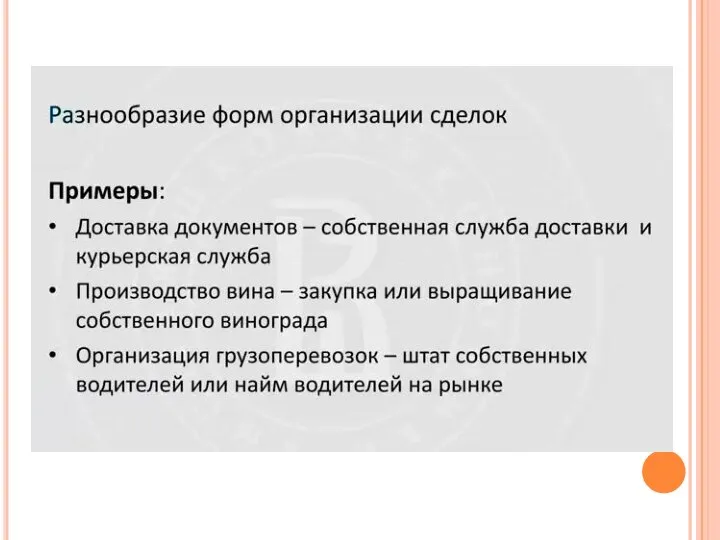 Трансакционные издержки
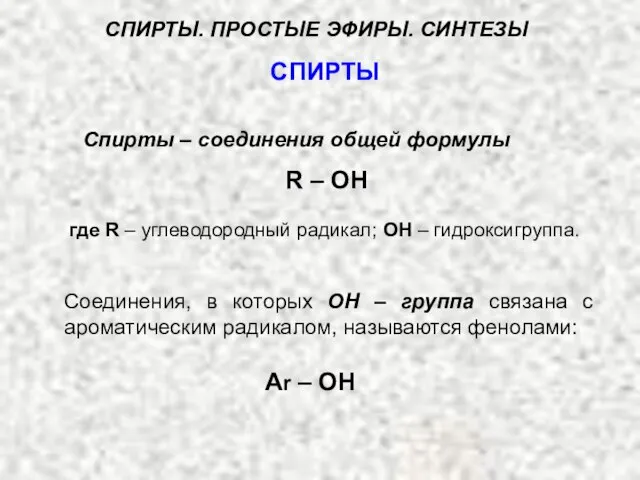 СПИРТЫ