- Renewable Energy Sources

Содержание
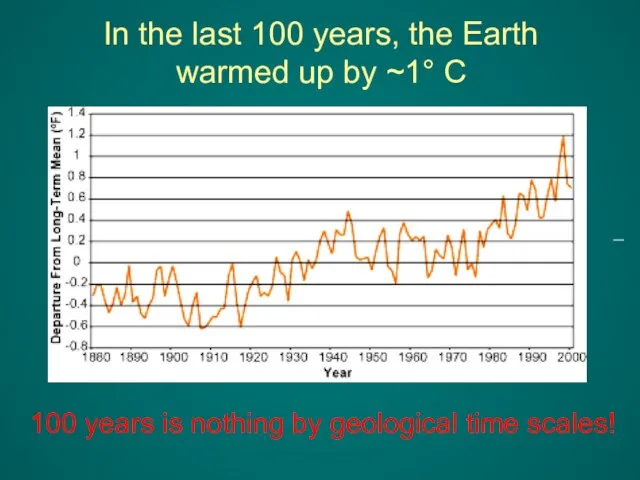
- 2. In the last 100 years, the Earth warmed up by ~1° C 100 years is nothing
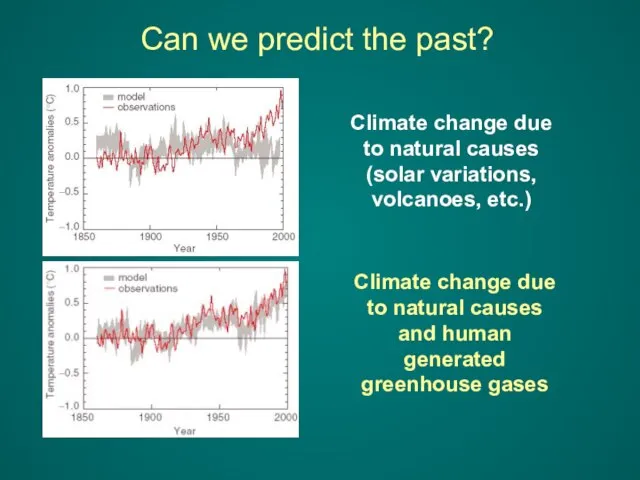
- 3. Climate change due to natural causes (solar variations, volcanoes, etc.) Can we predict the past?
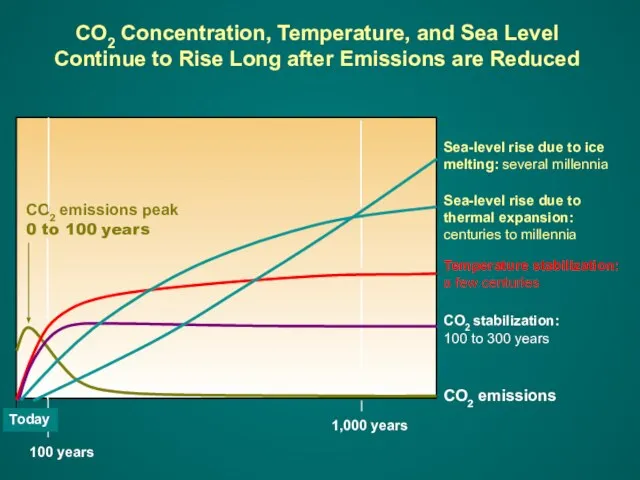
- 4. CO2 Concentration, Temperature, and Sea Level Continue to Rise Long after Emissions are Reduced 100 years
- 5. The possibility / likelihood of global warming is disturbing … … but there may be a
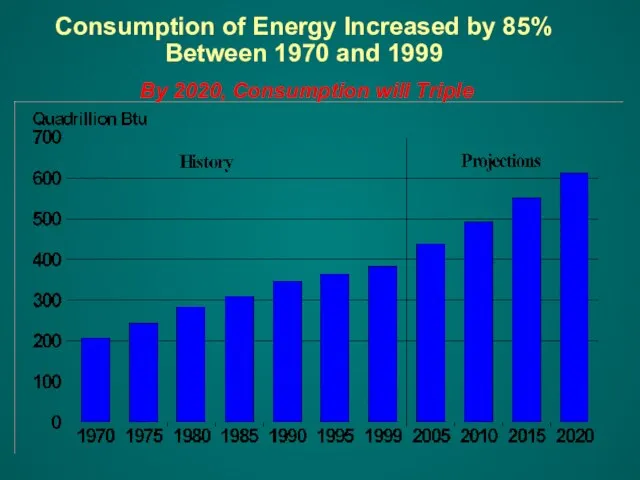
- 6. Consumption of Energy Increased by 85% Between 1970 and 1999 By 2020, Consumption will Triple
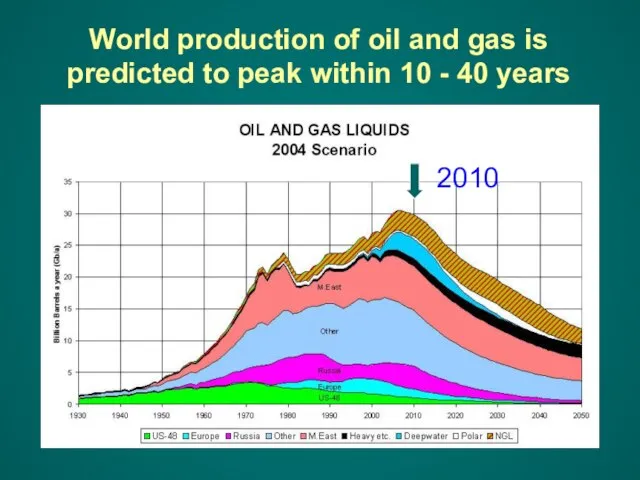
- 7. World production of oil and gas is predicted to peak within 10 - 40 years
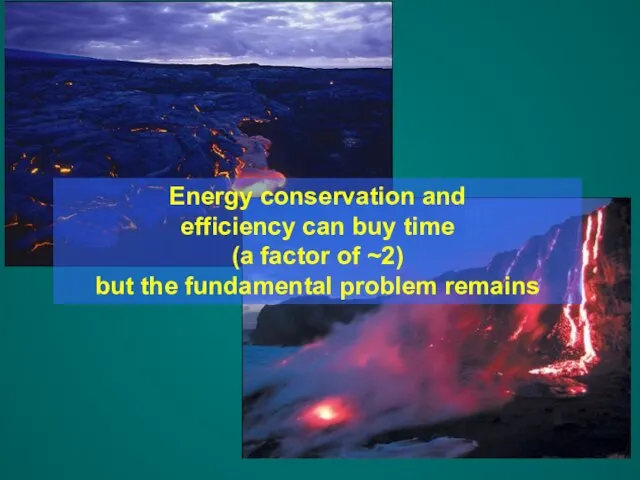
- 8. Energy conservation and efficiency can buy time (a factor of ~2) but the fundamental problem remains
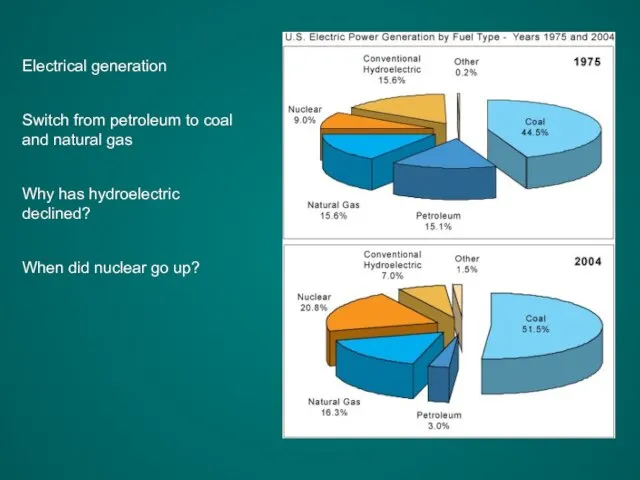
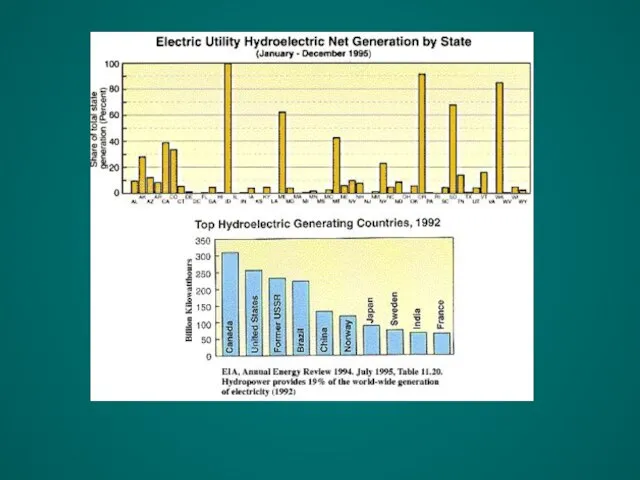
- 10. Electrical generation Switch from petroleum to coal and natural gas Why has hydroelectric declined? When did
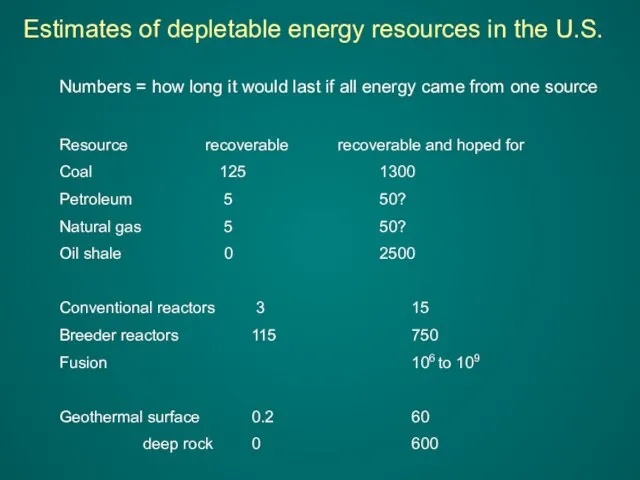
- 11. Numbers = how long it would last if all energy came from one source Resource recoverable
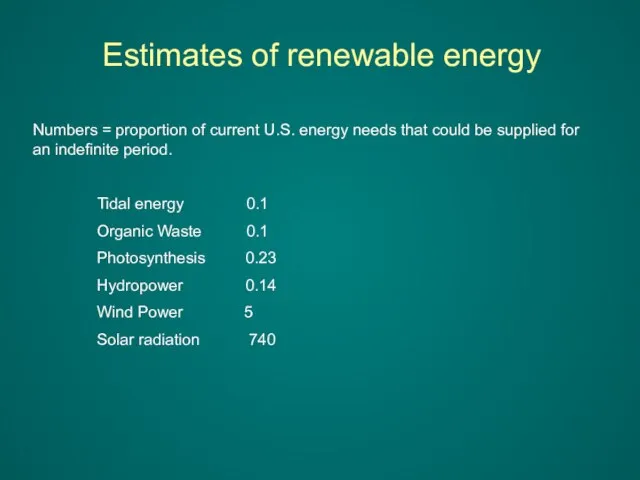
- 12. Numbers = proportion of current U.S. energy needs that could be supplied for an indefinite period.
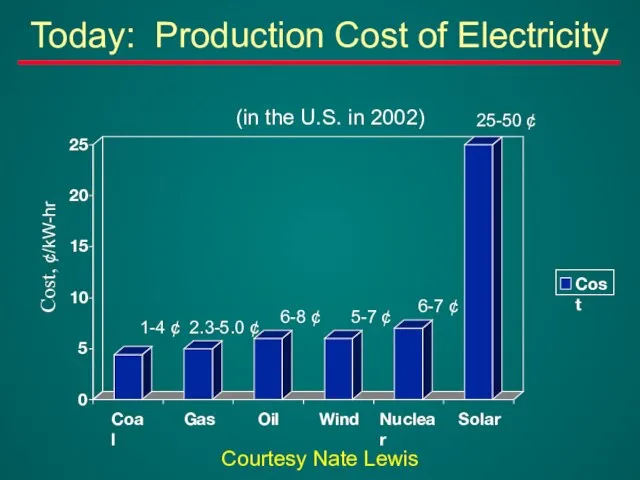
- 13. (in the U.S. in 2002) 1-4 ¢ 2.3-5.0 ¢ 6-8 ¢ 5-7 ¢ Today: Production Cost
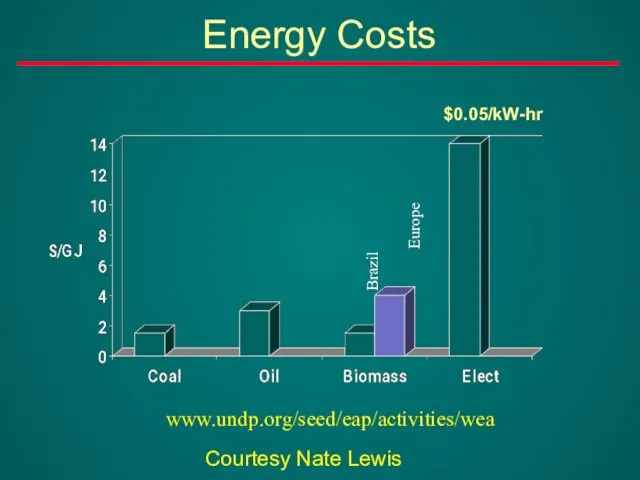
- 14. Energy Costs Brazil Europe $0.05/kW-hr www.undp.org/seed/eap/activities/wea Courtesy Nate Lewis
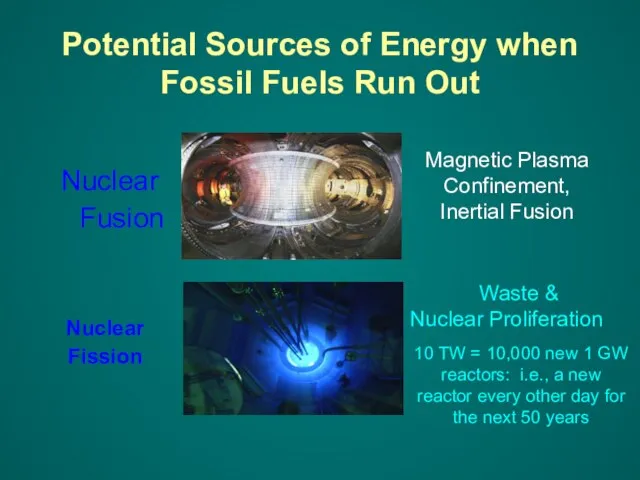
- 15. Potential Sources of Energy when Fossil Fuels Run Out Nuclear Fission Magnetic Plasma Confinement, Inertial Fusion
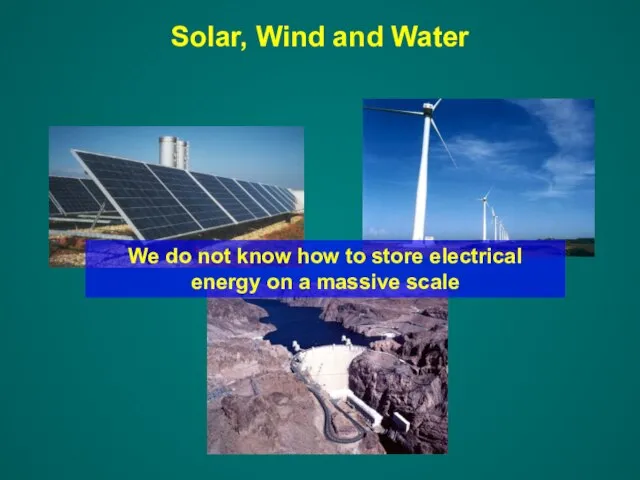
- 16. Solar, Wind and Water We do not know how to store electrical energy on a massive
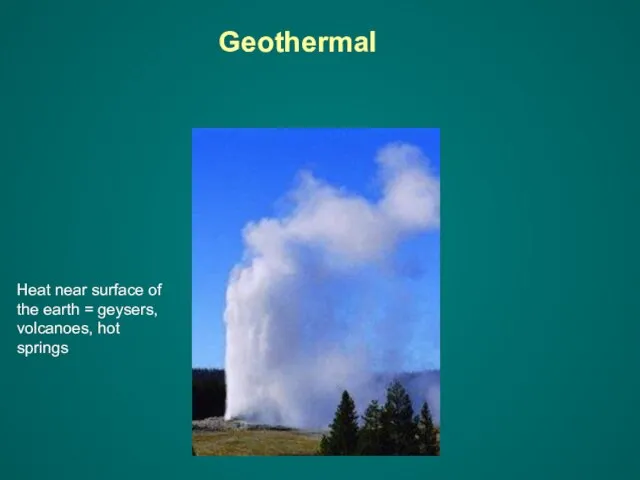
- 17. Geothermal Heat near surface of the earth = geysers, volcanoes, hot springs
- 18. Photosynthesis Photovoltaic and electricity to chemical H O O H 2 2 2 sc M e
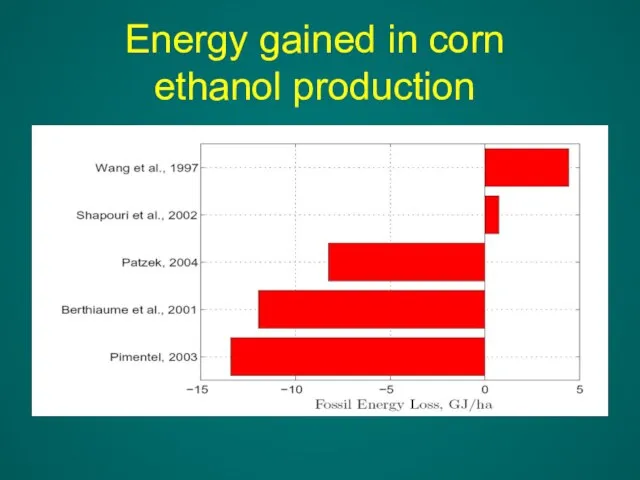
- 19. Energy gained in corn ethanol production
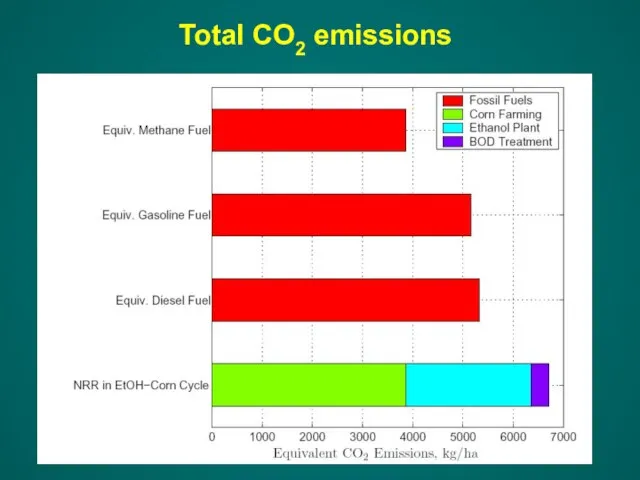
- 20. Total CO2 emissions
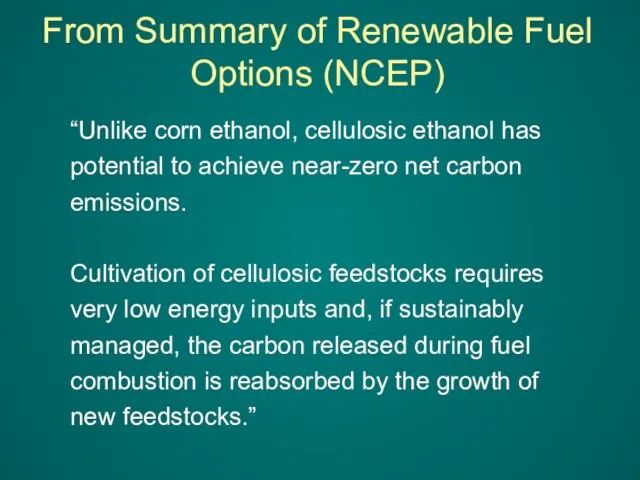
- 21. From Summary of Renewable Fuel Options (NCEP) “Unlike corn ethanol, cellulosic ethanol has potential to achieve
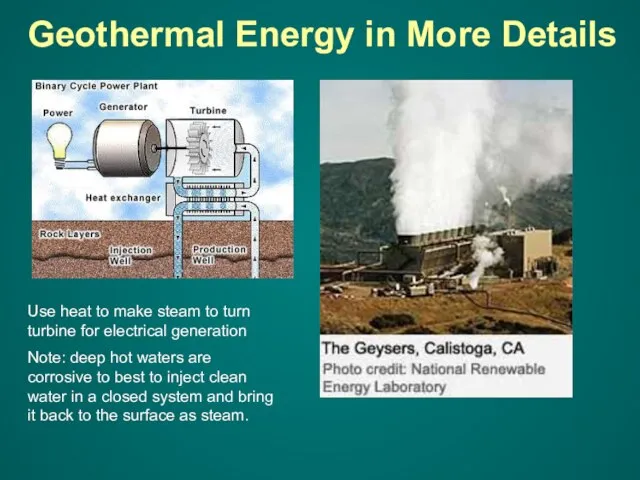
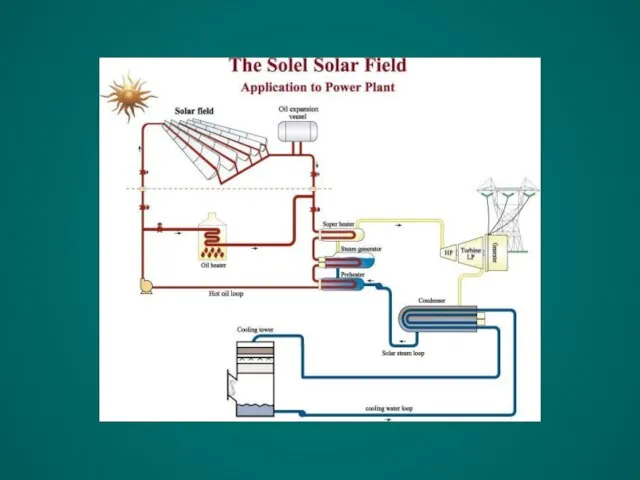
- 22. Use heat to make steam to turn turbine for electrical generation Note: deep hot waters are
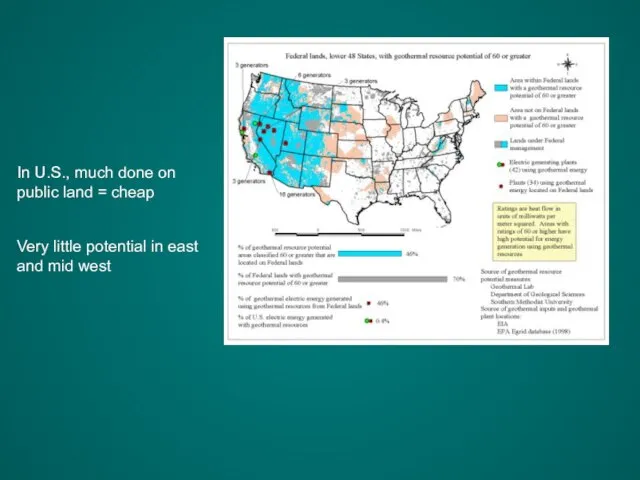
- 23. In U.S., much done on public land = cheap Very little potential in east and mid
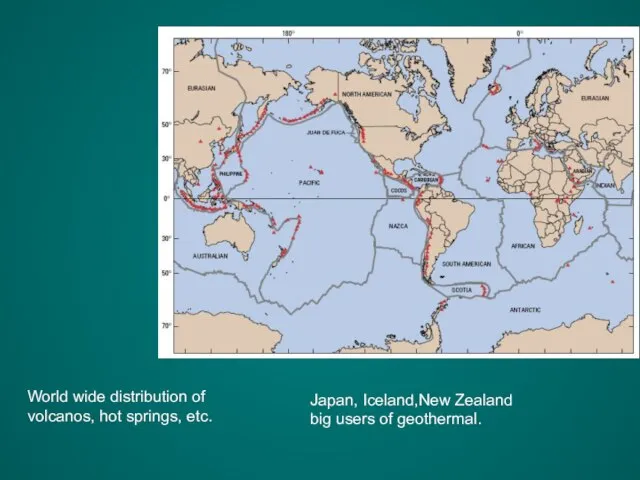
- 24. World wide distribution of volcanos, hot springs, etc. Japan, Iceland,New Zealand big users of geothermal.
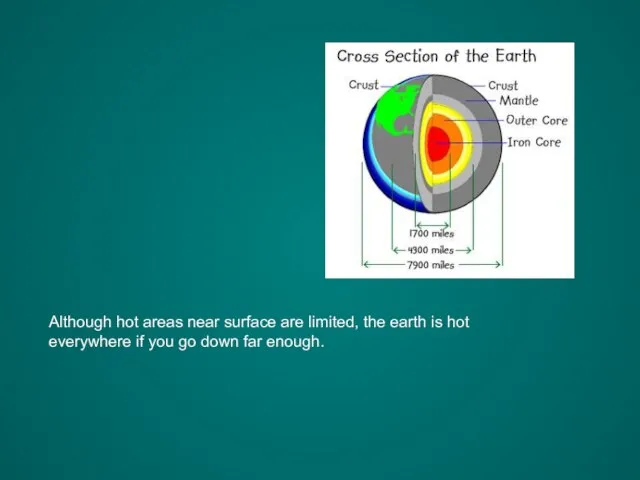
- 26. Although hot areas near surface are limited, the earth is hot everywhere if you go down
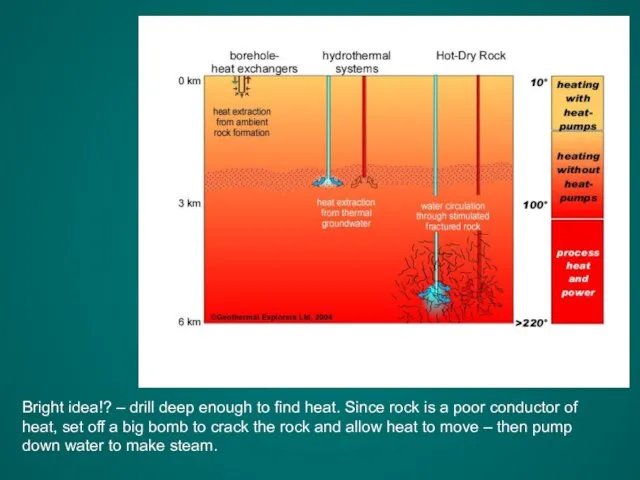
- 27. Bright idea!? – drill deep enough to find heat. Since rock is a poor conductor of
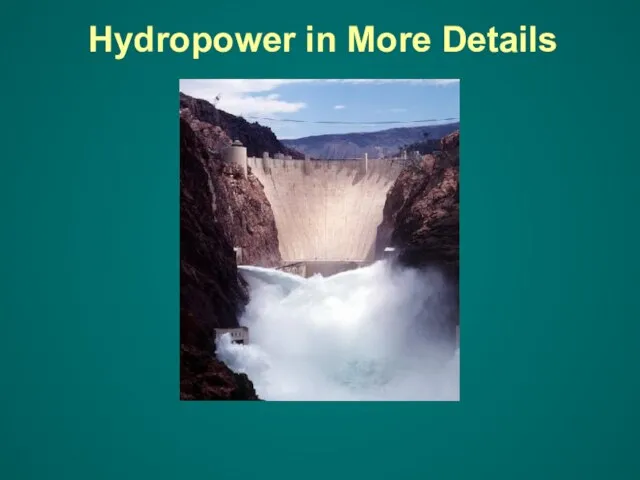
- 28. Hydropower in More Details
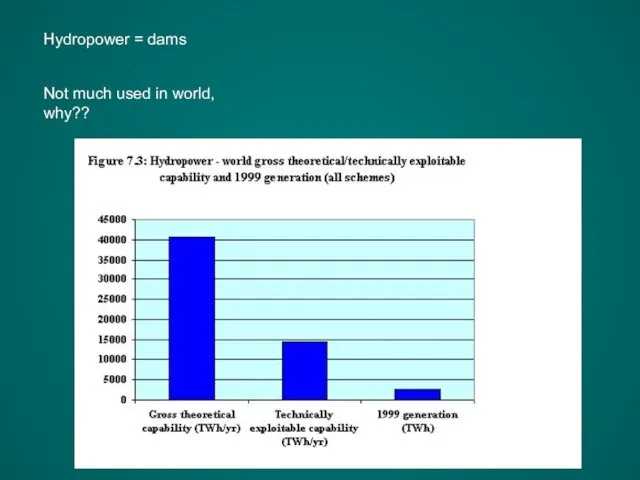
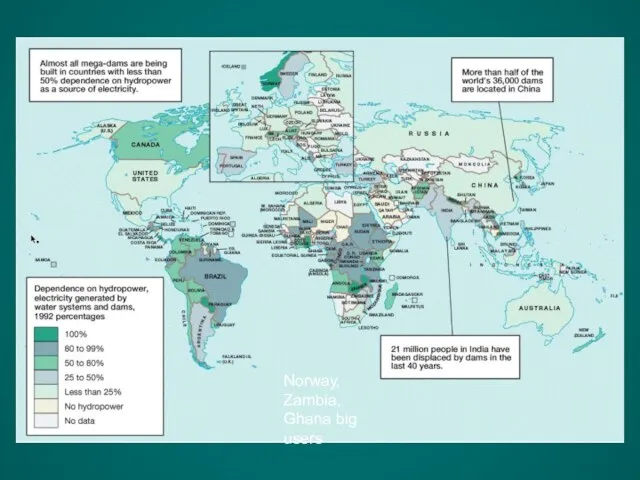
- 29. Hydropower = dams Not much used in world, why??
- 30. Norway, Zambia, Ghana big users
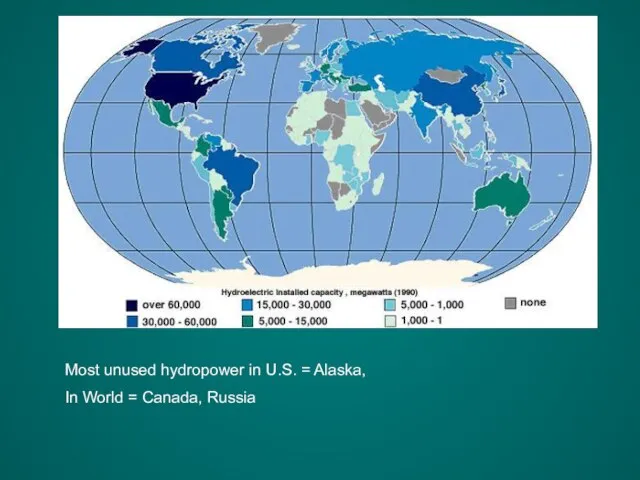
- 32. Most unused hydropower in U.S. = Alaska, In World = Canada, Russia
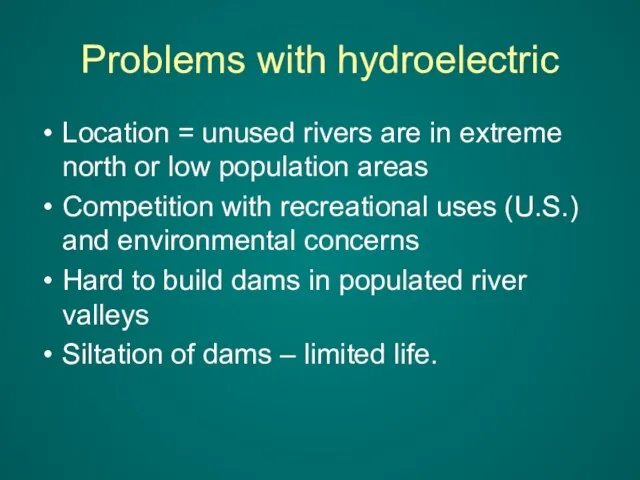
- 33. Problems with hydroelectric Location = unused rivers are in extreme north or low population areas Competition
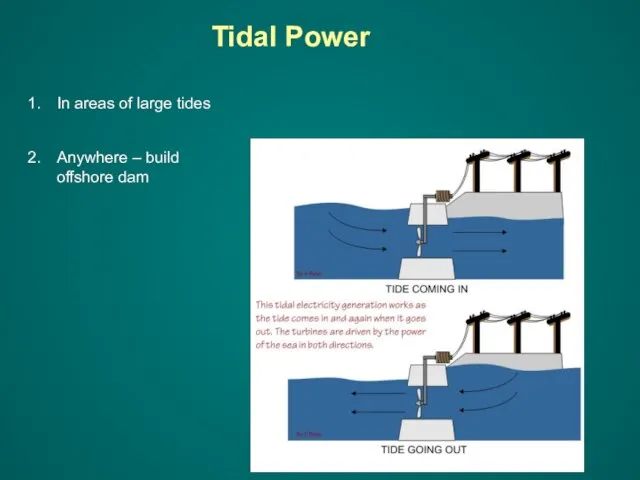
- 34. Tidal Power In areas of large tides Anywhere – build offshore dam
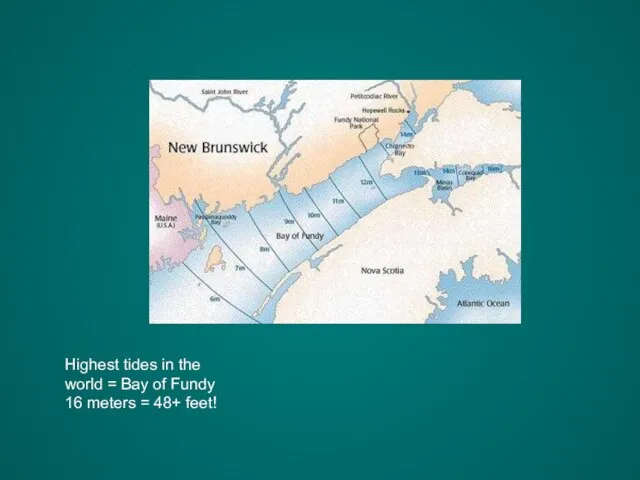
- 35. Highest tides in the world = Bay of Fundy 16 meters = 48+ feet!
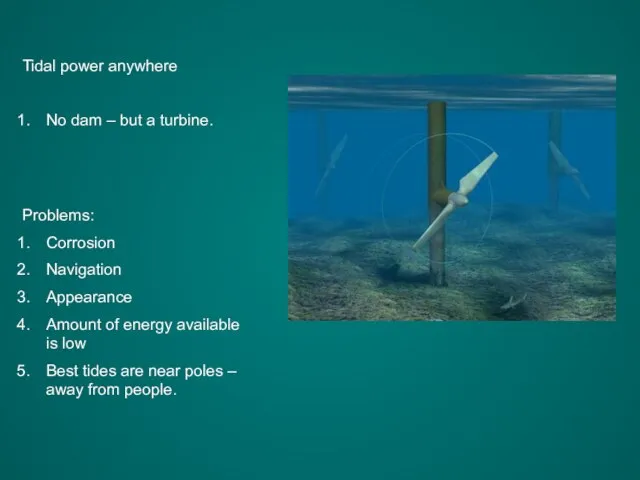
- 36. Tidal power anywhere No dam – but a turbine. Problems: Corrosion Navigation Appearance Amount of energy
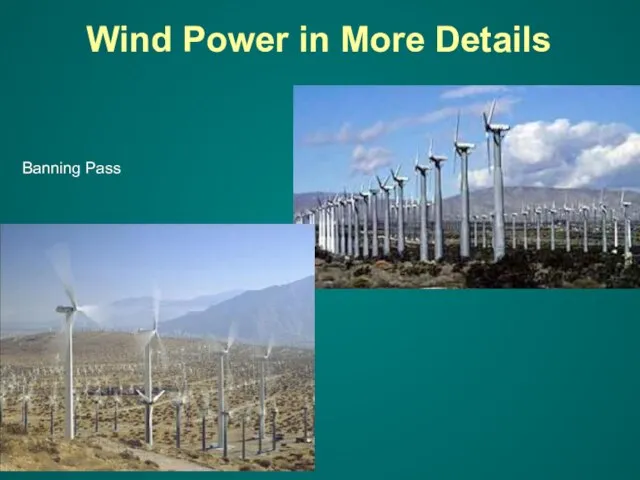
- 37. Banning Pass Wind Power in More Details
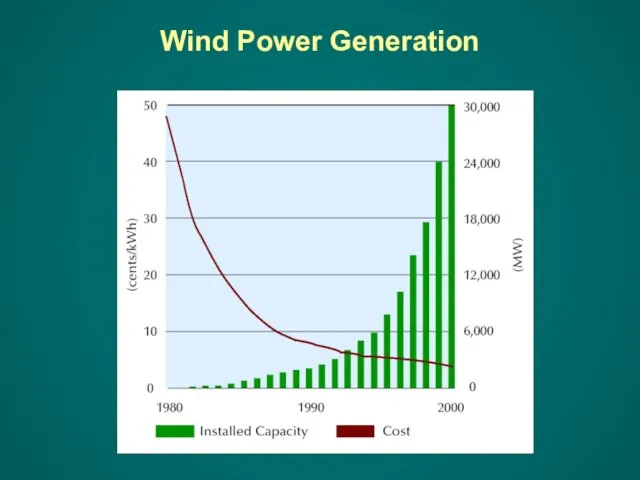
- 38. Wind Power Generation
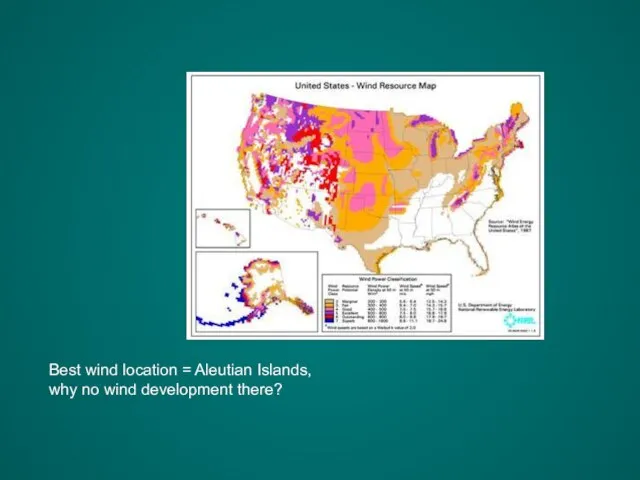
- 39. Best wind location = Aleutian Islands, why no wind development there?
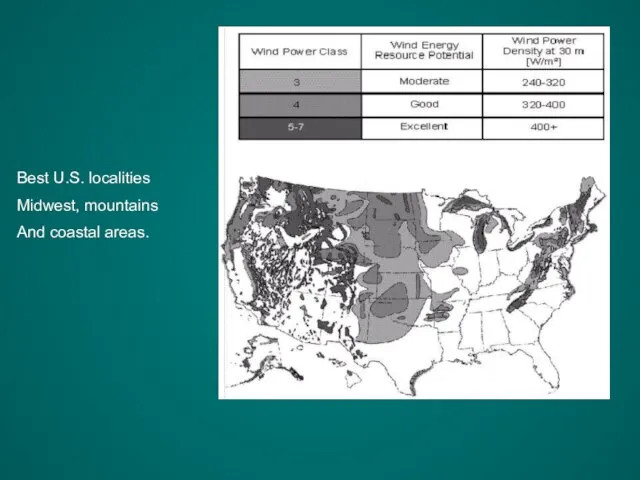
- 40. Best U.S. localities Midwest, mountains And coastal areas.
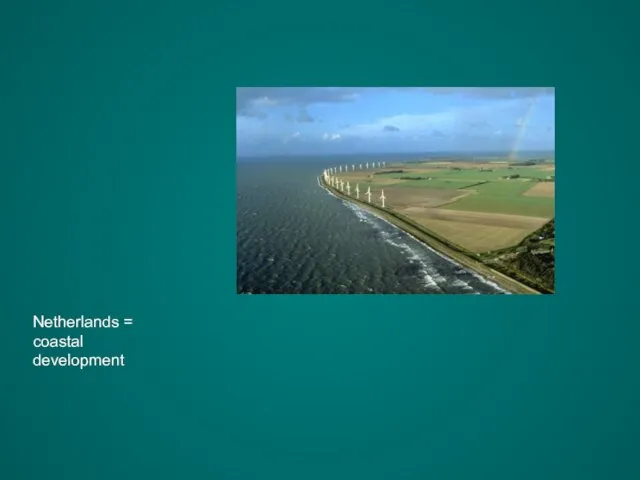
- 42. Netherlands = coastal development
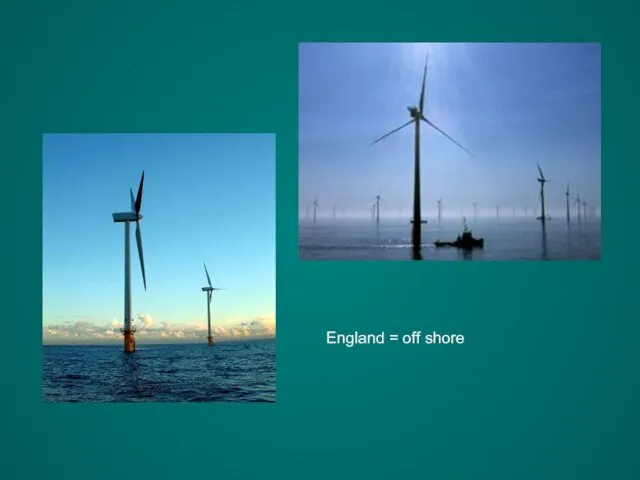
- 43. England = off shore
- 44. Wind energy problems Location – near population center Bird migration – Visual Must be coupled with
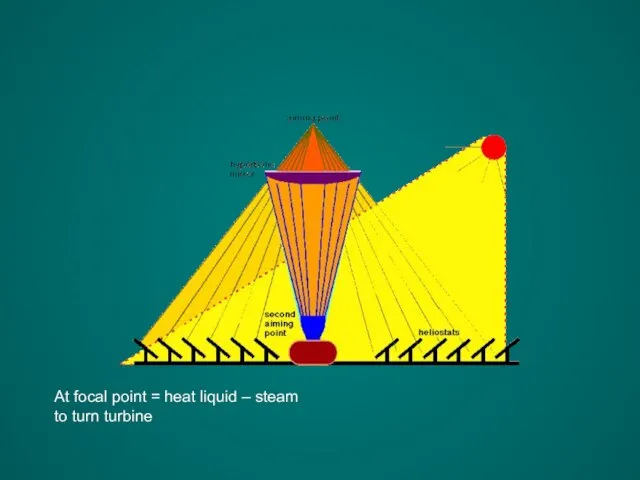
- 45. Solar Energy in More Details 1. Solar Thermal
- 46. At focal point = heat liquid – steam to turn turbine
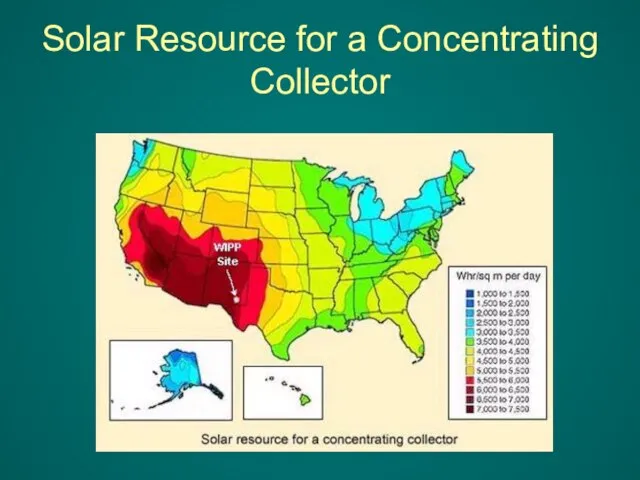
- 48. Solar Resource for a Concentrating Collector
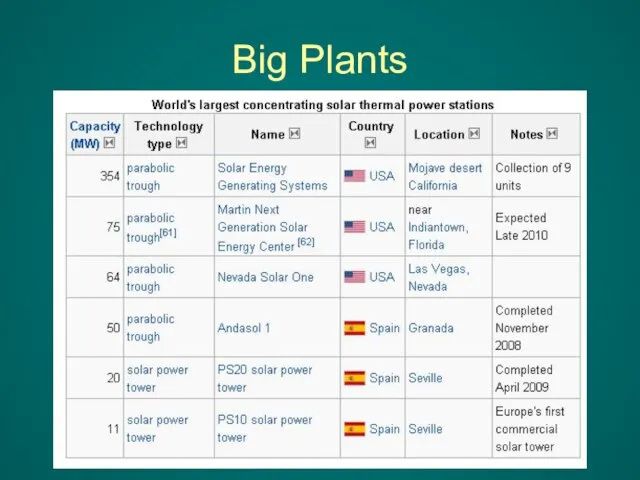
- 49. Big Plants
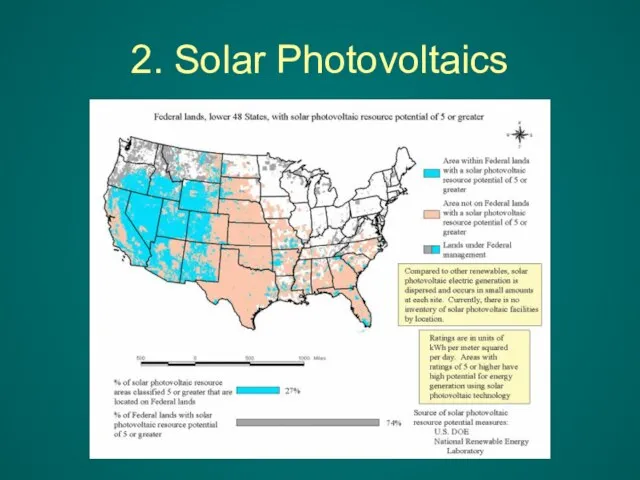
- 50. 2. Solar Photovoltaics
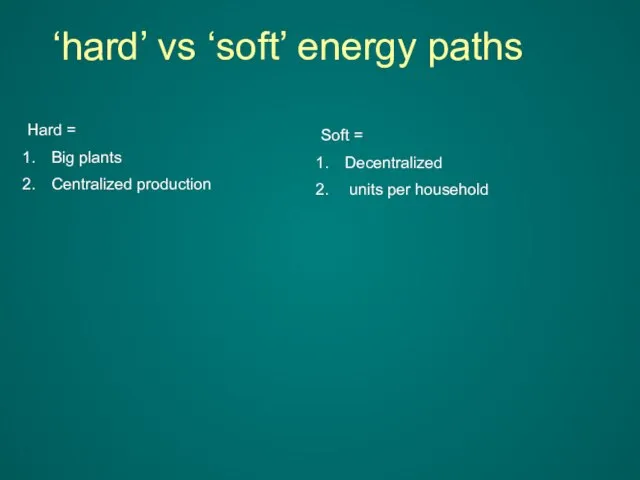
- 51. ‘hard’ vs ‘soft’ energy paths Hard = Big plants Centralized production Soft = Decentralized units per
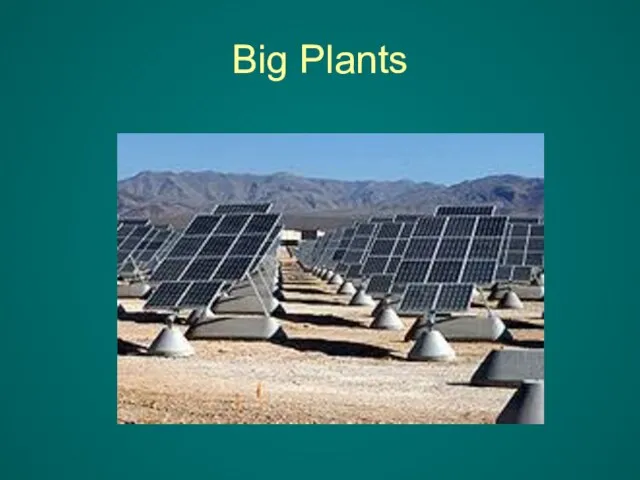
- 52. Big Plants
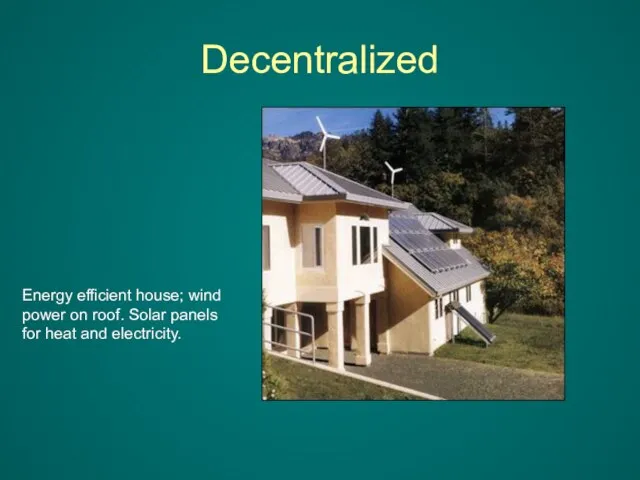
- 53. Energy efficient house; wind power on roof. Solar panels for heat and electricity. Decentralized
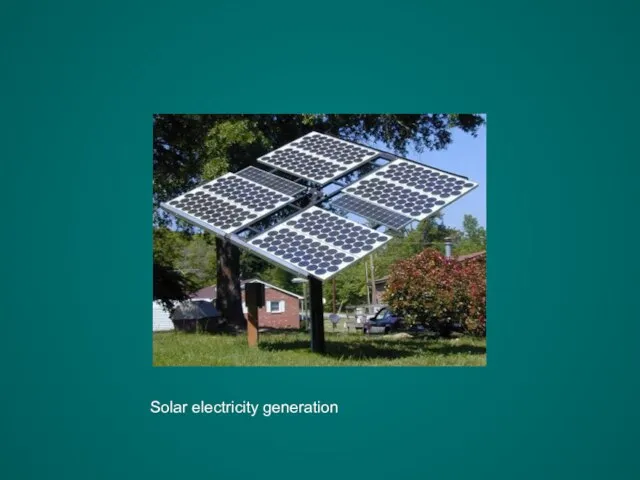
- 54. Solar electricity generation
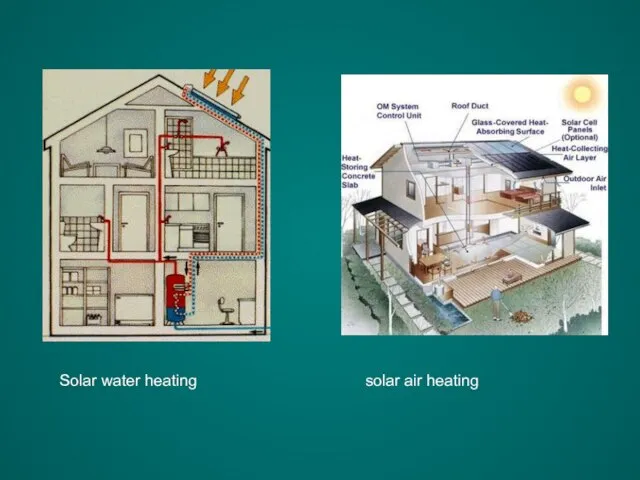
- 55. Solar water heating solar air heating
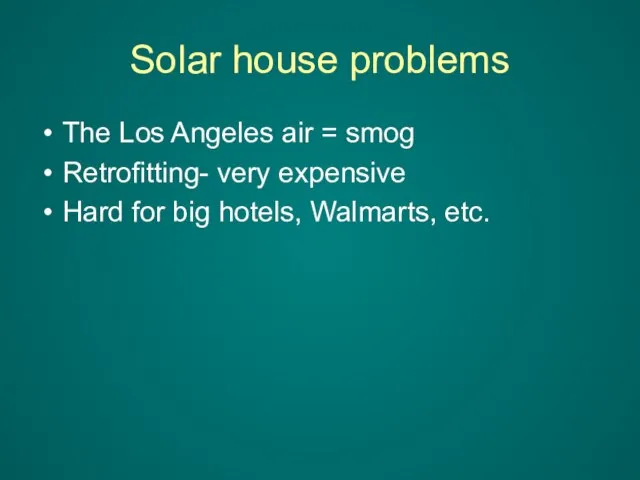
- 56. Solar house problems The Los Angeles air = smog Retrofitting- very expensive Hard for big hotels,
- 58. Скачать презентацию
Слайд 3Climate change due to natural causes (solar variations, volcanoes, etc.)
Can we predict
Climate change due to natural causes (solar variations, volcanoes, etc.)
Can we predict
Слайд 4CO2 Concentration, Temperature, and Sea Level
Continue to Rise Long after Emissions are
CO2 Concentration, Temperature, and Sea Level
Continue to Rise Long after Emissions are
Слайд 5The possibility / likelihood of global warming is disturbing …
… but there
The possibility / likelihood of global warming is disturbing …
… but there
Слайд 6Consumption of Energy Increased by 85%
Between 1970 and 1999
By 2020, Consumption
Consumption of Energy Increased by 85%
Between 1970 and 1999
By 2020, Consumption
Слайд 7World production of oil and gas is predicted to peak within 10
World production of oil and gas is predicted to peak within 10
Слайд 8Energy conservation and
efficiency can buy time
(a factor of ~2)
but the
Energy conservation and efficiency can buy time (a factor of ~2) but the
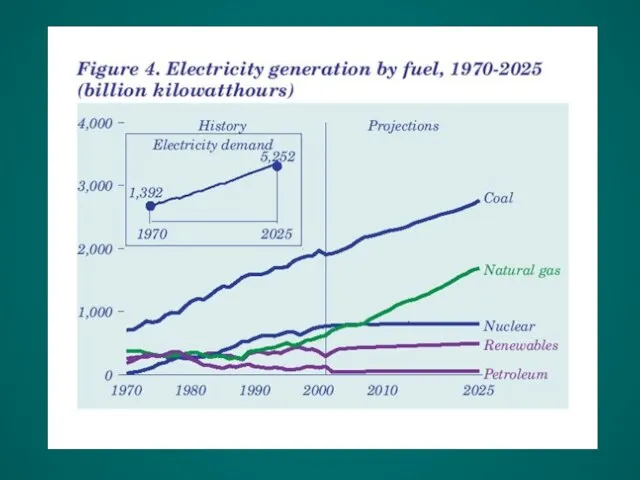
Слайд 10Electrical generation
Switch from petroleum to coal and natural gas
Why has hydroelectric declined?
When
Electrical generation
Switch from petroleum to coal and natural gas
Why has hydroelectric declined?
When
Слайд 11Numbers = how long it would last if all energy came from
Numbers = how long it would last if all energy came from
Слайд 12Numbers = proportion of current U.S. energy needs that could be supplied
Numbers = proportion of current U.S. energy needs that could be supplied
Слайд 13(in the U.S. in 2002)
1-4 ¢
2.3-5.0 ¢
6-8 ¢
5-7 ¢
Today: Production Cost of
(in the U.S. in 2002)
1-4 ¢
2.3-5.0 ¢
6-8 ¢
5-7 ¢
Today: Production Cost of
Слайд 14Energy Costs
Brazil
Europe
$0.05/kW-hr
www.undp.org/seed/eap/activities/wea
Courtesy Nate Lewis
Energy Costs
Brazil
Europe
$0.05/kW-hr
www.undp.org/seed/eap/activities/wea
Courtesy Nate Lewis
Слайд 15Potential Sources of Energy when
Fossil Fuels Run Out
Nuclear Fission
Magnetic Plasma Confinement,
Inertial
Potential Sources of Energy when
Fossil Fuels Run Out
Nuclear Fission
Magnetic Plasma Confinement,
Inertial
Слайд 16Solar, Wind and Water
We do not know how to store electrical energy
Solar, Wind and Water
We do not know how to store electrical energy
Слайд 17 Geothermal
Heat near surface of the earth = geysers, volcanoes, hot springs
Geothermal
Heat near surface of the earth = geysers, volcanoes, hot springs
Слайд 18Photosynthesis
Photovoltaic and
electricity to chemical
H O
O
H
2
2
2
sc
M
e
sc
e
M
CO
Sugar
H O
O
2
2
2
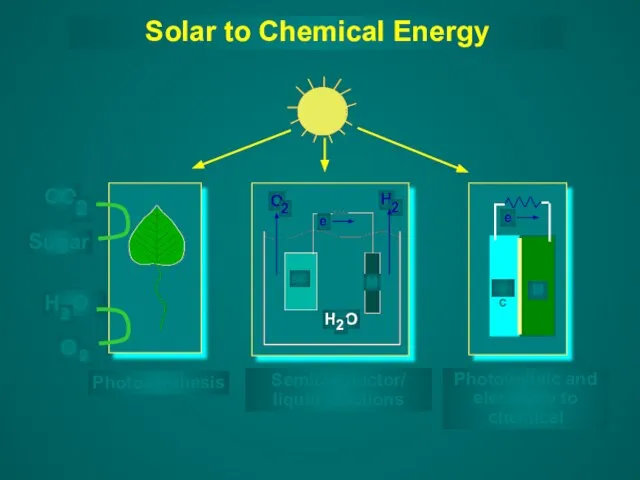
Solar to Chemical Energy
Semiconductor/
liquid junctions
Photosynthesis
Photovoltaic and
electricity to chemical
H O
O
H
2
2
2
sc
M
e
sc
e
M
CO
Sugar
H O
O
2
2
2
Solar to Chemical Energy
Semiconductor/
liquid junctions
Слайд 19Energy gained in corn ethanol production
Energy gained in corn ethanol production
Слайд 20Total CO2 emissions
Total CO2 emissions
Слайд 21From Summary of Renewable Fuel Options (NCEP)
“Unlike corn ethanol, cellulosic ethanol has
From Summary of Renewable Fuel Options (NCEP)
“Unlike corn ethanol, cellulosic ethanol has
Слайд 22Use heat to make steam to turn turbine for electrical generation
Note: deep
Use heat to make steam to turn turbine for electrical generation
Note: deep
Слайд 23In U.S., much done on public land = cheap
Very little potential in
In U.S., much done on public land = cheap
Very little potential in
Слайд 24World wide distribution of volcanos, hot springs, etc.
Japan, Iceland,New Zealand big users
World wide distribution of volcanos, hot springs, etc.
Japan, Iceland,New Zealand big users
Слайд 26Although hot areas near surface are limited, the earth is hot everywhere
Although hot areas near surface are limited, the earth is hot everywhere
Слайд 27Bright idea!? – drill deep enough to find heat. Since rock is
Bright idea!? – drill deep enough to find heat. Since rock is
Слайд 28Hydropower in More Details
Hydropower in More Details
Слайд 29Hydropower = dams
Not much used in world, why??
Hydropower = dams
Not much used in world, why??
Слайд 30Norway, Zambia, Ghana big users
Norway, Zambia, Ghana big users
Слайд 32Most unused hydropower in U.S. = Alaska,
In World = Canada, Russia
Most unused hydropower in U.S. = Alaska,
In World = Canada, Russia
Слайд 33Problems with hydroelectric
Location = unused rivers are in extreme north or low
Problems with hydroelectric
Location = unused rivers are in extreme north or low
Слайд 34Tidal Power
In areas of large tides
Anywhere – build offshore dam
Tidal Power
In areas of large tides
Anywhere – build offshore dam
Слайд 35Highest tides in the world = Bay of Fundy 16 meters =
Highest tides in the world = Bay of Fundy 16 meters =
Слайд 36Tidal power anywhere
No dam – but a turbine.
Problems:
Corrosion
Navigation
Appearance
Amount of energy available is
Tidal power anywhere
No dam – but a turbine.
Problems:
Corrosion
Navigation
Appearance
Amount of energy available is
Слайд 37
Banning Pass
Wind Power in More Details
Banning Pass
Wind Power in More Details
Слайд 38Wind Power Generation
Wind Power Generation
Слайд 39Best wind location = Aleutian Islands, why no wind development there?
Best wind location = Aleutian Islands, why no wind development there?
Слайд 40Best U.S. localities
Midwest, mountains
And coastal areas.
Best U.S. localities
Midwest, mountains
And coastal areas.
Слайд 42Netherlands = coastal development
Netherlands = coastal development
Слайд 43England = off shore
England = off shore
Слайд 44Wind energy problems
Location – near population center
Bird migration –
Visual
Must be coupled
Wind energy problems
Location – near population center
Bird migration –
Visual
Must be coupled
Слайд 45Solar Energy in More Details
1. Solar Thermal
Solar Energy in More Details
1. Solar Thermal
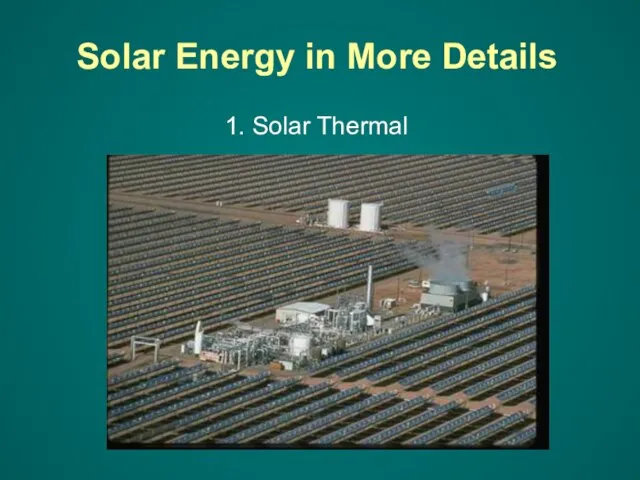
Слайд 46At focal point = heat liquid – steam to turn turbine
At focal point = heat liquid – steam to turn turbine
Слайд 48Solar Resource for a Concentrating Collector
Solar Resource for a Concentrating Collector
Слайд 49Big Plants
Big Plants
Слайд 502. Solar Photovoltaics
2. Solar Photovoltaics
Слайд 51‘hard’ vs ‘soft’ energy paths
Hard =
Big plants
Centralized production
Soft =
Decentralized
units per
‘hard’ vs ‘soft’ energy paths
Hard =
Big plants
Centralized production
Soft =
Decentralized
units per
Слайд 52Big Plants
Big Plants
Слайд 53Energy efficient house; wind power on roof. Solar panels for heat and
Energy efficient house; wind power on roof. Solar panels for heat and
Слайд 54Solar electricity generation
Solar electricity generation
Слайд 55Solar water heating solar air heating
Solar water heating solar air heating
Слайд 56Solar house problems
The Los Angeles air = smog
Retrofitting- very expensive
Hard for big
Solar house problems
The Los Angeles air = smog
Retrofitting- very expensive
Hard for big
 Социальная защита населения
 Жизнь и творчество Данте Алигьери
 Решение теоретических и экспериментальных задач по теме «Линзы»
 DIRECT INGECTION - идеальное решение для Вашей MAZDA CX7
 Инвентаризация ресурсов системы образования Нижегородской области
 Презентация на тему Математический язык
  Притяжательный падеж
 Презентация по экологии на тему:Экология в жизни человека Выполнила: ученица 11-б класса МОУ СОШ 31 г. Новочеркасска Богатова Алена.
 Художественные промыслы России 19 века
 My friends
 9b5a2c6b23cf59c545171c1ee0786151
 Татар теле һәм әдәбияты укытучысы
 Профессиональное становление специалиста как процесс личностного развития
 Музыка и литература
 Сила трения. Трение в природе и технике
 Презентация на тему Традиционный японский дом
 Михаил Врубель Ведь женщины
 Презентация на тему: Сюжетно-композиционные особенности повести А.С.Пушкина «Станционный смотритель»
 Видеокарты и как их выбрать
 Сопротивление изменениям. Часть 4
 Классификация счетов бухгалтерского учета
 Indian Legal System
 Великие педагоги
 Презентация на тему Ортология
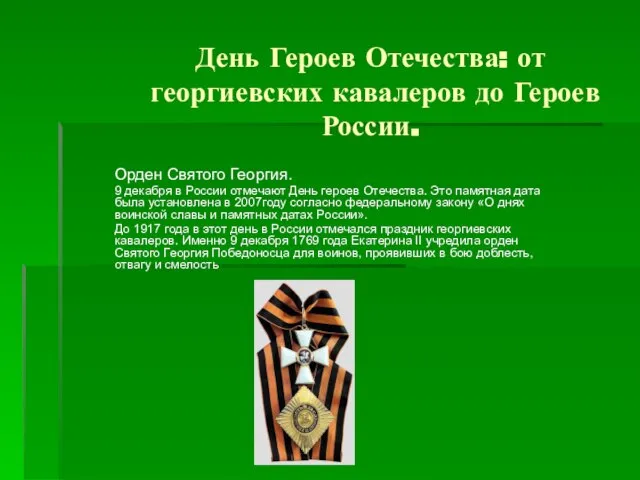 День Героев Отечества: от георгиевских кавалеров до Героев России.
 ОСІНЬ 2011ОСІНЬ 2011Ласкаво просимо на презентацію AIESEC ЧОМУ ІСНУЄ AIESEC? ЩО РОБИТЬ AIESEC? ЧОМУ САМЕ AIESEC? ПРИЄДНАТИСЯ ДО AIESEC ЯК AIESEC ЦЕ РОБИТЬ?
 Grandfos
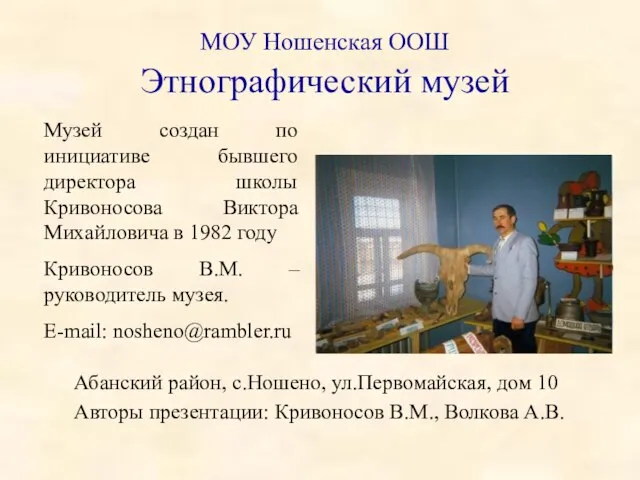 МОУ Ношенская ООШ Этнографический музей