- SHORT-RUN ECONOMIC FLUCTUATIONS

Содержание
- 2. 33 Aggregate Demand and Aggregate Supply
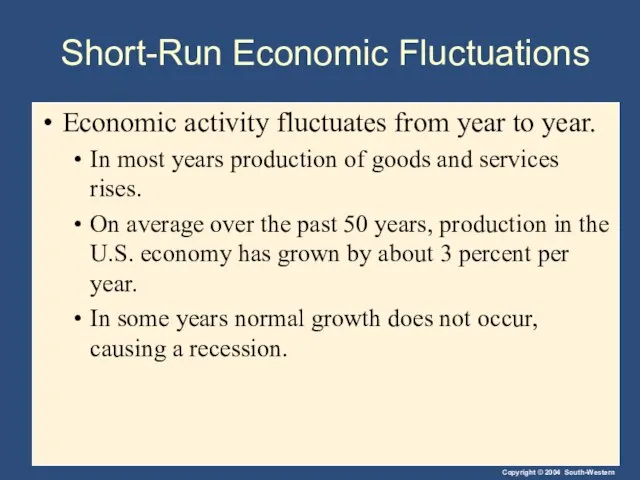
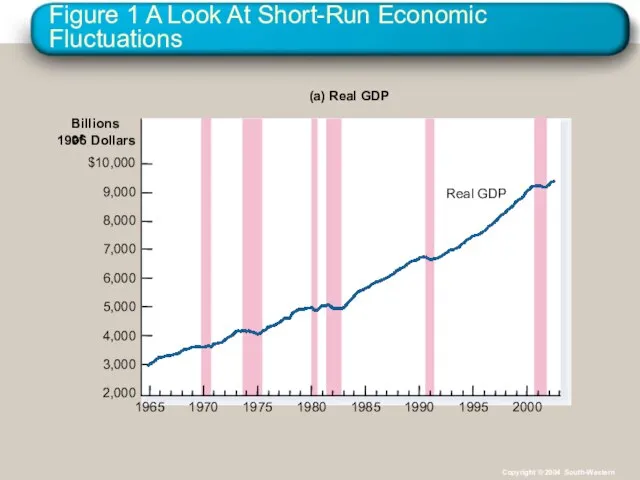
- 3. Short-Run Economic Fluctuations Economic activity fluctuates from year to year. In most years production of goods
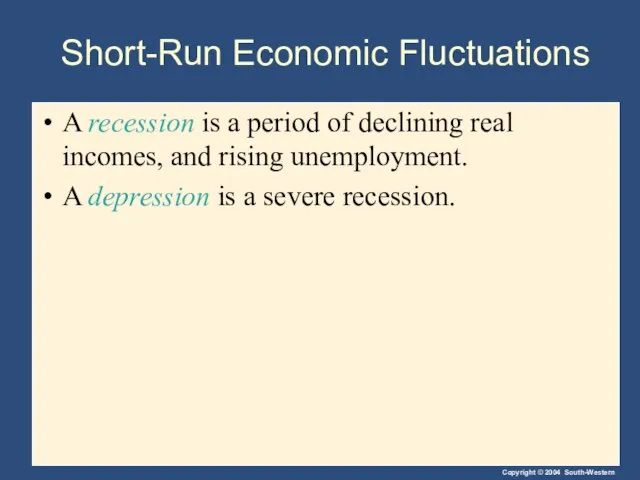
- 4. Short-Run Economic Fluctuations A recession is a period of declining real incomes, and rising unemployment. A
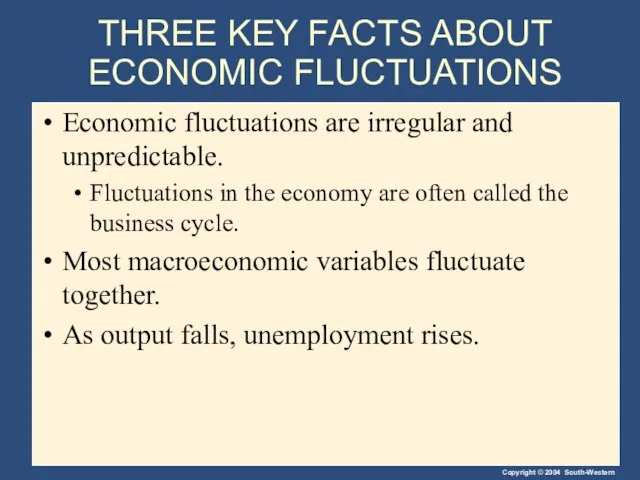
- 5. THREE KEY FACTS ABOUT ECONOMIC FLUCTUATIONS Economic fluctuations are irregular and unpredictable. Fluctuations in the economy
- 6. Figure 1 A Look At Short-Run Economic Fluctuations Billions of 1996 Dollars Real GDP (a) Real
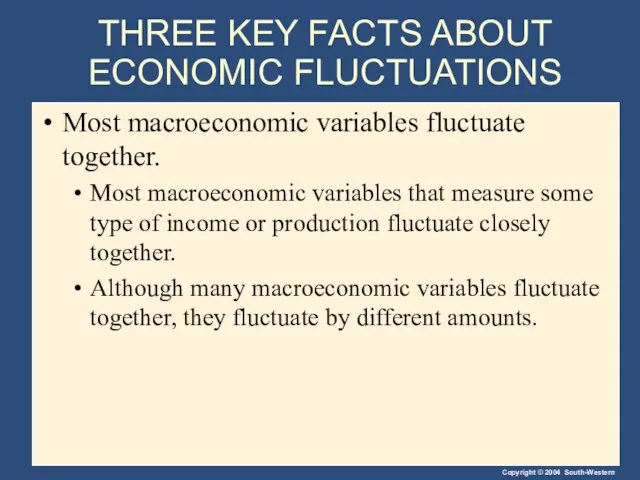
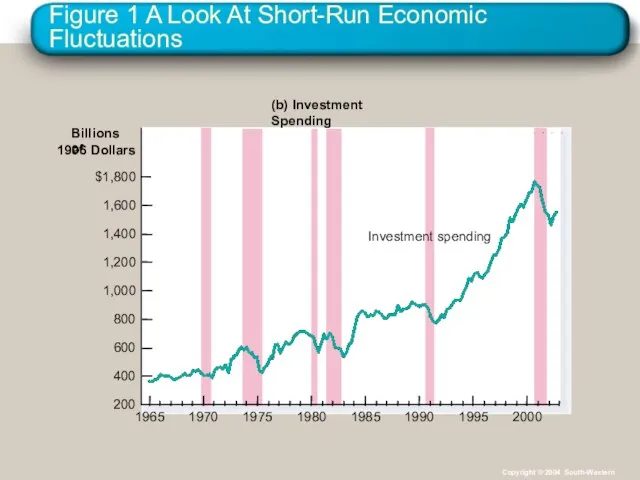
- 7. THREE KEY FACTS ABOUT ECONOMIC FLUCTUATIONS Most macroeconomic variables fluctuate together. Most macroeconomic variables that measure
- 8. Figure 1 A Look At Short-Run Economic Fluctuations Billions of 1996 Dollars (b) Investment Spending $1,800
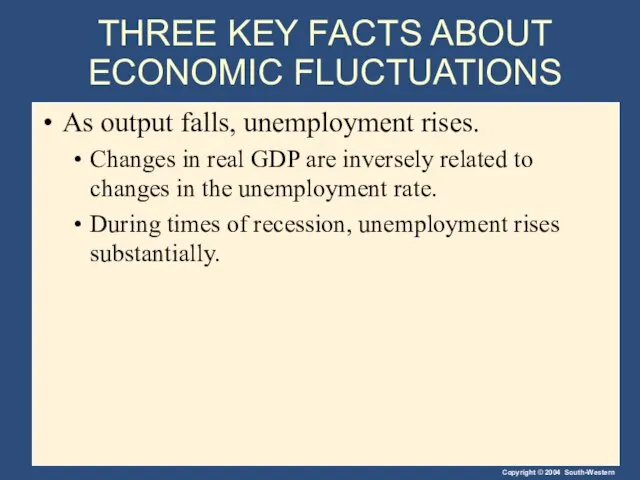
- 9. THREE KEY FACTS ABOUT ECONOMIC FLUCTUATIONS As output falls, unemployment rises. Changes in real GDP are
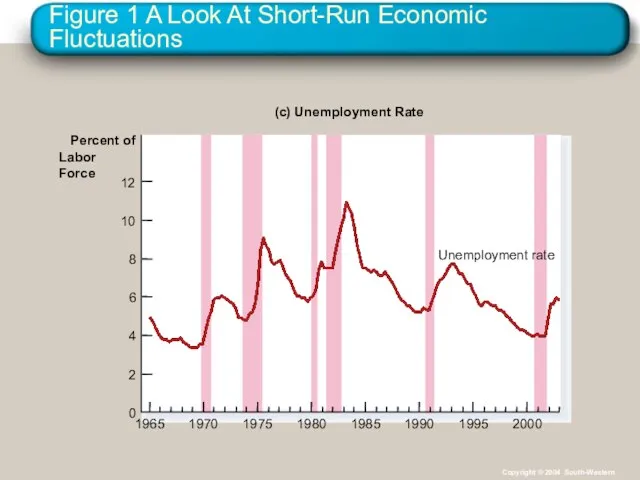
- 10. Figure 1 A Look At Short-Run Economic Fluctuations Percent of Labor Force (c) Unemployment Rate 0
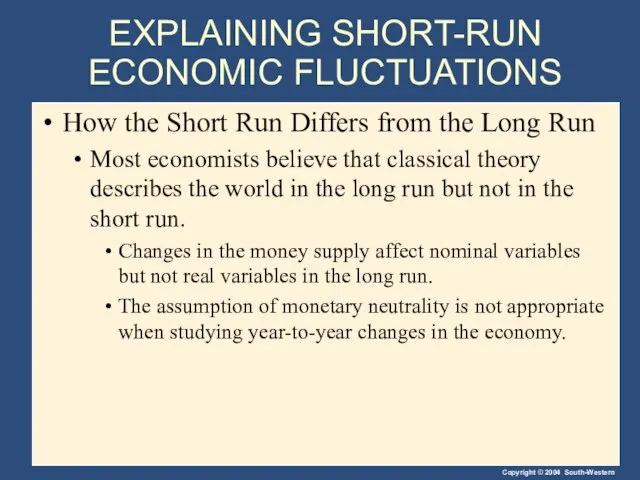
- 11. EXPLAINING SHORT-RUN ECONOMIC FLUCTUATIONS How the Short Run Differs from the Long Run Most economists believe
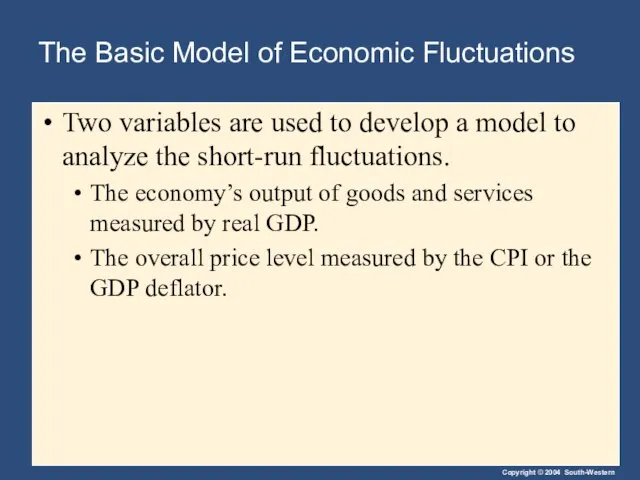
- 12. The Basic Model of Economic Fluctuations Two variables are used to develop a model to analyze
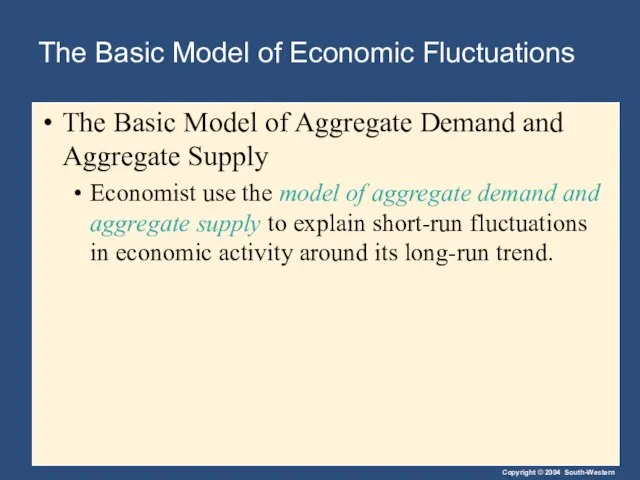
- 13. The Basic Model of Economic Fluctuations The Basic Model of Aggregate Demand and Aggregate Supply Economist
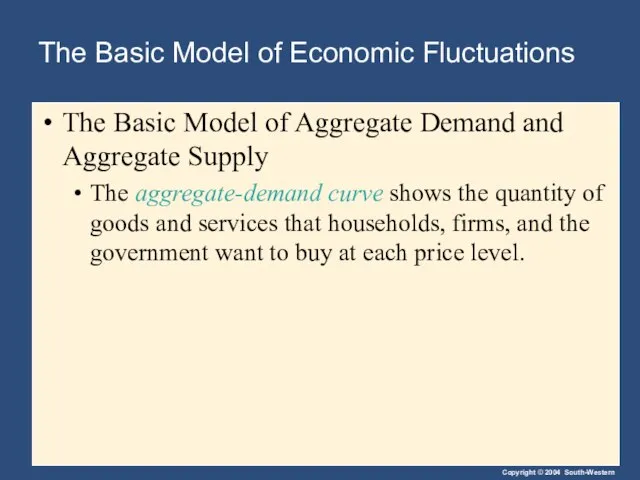
- 14. The Basic Model of Economic Fluctuations The Basic Model of Aggregate Demand and Aggregate Supply The
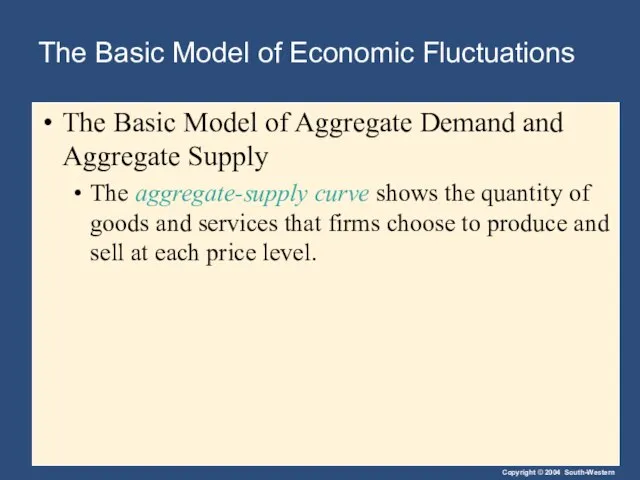
- 15. The Basic Model of Economic Fluctuations The Basic Model of Aggregate Demand and Aggregate Supply The
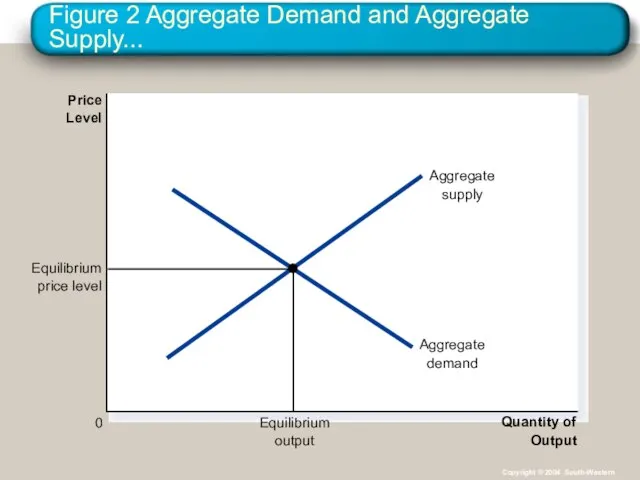
- 16. Figure 2 Aggregate Demand and Aggregate Supply... Quantity of Output Price Level 0 Copyright © 2004
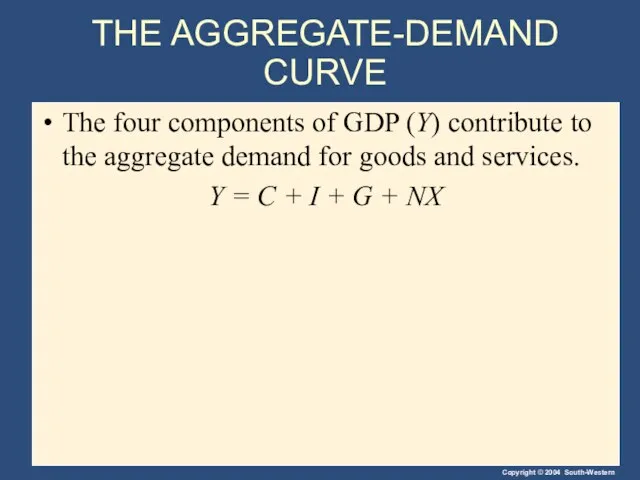
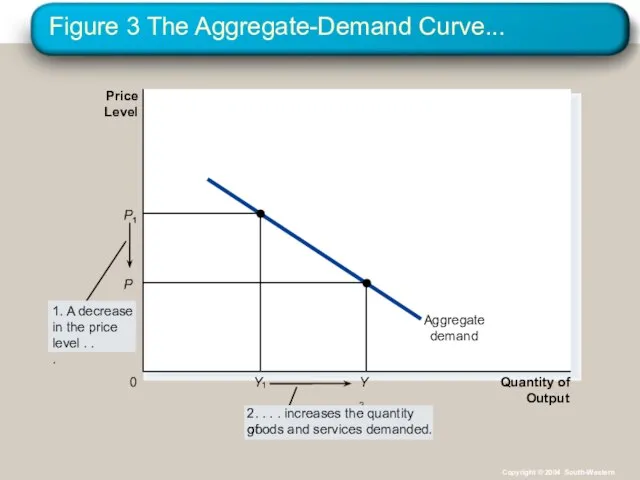
- 17. THE AGGREGATE-DEMAND CURVE The four components of GDP (Y) contribute to the aggregate demand for goods
- 18. Figure 3 The Aggregate-Demand Curve... Quantity of Output Price Level 0 Copyright © 2004 South-Western
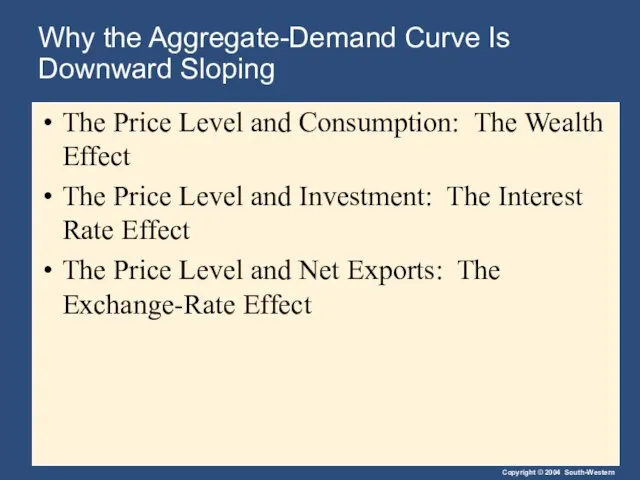
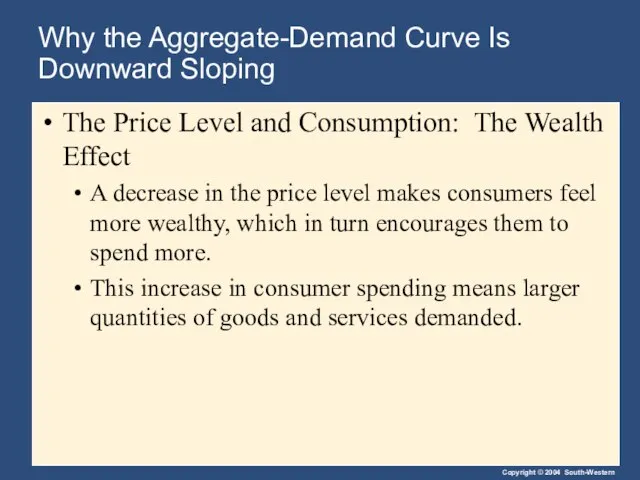
- 19. Why the Aggregate-Demand Curve Is Downward Sloping The Price Level and Consumption: The Wealth Effect The
- 20. Why the Aggregate-Demand Curve Is Downward Sloping The Price Level and Consumption: The Wealth Effect A
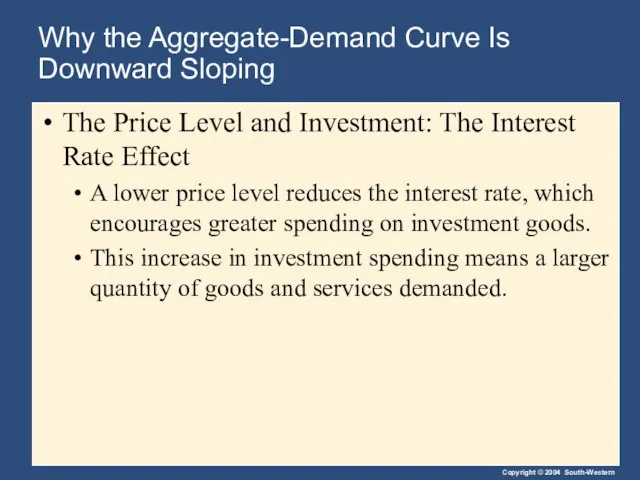
- 21. Why the Aggregate-Demand Curve Is Downward Sloping The Price Level and Investment: The Interest Rate Effect
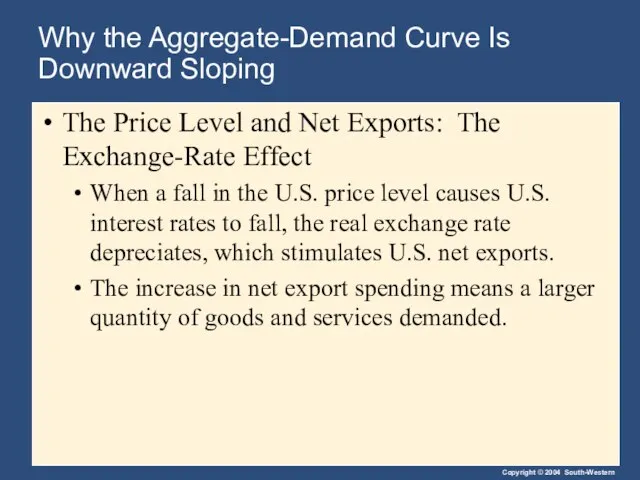
- 22. Why the Aggregate-Demand Curve Is Downward Sloping The Price Level and Net Exports: The Exchange-Rate Effect
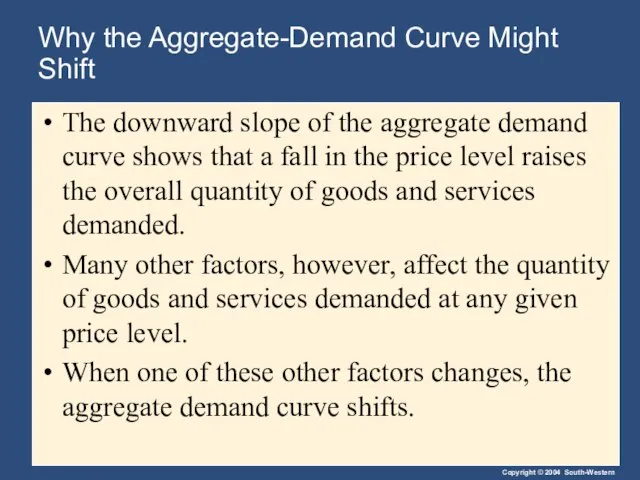
- 23. Why the Aggregate-Demand Curve Might Shift The downward slope of the aggregate demand curve shows that
- 24. Why the Aggregate-Demand Curve Might Shift Shifts arising from Consumption Investment Government Purchases Net Exports
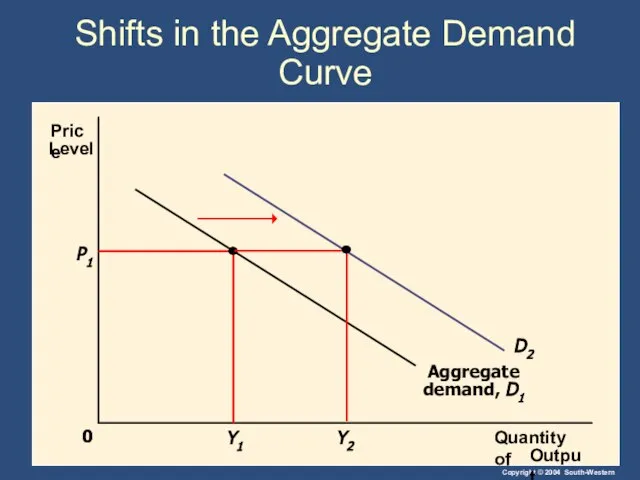
- 25. Shifts in the Aggregate Demand Curve 0 P1 Y1
- 26. THE AGGREGATE-SUPPLY CURVE In the long run, the aggregate-supply curve is vertical. In the short run,
- 27. THE AGGREGATE-SUPPLY CURVE The Long-Run Aggregate-Supply Curve In the long run, an economy’s production of goods
- 28. Figure 4 The Long-Run Aggregate-Supply Curve Quantity of Output Natural rate of output Price Level 0
- 29. THE AGGREGATE-SUPPLY CURVE The Long-Run Aggregate-Supply Curve The long-run aggregate-supply curve is vertical at the natural
- 30. Why the Long-Run Aggregate-Supply Curve Might Shift Any change in the economy that alters the natural
- 31. Why the Long-Run Aggregate-Supply Curve Might Shift Shifts arising Labor Capital Natural Resources Technological Knowledge
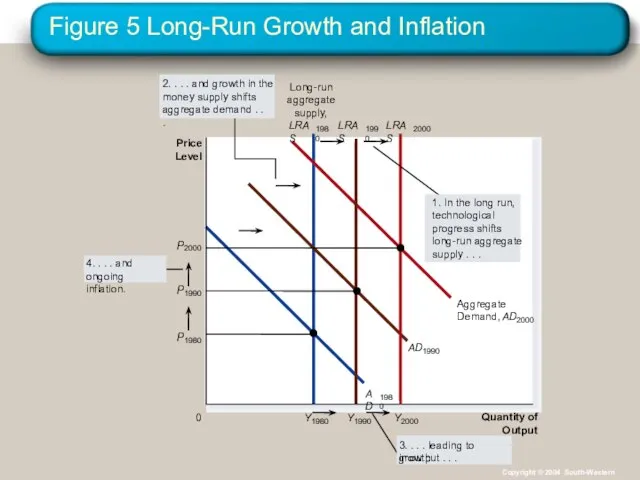
- 32. Figure 5 Long-Run Growth and Inflation Quantity of Output Price Level 0 Copyright © 2004 South-Western
- 33. A New Way to Depict Long-Run Growth and Inflation Short-run fluctuations in output and price level
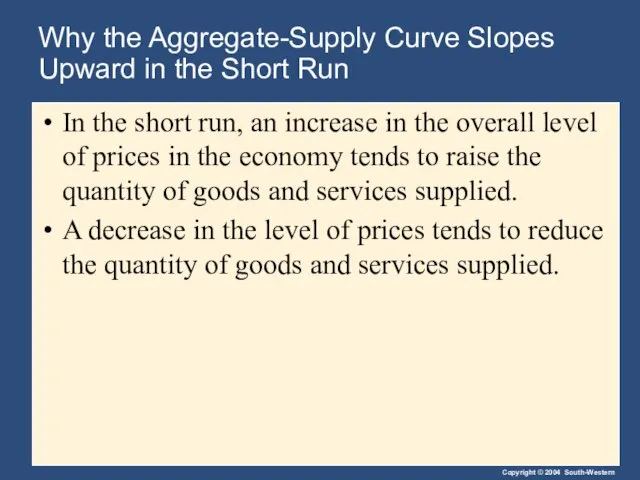
- 34. Why the Aggregate-Supply Curve Slopes Upward in the Short Run In the short run, an increase
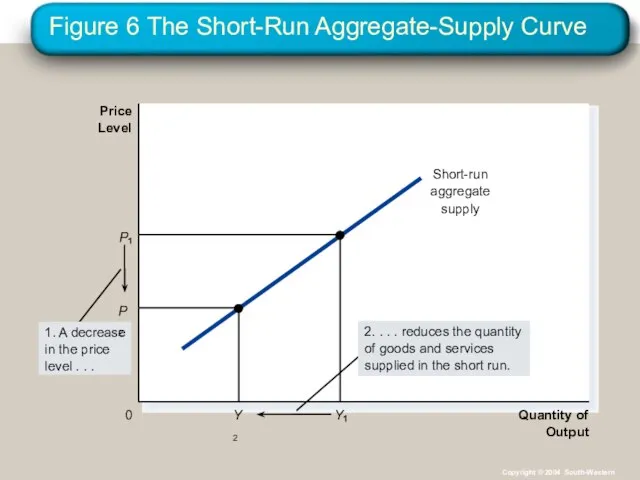
- 35. Figure 6 The Short-Run Aggregate-Supply Curve Quantity of Output Price Level 0 Copyright © 2004 South-Western
- 36. Why the Aggregate-Supply Curve Slopes Upward in the Short Run The Misperceptions Theory The Sticky-Wage Theory
- 37. Why the Aggregate-Supply Curve Slopes Upward in the Short Run The Misperceptions Theory Changes in the
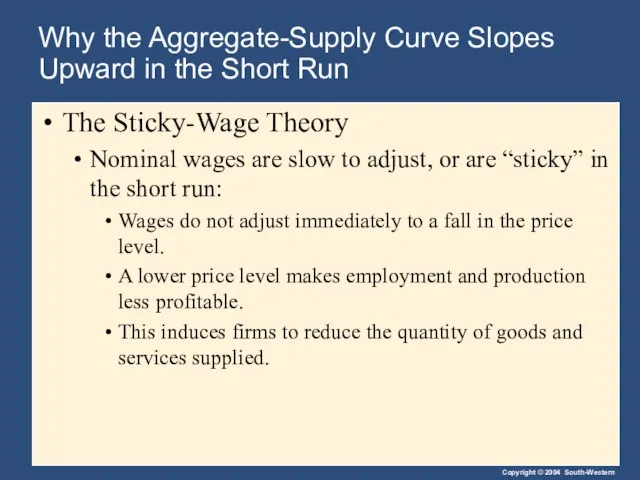
- 38. Why the Aggregate-Supply Curve Slopes Upward in the Short Run The Sticky-Wage Theory Nominal wages are
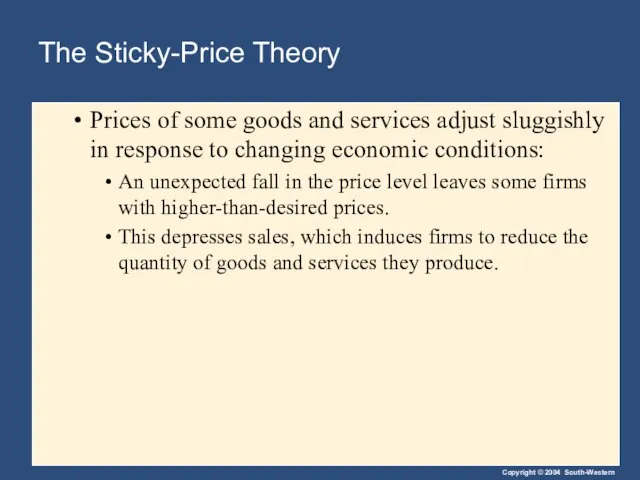
- 39. The Sticky-Price Theory Prices of some goods and services adjust sluggishly in response to changing economic
- 40. Why the Short-Run Aggregate-Supply Curve Might Shift Shifts arising Labor Capital Natural Resources. Technology. Expected Price
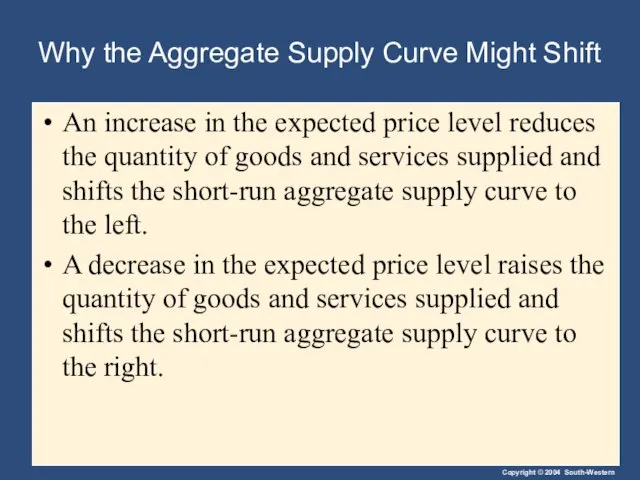
- 41. Why the Aggregate Supply Curve Might Shift An increase in the expected price level reduces the
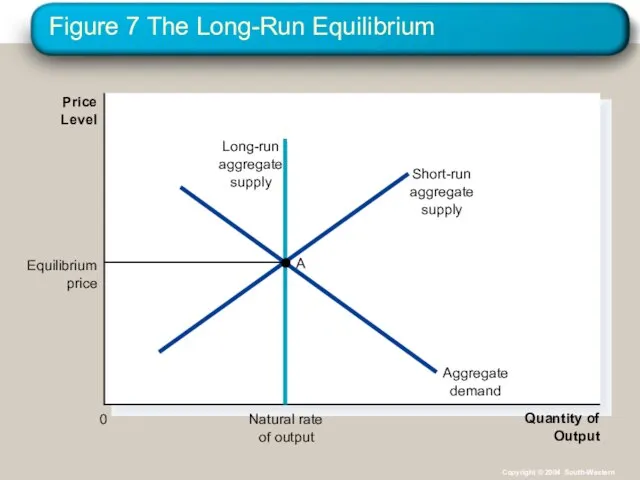
- 42. Figure 7 The Long-Run Equilibrium Quantity of Output Price Level 0 Copyright © 2004 South-Western
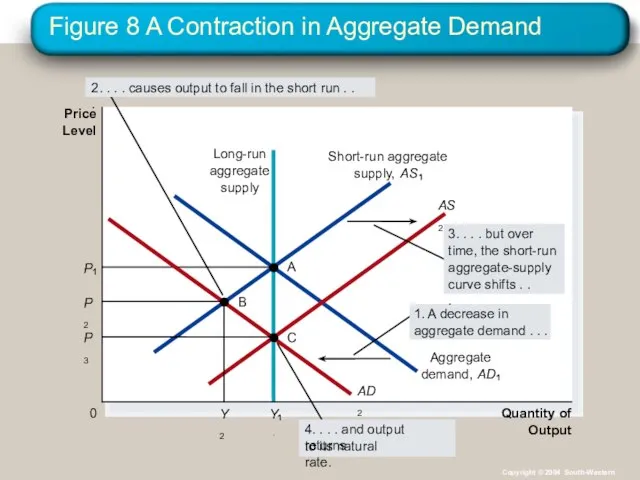
- 43. Figure 8 A Contraction in Aggregate Demand Quantity of Output Price Level 0 Long-run aggregate supply
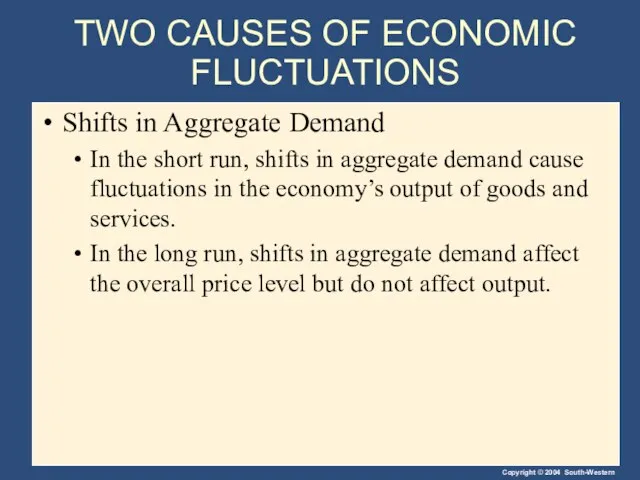
- 44. TWO CAUSES OF ECONOMIC FLUCTUATIONS Shifts in Aggregate Demand In the short run, shifts in aggregate
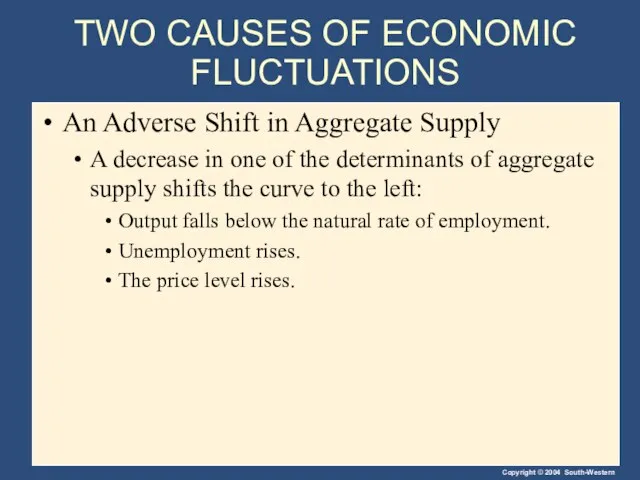
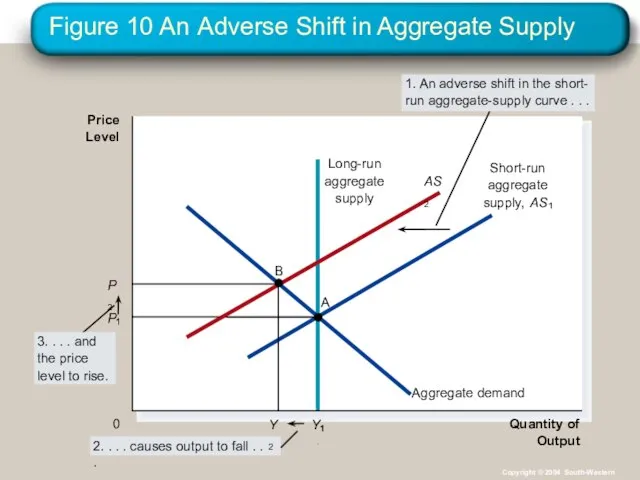
- 45. TWO CAUSES OF ECONOMIC FLUCTUATIONS An Adverse Shift in Aggregate Supply A decrease in one of
- 46. Figure 10 An Adverse Shift in Aggregate Supply Quantity of Output Price Level 0 Long-run aggregate
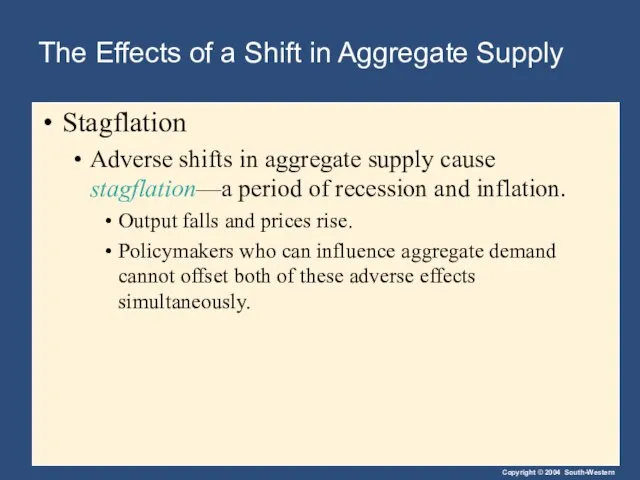
- 47. The Effects of a Shift in Aggregate Supply Stagflation Adverse shifts in aggregate supply cause stagflation—a
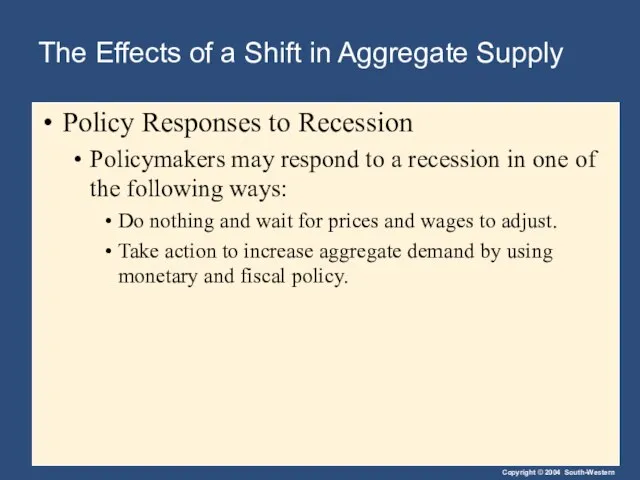
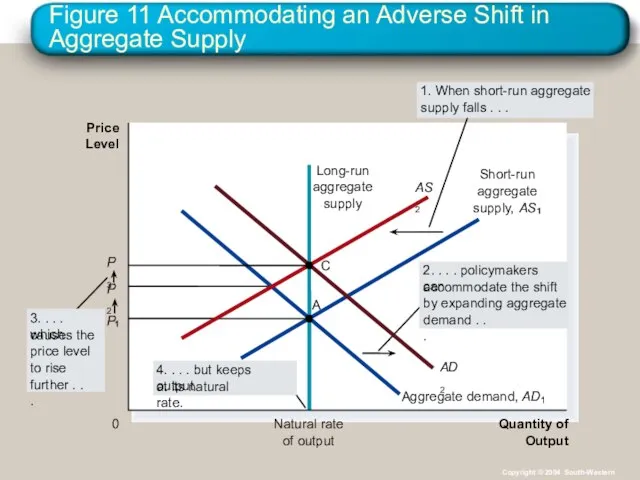
- 48. The Effects of a Shift in Aggregate Supply Policy Responses to Recession Policymakers may respond to
- 49. Figure 11 Accommodating an Adverse Shift in Aggregate Supply Quantity of Output Natural rate of output
- 50. Summary All societies experience short-run economic fluctuations around long-run trends. These fluctuations are irregular and largely
- 51. Summary Economists analyze short-run economic fluctuations using the aggregate demand and aggregate supply model. According to
- 52. Summary The aggregate-demand curve slopes downward for three reasons: a wealth effect, an interest rate effect,
- 53. Summary In the long run, the aggregate supply curve is vertical. The short-run, the aggregate supply
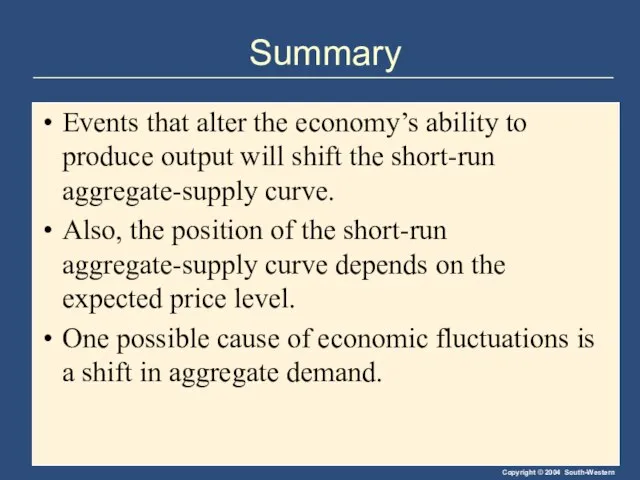
- 54. Summary Events that alter the economy’s ability to produce output will shift the short-run aggregate-supply curve.
- 56. Скачать презентацию
Слайд 3Short-Run Economic Fluctuations
Economic activity fluctuates from year to year.
In most years production
Short-Run Economic Fluctuations
Economic activity fluctuates from year to year.
In most years production
Слайд 4Short-Run Economic Fluctuations
A recession is a period of declining real incomes, and
Short-Run Economic Fluctuations
A recession is a period of declining real incomes, and
Слайд 5THREE KEY FACTS ABOUT ECONOMIC FLUCTUATIONS
Economic fluctuations are irregular and unpredictable.
Fluctuations in
THREE KEY FACTS ABOUT ECONOMIC FLUCTUATIONS
Economic fluctuations are irregular and unpredictable.
Fluctuations in
Слайд 6Figure 1 A Look At Short-Run Economic Fluctuations
Billions of
1996 Dollars
Real GDP
(a) Real
Figure 1 A Look At Short-Run Economic Fluctuations
Billions of
1996 Dollars
Real GDP
(a) Real
Слайд 7THREE KEY FACTS ABOUT ECONOMIC FLUCTUATIONS
Most macroeconomic variables fluctuate together.
Most macroeconomic variables
THREE KEY FACTS ABOUT ECONOMIC FLUCTUATIONS
Most macroeconomic variables fluctuate together.
Most macroeconomic variables
Слайд 8Figure 1 A Look At Short-Run Economic Fluctuations
Billions of
1996 Dollars
(b) Investment Spending
$1,800
1,600
1,400
1,200
1,000
800
600
400
200
1965
1970
1975
1980
1985
1990
1995
2000
Investment
Figure 1 A Look At Short-Run Economic Fluctuations
Billions of
1996 Dollars
(b) Investment Spending
$1,800
1,600
1,400
1,200
1,000
800
600
400
200
1965
1970
1975
1980
1985
1990
1995
2000
Investment
Слайд 9THREE KEY FACTS ABOUT ECONOMIC FLUCTUATIONS
As output falls, unemployment rises.
Changes in real
THREE KEY FACTS ABOUT ECONOMIC FLUCTUATIONS
As output falls, unemployment rises.
Changes in real
Слайд 10Figure 1 A Look At Short-Run Economic Fluctuations
Percent of
Labor Force
(c) Unemployment Rate
0
2
4
6
8
10
12
1965
1970
1975
1980
1985
1990
1995
2000
Unemployment
Figure 1 A Look At Short-Run Economic Fluctuations
Percent of
Labor Force
(c) Unemployment Rate
0
2
4
6
8
10
12
1965
1970
1975
1980
1985
1990
1995
2000
Unemployment
Слайд 11EXPLAINING SHORT-RUN ECONOMIC FLUCTUATIONS
How the Short Run Differs from the Long Run
Most
EXPLAINING SHORT-RUN ECONOMIC FLUCTUATIONS
How the Short Run Differs from the Long Run
Most
Слайд 12The Basic Model of Economic Fluctuations
Two variables are used to develop a
The Basic Model of Economic Fluctuations
Two variables are used to develop a
Слайд 13The Basic Model of Economic Fluctuations
The Basic Model of Aggregate Demand
The Basic Model of Economic Fluctuations
The Basic Model of Aggregate Demand
Слайд 14The Basic Model of Economic Fluctuations
The Basic Model of Aggregate Demand
The Basic Model of Economic Fluctuations
The Basic Model of Aggregate Demand
Слайд 15The Basic Model of Economic Fluctuations
The Basic Model of Aggregate Demand
The Basic Model of Economic Fluctuations
The Basic Model of Aggregate Demand
Слайд 16Figure 2 Aggregate Demand and Aggregate Supply...
Quantity of
Output
Price
Level
0
Copyright © 2004 South-Western
Figure 2 Aggregate Demand and Aggregate Supply...
Quantity of
Output
Price
Level
0
Copyright © 2004 South-Western
Слайд 17THE AGGREGATE-DEMAND CURVE
The four components of GDP (Y) contribute to the aggregate
THE AGGREGATE-DEMAND CURVE
The four components of GDP (Y) contribute to the aggregate
Слайд 18Figure 3 The Aggregate-Demand Curve...
Quantity of
Output
Price
Level
0
Copyright © 2004 South-Western
Figure 3 The Aggregate-Demand Curve...
Quantity of
Output
Price
Level
0
Copyright © 2004 South-Western
Слайд 19Why the Aggregate-Demand Curve Is Downward Sloping
The Price Level and Consumption: The
Why the Aggregate-Demand Curve Is Downward Sloping
The Price Level and Consumption: The
Слайд 20Why the Aggregate-Demand Curve Is Downward Sloping
The Price Level and Consumption: The
Why the Aggregate-Demand Curve Is Downward Sloping
The Price Level and Consumption: The
Слайд 21Why the Aggregate-Demand Curve Is Downward Sloping
The Price Level and Investment: The
Why the Aggregate-Demand Curve Is Downward Sloping
The Price Level and Investment: The
Слайд 22Why the Aggregate-Demand Curve Is Downward Sloping
The Price Level and Net Exports:
Why the Aggregate-Demand Curve Is Downward Sloping
The Price Level and Net Exports:
Слайд 23Why the Aggregate-Demand Curve Might Shift
The downward slope of the aggregate demand
Why the Aggregate-Demand Curve Might Shift
The downward slope of the aggregate demand
Слайд 24Why the Aggregate-Demand Curve Might Shift
Shifts arising from
Consumption
Investment
Government Purchases
Net Exports
Why the Aggregate-Demand Curve Might Shift
Shifts arising from
Consumption
Investment
Government Purchases
Net Exports
Слайд 25Shifts in the Aggregate Demand Curve
0
P1
Y1
Shifts in the Aggregate Demand Curve
0
P1
Y1
Слайд 26THE AGGREGATE-SUPPLY CURVE
In the long run, the aggregate-supply curve is vertical.
In the
THE AGGREGATE-SUPPLY CURVE
In the long run, the aggregate-supply curve is vertical.
In the
Слайд 27THE AGGREGATE-SUPPLY CURVE
The Long-Run Aggregate-Supply Curve
In the long run, an economy’s production
THE AGGREGATE-SUPPLY CURVE
The Long-Run Aggregate-Supply Curve
In the long run, an economy’s production
Слайд 28Figure 4 The Long-Run Aggregate-Supply Curve
Quantity of
Output
Natural rate
of output
Price
Level
0
Copyright © 2004 South-Western
Figure 4 The Long-Run Aggregate-Supply Curve
Quantity of
Output
Natural rate
of output
Price
Level
0
Copyright © 2004 South-Western
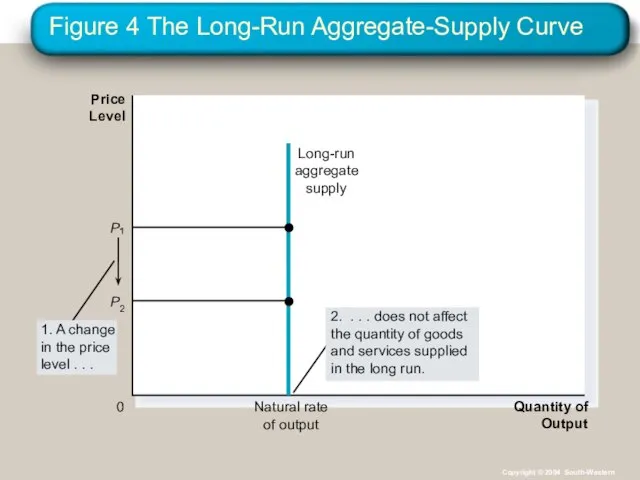
Слайд 29THE AGGREGATE-SUPPLY CURVE
The Long-Run Aggregate-Supply Curve
The long-run aggregate-supply curve is vertical at
THE AGGREGATE-SUPPLY CURVE
The Long-Run Aggregate-Supply Curve
The long-run aggregate-supply curve is vertical at
Слайд 30Why the Long-Run Aggregate-Supply Curve Might Shift
Any change in the economy that
Why the Long-Run Aggregate-Supply Curve Might Shift
Any change in the economy that
Слайд 31Why the Long-Run Aggregate-Supply Curve Might Shift
Shifts arising
Labor
Capital
Natural Resources
Technological Knowledge
Why the Long-Run Aggregate-Supply Curve Might Shift
Shifts arising
Labor
Capital
Natural Resources
Technological Knowledge
Слайд 32Figure 5 Long-Run Growth and Inflation
Quantity of
Output
Price
Level
0
Copyright © 2004 South-Western
Figure 5 Long-Run Growth and Inflation
Quantity of
Output
Price
Level
0
Copyright © 2004 South-Western
Слайд 33A New Way to Depict Long-Run Growth and Inflation
Short-run fluctuations in output
A New Way to Depict Long-Run Growth and Inflation
Short-run fluctuations in output
Слайд 34Why the Aggregate-Supply Curve Slopes Upward in the Short Run
In the short
Why the Aggregate-Supply Curve Slopes Upward in the Short Run
In the short
Слайд 35Figure 6 The Short-Run Aggregate-Supply Curve
Quantity of
Output
Price
Level
0
Copyright © 2004 South-Western
Figure 6 The Short-Run Aggregate-Supply Curve
Quantity of
Output
Price
Level
0
Copyright © 2004 South-Western
Слайд 36Why the Aggregate-Supply Curve Slopes Upward in the Short Run
The Misperceptions Theory
The
Why the Aggregate-Supply Curve Slopes Upward in the Short Run
The Misperceptions Theory
The
Слайд 37Why the Aggregate-Supply Curve Slopes Upward in the Short Run
The Misperceptions Theory
Changes
Why the Aggregate-Supply Curve Slopes Upward in the Short Run
The Misperceptions Theory
Changes
Слайд 38Why the Aggregate-Supply Curve Slopes Upward in the Short Run
The Sticky-Wage Theory
Nominal
Why the Aggregate-Supply Curve Slopes Upward in the Short Run
The Sticky-Wage Theory
Nominal
Слайд 39The Sticky-Price Theory
Prices of some goods and services adjust sluggishly in response
The Sticky-Price Theory
Prices of some goods and services adjust sluggishly in response
Слайд 40Why the Short-Run Aggregate-Supply Curve Might Shift
Shifts arising
Labor
Capital
Natural Resources.
Technology.
Expected Price Level.
Why the Short-Run Aggregate-Supply Curve Might Shift
Shifts arising
Labor
Capital
Natural Resources.
Technology.
Expected Price Level.
Слайд 41Why the Aggregate Supply Curve Might Shift
An increase in the expected price
Why the Aggregate Supply Curve Might Shift
An increase in the expected price
Слайд 42Figure 7 The Long-Run Equilibrium
Quantity of
Output
Price
Level
0
Copyright © 2004 South-Western
Figure 7 The Long-Run Equilibrium
Quantity of
Output
Price
Level
0
Copyright © 2004 South-Western
Слайд 43Figure 8 A Contraction in Aggregate Demand
Quantity of
Output
Price
Level
0
Long-run
aggregate
supply
Copyright © 2004 South-Western
Figure 8 A Contraction in Aggregate Demand
Quantity of
Output
Price
Level
0
Long-run
aggregate
supply
Copyright © 2004 South-Western
Слайд 44TWO CAUSES OF ECONOMIC FLUCTUATIONS
Shifts in Aggregate Demand
In the short run, shifts
TWO CAUSES OF ECONOMIC FLUCTUATIONS
Shifts in Aggregate Demand
In the short run, shifts
Слайд 45TWO CAUSES OF ECONOMIC FLUCTUATIONS
An Adverse Shift in Aggregate Supply
A decrease
TWO CAUSES OF ECONOMIC FLUCTUATIONS
An Adverse Shift in Aggregate Supply
A decrease
Слайд 46Figure 10 An Adverse Shift in Aggregate Supply
Quantity of
Output
Price
Level
0
Long-run
aggregate
supply
Copyright © 2004 South-Western
Figure 10 An Adverse Shift in Aggregate Supply
Quantity of
Output
Price
Level
0
Long-run
aggregate
supply
Copyright © 2004 South-Western
Слайд 47The Effects of a Shift in Aggregate Supply
Stagflation
Adverse shifts in aggregate supply
The Effects of a Shift in Aggregate Supply
Stagflation
Adverse shifts in aggregate supply
Слайд 48The Effects of a Shift in Aggregate Supply
Policy Responses to Recession
Policymakers may
The Effects of a Shift in Aggregate Supply
Policy Responses to Recession
Policymakers may
Слайд 49Figure 11 Accommodating an Adverse Shift in Aggregate Supply
Quantity of
Output
Natural rate
of output
Price
Level
0
Long-run
aggregate
supply
Aggregate
Figure 11 Accommodating an Adverse Shift in Aggregate Supply
Quantity of
Output
Natural rate
of output
Price
Level
0
Long-run
aggregate
supply
Aggregate
Слайд 50Summary
All societies experience short-run economic fluctuations around long-run trends.
These fluctuations are
Summary
All societies experience short-run economic fluctuations around long-run trends.
These fluctuations are
Слайд 51Summary
Economists analyze short-run economic fluctuations using the aggregate demand and aggregate supply
Summary
Economists analyze short-run economic fluctuations using the aggregate demand and aggregate supply
Слайд 52Summary
The aggregate-demand curve slopes downward for three reasons: a wealth effect, an
Summary
The aggregate-demand curve slopes downward for three reasons: a wealth effect, an
Слайд 53Summary
In the long run, the aggregate supply curve is vertical.
The short-run, the
Summary
In the long run, the aggregate supply curve is vertical.
The short-run, the
Слайд 54Summary
Events that alter the economy’s ability to produce output will shift the
Summary
Events that alter the economy’s ability to produce output will shift the
 Трудовое право
 Harry Potter
 Проповедник из Галилеи
 Презентация на тему Шоколад вред или польза
  Высокое Возрождение в Риме и Флоренции 16 в
 Укрепление системы органов внутренних дел во второй половине 1960-х - 1980-е гг
 Медиастудия Фристайл МБУДО ДШИ №2
 Преодоление страхов и психолого-эмоционального напряжения средствами данстерапии
 Символика Российской Федерации
 Муниципальное образовательное учреждение для детей-сирот и детей, оставшихся без попечения родителей, школа-интернат №96
 Масиви Object Delphi
 Алгоритм и методика диагностики преобразователя частоты
 Санкт-Петербургская торгово-промышленная палата
 Деловая игра «ОАО»
 Презентация на тему Алжир
 «Страхование и социальный пакет в условиях кризиса»
 П.И.Чайковский «Письмо миру»
 Презентация о интересной, талантливой, творческой личности. Автор: Русинова Снежанна Ученица 11 класса
 Ана тілі
 Мы вместа
 Показатели инновационной деятельности
 Психологическое воздействие рекламы на потребителя. Уткина Анастасия 2 курс. Практическая работа №3
 Коневодство. За чем нужно коневодство?
 Полевая лингвистика
 Рынок труда: Политика занятости и тенденции развития
 Русская пейзажная живопись второй половины 18 века
 Виды и формы исследовательской деятельности
  О чём говорят украшения