- The Costs of Production

Содержание
- 2. What are Costs? Total revenue Amount a firm receives for the sale of its output Total
- 3. What are Costs? Costs as opportunity costs The cost of something is what you give up
- 4. What are Costs? Costs as opportunity costs Explicit costs Input costs that require an outlay of
- 5. What are Costs? The cost of capital as an opportunity cost Implicit cost Interest income not
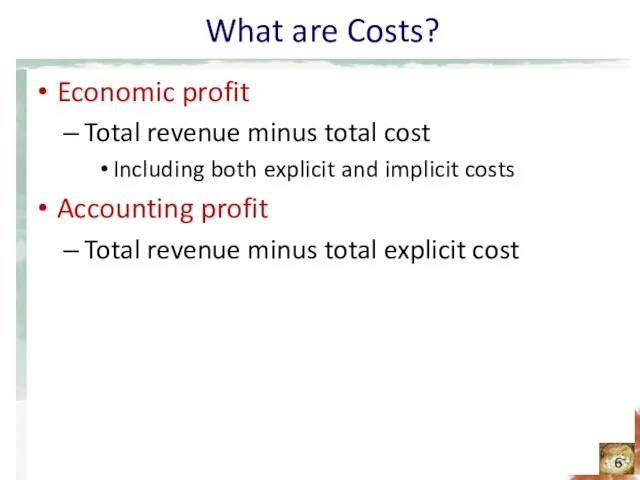
- 6. What are Costs? Economic profit Total revenue minus total cost Including both explicit and implicit costs
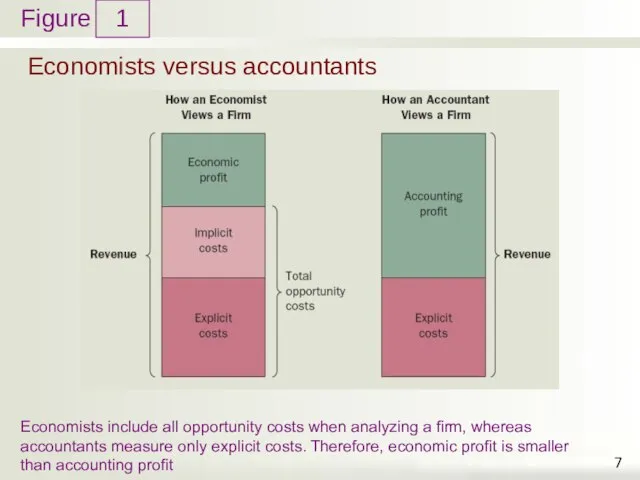
- 7. Economists versus accountants 1 Economists include all opportunity costs when analyzing a firm, whereas accountants measure
- 8. Production and Costs Production function Relationship between Quantity of inputs used to make a good And
- 9. Production and Costs Diminishing marginal product Marginal product of an input declines as the quantity of
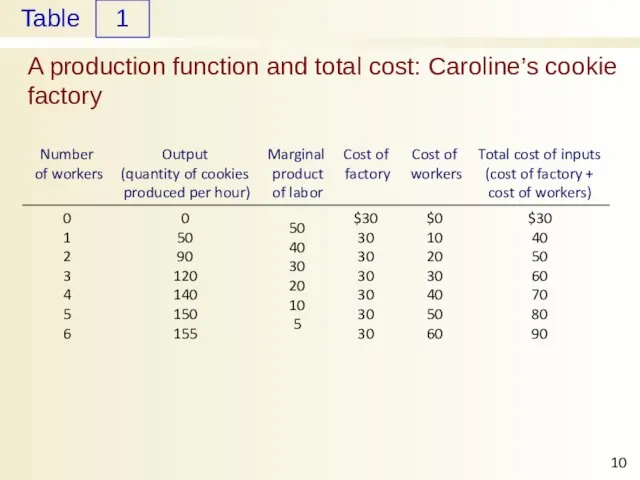
- 10. A production function and total cost: Caroline’s cookie factory 1
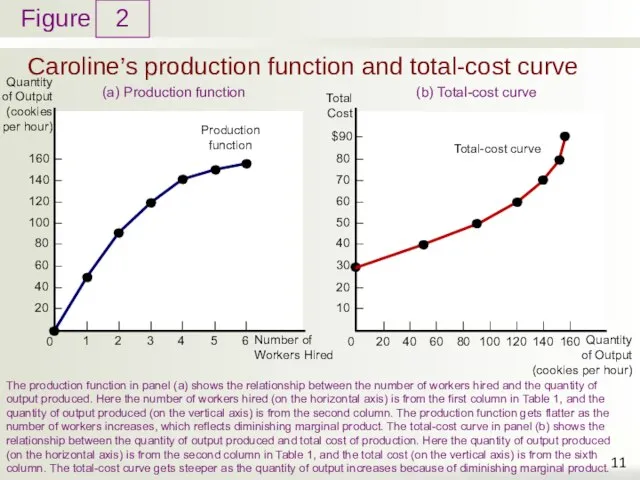
- 11. Caroline’s production function and total-cost curve 2 (a) Production function The production function in panel (a)
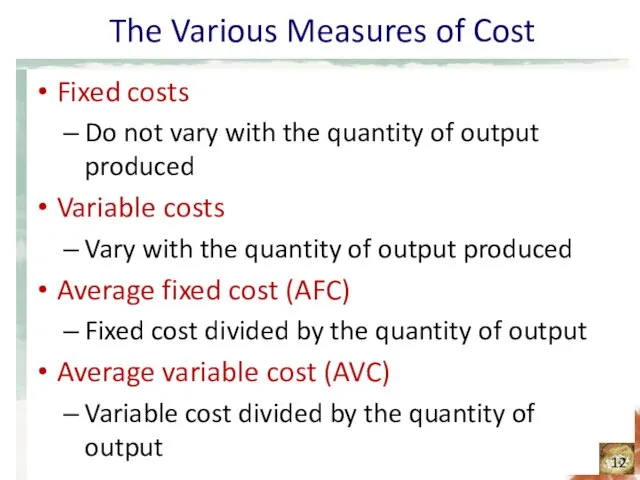
- 12. The Various Measures of Cost Fixed costs Do not vary with the quantity of output produced
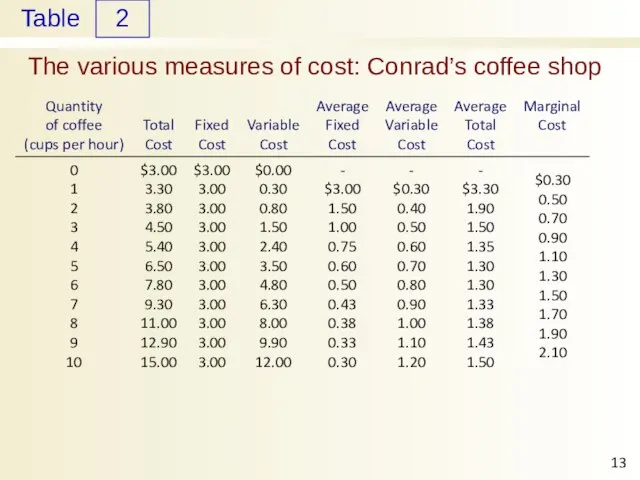
- 13. The various measures of cost: Conrad’s coffee shop 2
- 14. Conrad’s total-cost curve 3 Here the quantity of output produced (on the horizontal axis) is from
- 15. The Various Measures of Cost Average total cost (ATC) Total cost divided by the quantity of
- 16. The Various Measures of Cost Average total cost Cost of a typical unit of output If
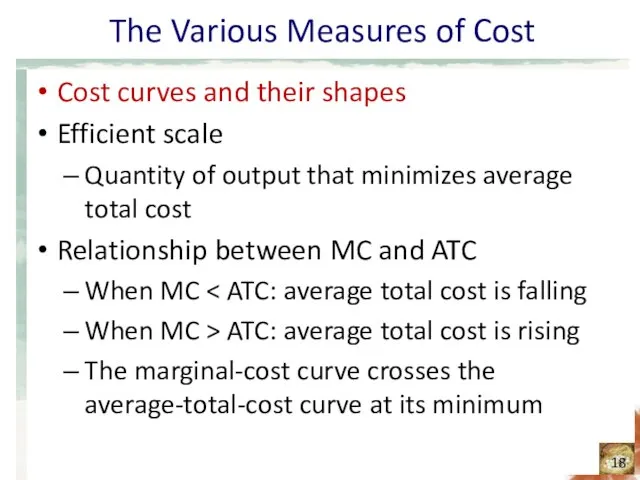
- 17. The Various Measures of Cost Cost curves and their shapes Rising marginal cost Because of diminishing
- 18. The Various Measures of Cost Cost curves and their shapes Efficient scale Quantity of output that
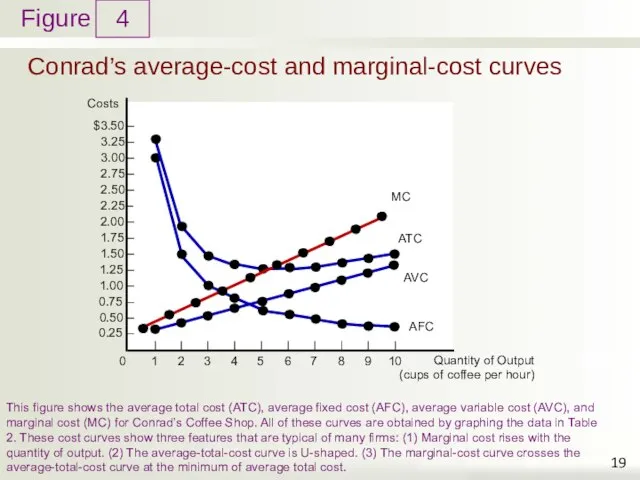
- 19. Conrad’s average-cost and marginal-cost curves 4 This figure shows the average total cost (ATC), average fixed
- 20. The Various Measures of Cost Typical cost curves Marginal cost eventually rises with the quantity of
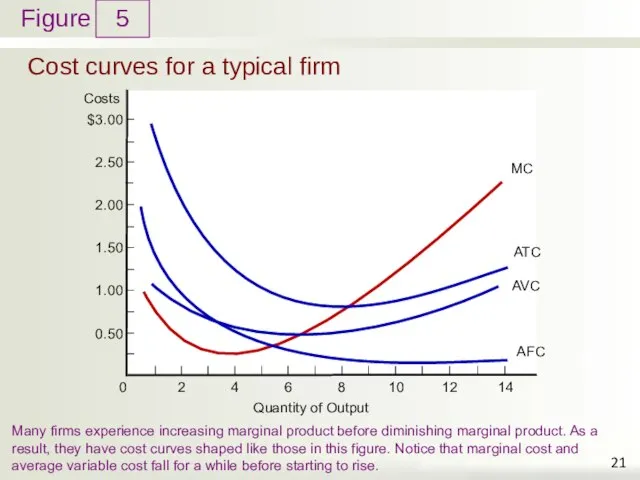
- 21. Cost curves for a typical firm 5 Many firms experience increasing marginal product before diminishing marginal
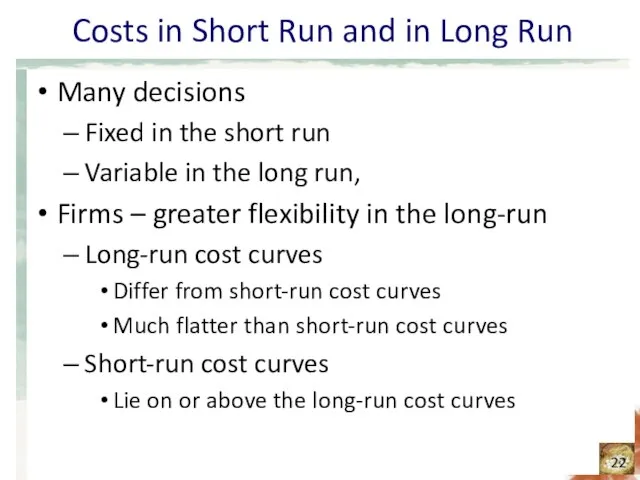
- 22. Costs in Short Run and in Long Run Many decisions Fixed in the short run Variable
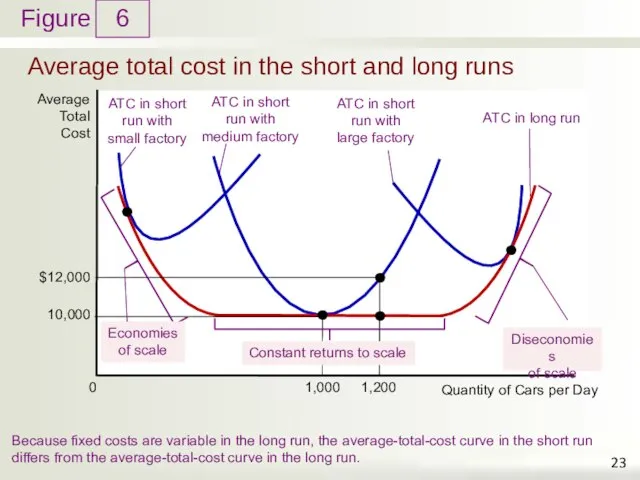
- 23. Average total cost in the short and long runs 6 Because fixed costs are variable in
- 24. Costs in Short Run and in Long Run Economies of scale Long-run average total cost falls
- 25. Costs in Short Run and in Long Run Diseconomies of scale Long-run average total cost rises
- 27. Скачать презентацию
Слайд 3What are Costs?
Costs as opportunity costs
The cost of something is what you
What are Costs?
Costs as opportunity costs
The cost of something is what you
Слайд 4What are Costs?
Costs as opportunity costs
Explicit costs
Input costs that require an outlay
What are Costs?
Costs as opportunity costs
Explicit costs
Input costs that require an outlay
Слайд 5What are Costs?
The cost of capital as an opportunity cost
Implicit cost
Interest income
What are Costs?
The cost of capital as an opportunity cost
Implicit cost
Interest income
Слайд 6What are Costs?
Economic profit
Total revenue minus total cost
Including both explicit and implicit
What are Costs?
Economic profit
Total revenue minus total cost
Including both explicit and implicit
Слайд 7Economists versus accountants
1
Economists include all opportunity costs when analyzing a firm, whereas
Economists versus accountants
1
Economists include all opportunity costs when analyzing a firm, whereas
Слайд 8Production and Costs
Production function
Relationship between
Quantity of inputs used to make a good
And
Production and Costs
Production function
Relationship between
Quantity of inputs used to make a good
And
Слайд 9Production and Costs
Diminishing marginal product
Marginal product of an input declines as the
Production and Costs
Diminishing marginal product
Marginal product of an input declines as the
Слайд 10A production function and total cost: Caroline’s cookie factory
1
A production function and total cost: Caroline’s cookie factory
1
Слайд 11Caroline’s production function and total-cost curve
2
(a) Production function
The production function in panel
Caroline’s production function and total-cost curve
2
(a) Production function
The production function in panel
Слайд 12The Various Measures of Cost
Fixed costs
Do not vary with the quantity of
The Various Measures of Cost
Fixed costs
Do not vary with the quantity of
Слайд 13The various measures of cost: Conrad’s coffee shop
2
The various measures of cost: Conrad’s coffee shop
2
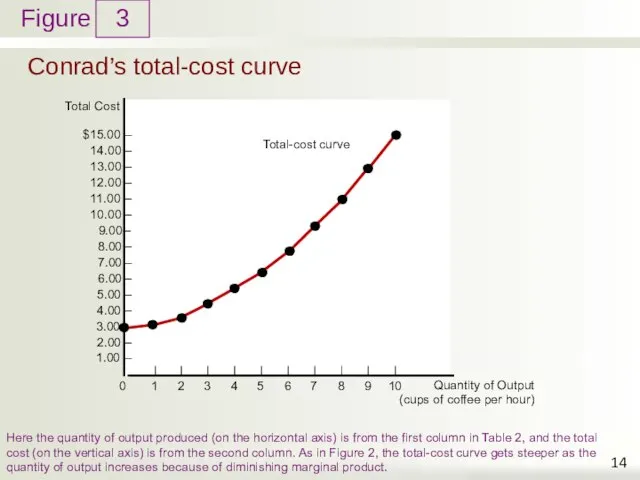
Слайд 14Conrad’s total-cost curve
3
Here the quantity of output produced (on the horizontal axis)
Conrad’s total-cost curve
3
Here the quantity of output produced (on the horizontal axis)
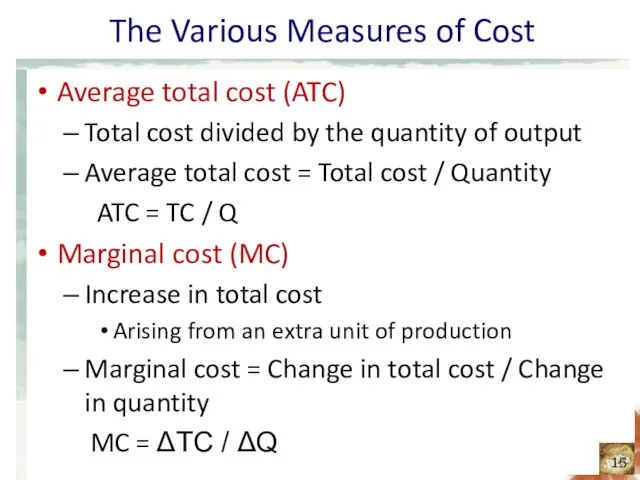
Слайд 15The Various Measures of Cost
Average total cost (ATC)
Total cost divided by the
The Various Measures of Cost
Average total cost (ATC)
Total cost divided by the
Слайд 16The Various Measures of Cost
Average total cost
Cost of a typical unit of
The Various Measures of Cost
Average total cost
Cost of a typical unit of
Слайд 17The Various Measures of Cost
Cost curves and their shapes
Rising marginal cost
Because of
The Various Measures of Cost
Cost curves and their shapes
Rising marginal cost
Because of
Слайд 18The Various Measures of Cost
Cost curves and their shapes
Efficient scale
Quantity of output
The Various Measures of Cost
Cost curves and their shapes
Efficient scale
Quantity of output
Слайд 19Conrad’s average-cost and marginal-cost curves
4
This figure shows the average total cost (ATC),
Conrad’s average-cost and marginal-cost curves
4
This figure shows the average total cost (ATC),
Слайд 20The Various Measures of Cost
Typical cost curves
Marginal cost eventually rises with
The Various Measures of Cost
Typical cost curves
Marginal cost eventually rises with
Слайд 21Cost curves for a typical firm
5
Many firms experience increasing marginal product before
Cost curves for a typical firm
5
Many firms experience increasing marginal product before
Слайд 22Costs in Short Run and in Long Run
Many decisions
Fixed in the short
Costs in Short Run and in Long Run
Many decisions
Fixed in the short
Слайд 23Average total cost in the short and long runs
6
Because fixed costs are
Average total cost in the short and long runs
6
Because fixed costs are
Слайд 24Costs in Short Run and in Long Run
Economies of scale
Long-run average total
Costs in Short Run and in Long Run
Economies of scale
Long-run average total
Слайд 25Costs in Short Run and in Long Run
Diseconomies of scale
Long-run average total
Costs in Short Run and in Long Run
Diseconomies of scale
Long-run average total
 О том, что я слушаю…
 Результаты контроля «Состояние учебно-воспитательного процесса в 11-х классах»
 Система работы с детьми дошкольного возраста, не охваченными дошкольным образованием
 Множественное число существительного
 Презентация на тему "Творча обдарованість" - скачать презентации по Педагогике
 Работа с браузером
 The Secrets of English Letter
 Презентация на тему МНОГООБРАЗИЕ ХЕЛИЦЕРОВЫХ
  Нормативно-правовое регулирование образовательного процесса в РФ
 Сервисная модель управления ИТ в условиях холдинга
 Основы алгоритмизации
  $RN4C5B6 (1)
 Презентация на тему Гражданская войны 1919-1920 гг
 Основы права. Своя игра
 Презентация на тему Очень подозрительный тип (2 класс)
 Концепция предвыборного плаката партии КПРФ
 Автоследование на Comon.ru
 Ростелеком. Связь везде и всегда
 Лестница успеха
 Роман Гончарова «Обломов» 10 класс
 Учебно-методический пакет Оранжевое небо
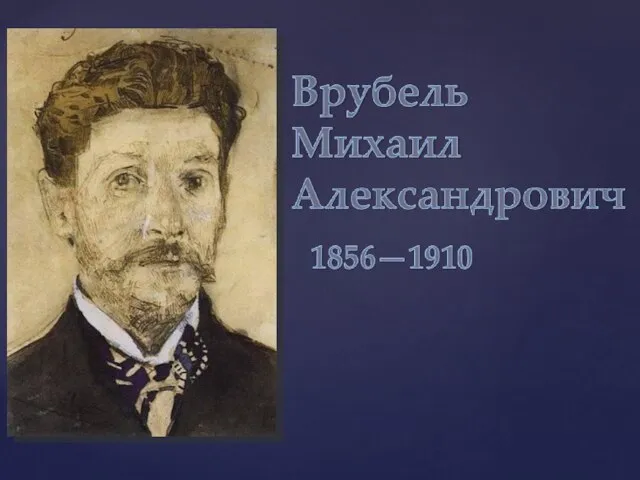 Врубель Михаил Александрович 1856-1910
 Эмоции. Виды эмоций
 Музейная практика
 В. Я. Брюсов Ассортимент Конституция Мадригал Аттестат Закон Магистр Право Репродукция Фурор Задание: что означают эти слова?
 Альтернативный рок
 Презентация на тему Почему мы спим ночью (1 класс)
 English Lesson