- Rescue of the senescence phenotype of AD MSCs by autophagy activation in 3D spheroids

Содержание
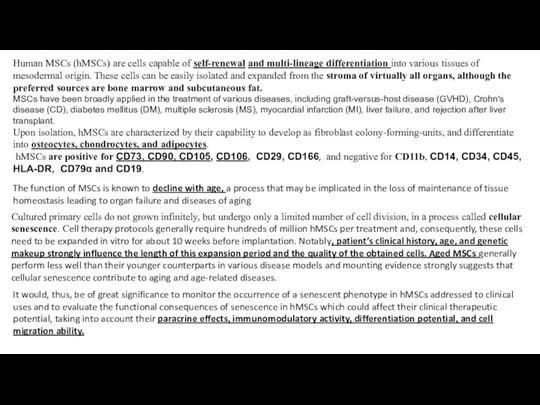
- 2. Human MSCs (hMSCs) are cells capable of self-renewal and multi-lineage differentiation into various tissues of mesodermal
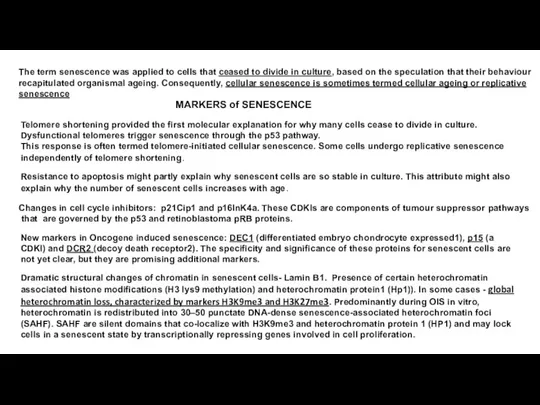
- 3. The term senescence was applied to cells that ceased to divide in culture, based on the
- 4. Expression levels of DNMT1 and DNMT3B are significantly decreased during the replicative senescence of MSCs, leading
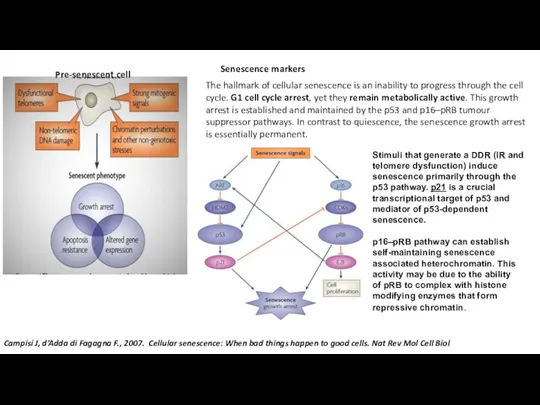
- 5. The hallmark of cellular senescence is an inability to progress through the cell cycle. G1 cell
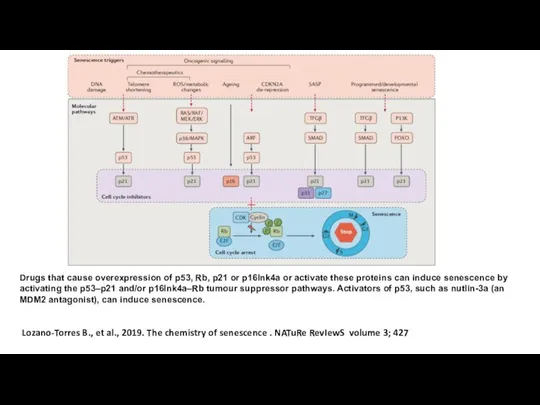
- 6. Lozano-Torres B., et al., 2019. The chemistry of senescence . NATuRe RevIewS volume 3; 427 Drugs
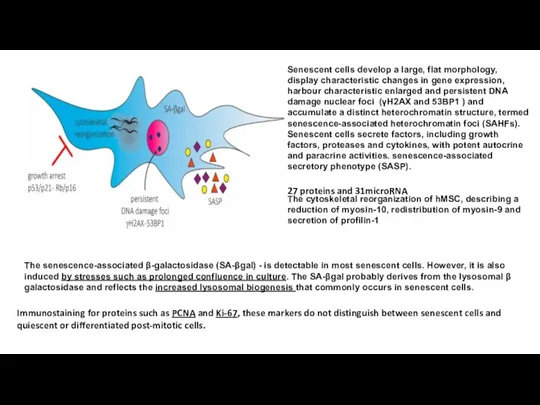
- 7. The senescence-associated β-galactosidase (SA-βgal) - is detectable in most senescent cells. However, it is also induced
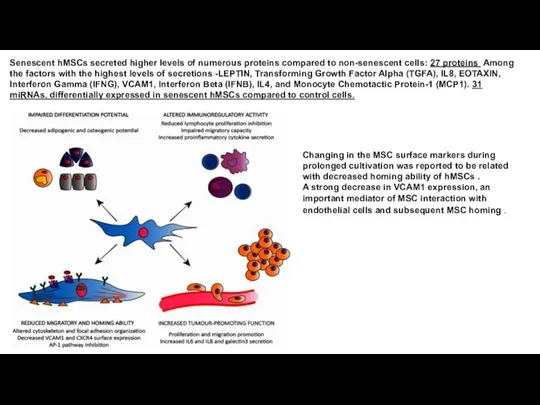
- 8. Senescent hMSCs secreted higher levels of numerous proteins compared to non-senescent cells: 27 proteins Among the
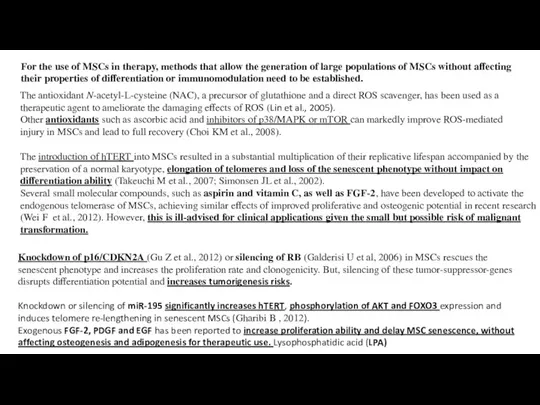
- 9. For the use of MSCs in therapy, methods that allow the generation of large populations of
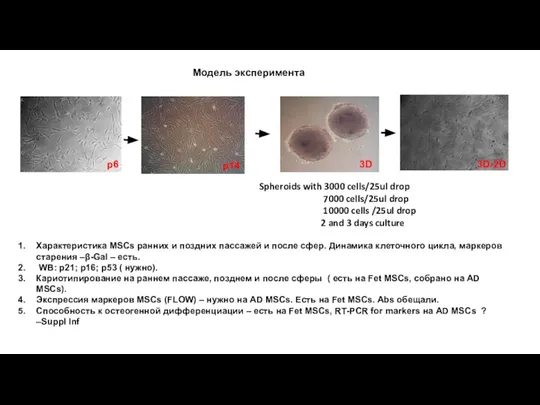
- 10. Модель эксперимента p6 3D 3D-2D Характеристика MSCs ранних и поздних пассажей и после сфер. Динамика клеточного
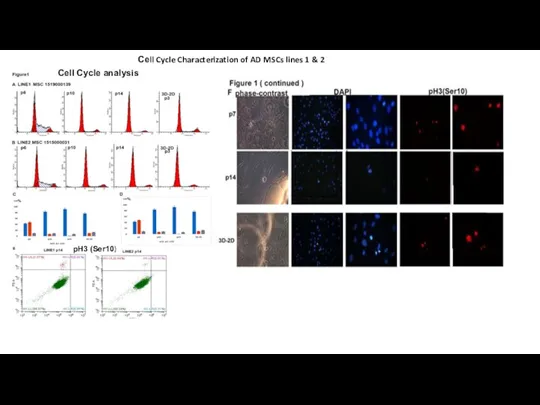
- 11. Сеll Cycle Characterization of AD MSCs lines 1 & 2 Cell Cycle analysis pH3 (Ser10)
- 12. %
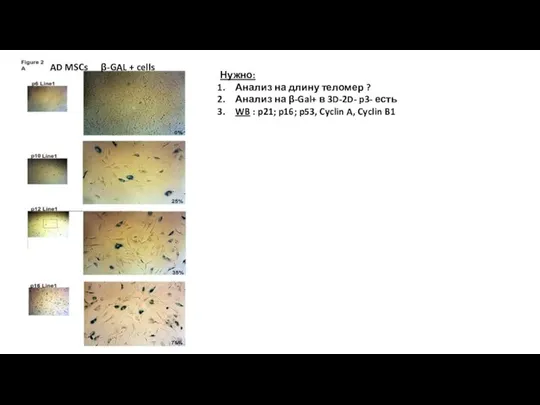
- 13. Нужно: Анализ на длину теломер ? Анализ на β-Gal+ в 3D-2D- p3- есть WB : p21;
- 14. КАРИОТИПИРОВАНИЕ Fet MSCs p7 3D-2D /p3 Кариотипирование AD MSCs -+
- 15. Остеогенная дифференцировка Fet MSCs Окрашивание на щелочную фосфатазу p6 3D → 2D Окрашивание по Van Kossa
- 16. Автофагоцитоз (реакция на кислую фосфатазу по Гомори ) Fet MSCs p6 p12 shp 3D-2D Активность AcPase
- 17. p12 p230 trans-Golgi-coil protein p5 3D-2D shp p230/golgin-245 is a trans-Golgi coiled-coil protein that is known
- 18. Происходит ли омоложение популяции в сфероидах за счет усиленного аутофагоцитоза ? Regulatory components for autophagy induction
- 19. The mammalian/mechanistic target of rapamycin (mTOR) is a key component of cellular metabolism that integrates nutrient
- 20. Signaling cascades involved in the regulation of mammalian autophagy Activation of growth factor receptors stimulates the
- 21. Decreased Production of Reactive Oxygen Species in 3D-mesenhcymal Stem Cell Spheroids Leads to Increased Therapeutic Efficacy
- 22. PI3K/AKT and MAPK inhibit autophagy by regulating mTOR signaling pathway, p53 serves the opposite effect. AMPK
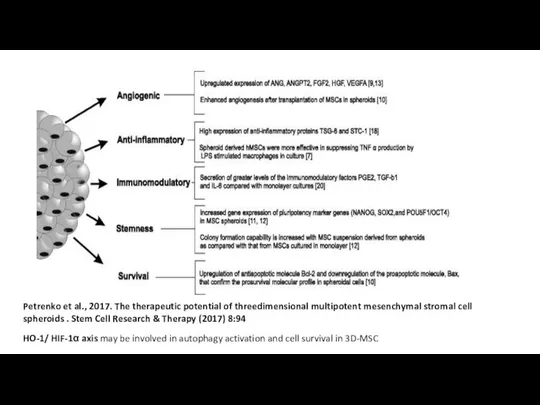
- 23. Petrenko et al., 2017. The therapeutic potential of threedimensional multipotent mesenchymal stromal cell spheroids . Stem
- 24. To validate this assumption, autophagy need to be assessed by: (1) Histochemical staining - + (2)
- 25. Most accurate way to measure autophagy is with an autophagic flux assay defined as the new
- 26. Одним из специфических свойств МСК является колониеобразование. При этом установлено, что только около 30% колониеобразующих мезенхимальных
- 28. Скачать презентацию
Слайд 3The term senescence was applied to cells that ceased to divide in
The term senescence was applied to cells that ceased to divide in
Слайд 4Expression levels of DNMT1 and DNMT3B are significantly decreased during the replicative
Expression levels of DNMT1 and DNMT3B are significantly decreased during the replicative
Слайд 5The hallmark of cellular senescence is an inability to progress through the
The hallmark of cellular senescence is an inability to progress through the
Слайд 6 Lozano-Torres B., et al., 2019. The chemistry of senescence . NATuRe RevIewS
Lozano-Torres B., et al., 2019. The chemistry of senescence . NATuRe RevIewS
Слайд 7The senescence-associated β-galactosidase (SA-βgal) - is detectable in most senescent cells. However,
The senescence-associated β-galactosidase (SA-βgal) - is detectable in most senescent cells. However,
Слайд 8Senescent hMSCs secreted higher levels of numerous proteins compared to non-senescent cells:
Senescent hMSCs secreted higher levels of numerous proteins compared to non-senescent cells:
Слайд 9For the use of MSCs in therapy, methods that allow the generation
For the use of MSCs in therapy, methods that allow the generation
Слайд 10Модель эксперимента
p6
3D
3D-2D
Характеристика MSCs ранних и поздних пассажей и после сфер. Динамика
Модель эксперимента
p6
3D
3D-2D
Характеристика MSCs ранних и поздних пассажей и после сфер. Динамика
Слайд 11Сеll Cycle Characterization of AD MSCs lines 1 & 2
Cell Cycle analysis
Сеll Cycle Characterization of AD MSCs lines 1 & 2
Cell Cycle analysis
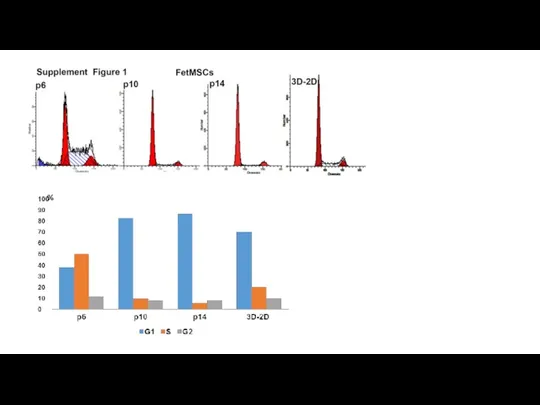
Слайд 13Нужно:
Анализ на длину теломер ?
Анализ на β-Gal+ в 3D-2D- p3- есть
WB
Нужно:
Анализ на длину теломер ?
Анализ на β-Gal+ в 3D-2D- p3- есть
WB
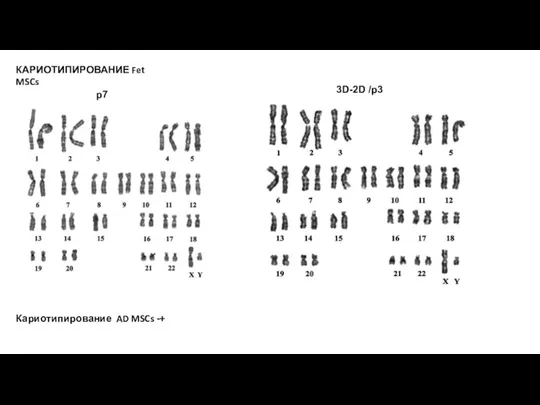
Слайд 14КАРИОТИПИРОВАНИЕ Fet MSCs
p7
3D-2D /p3
Кариотипирование AD MSCs -+
КАРИОТИПИРОВАНИЕ Fet MSCs
p7
3D-2D /p3
Кариотипирование AD MSCs -+
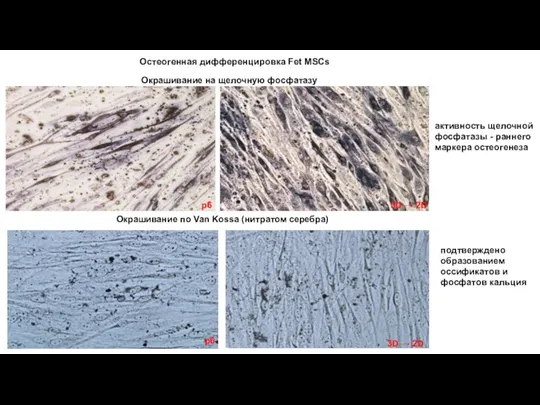
Слайд 15 Остеогенная дифференцировка Fet MSCs
Окрашивание на щелочную фосфатазу
p6
3D → 2D
Окрашивание по Van
Остеогенная дифференцировка Fet MSCs
Окрашивание на щелочную фосфатазу
p6
3D → 2D
Окрашивание по Van
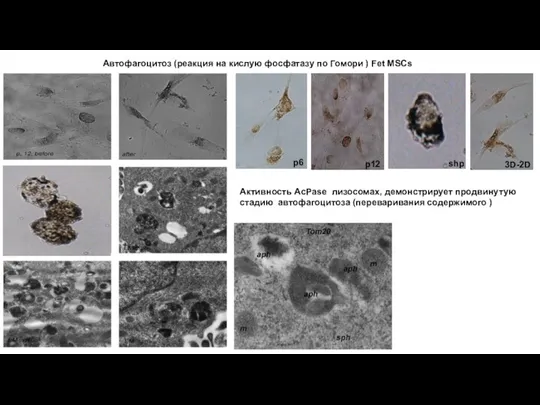
Слайд 16Автофагоцитоз (реакция на кислую фосфатазу по Гомори ) Fet MSCs
p6
p12
shp
3D-2D
Активность AcPase
Автофагоцитоз (реакция на кислую фосфатазу по Гомори ) Fet MSCs
p6
p12
shp
3D-2D
Активность AcPase
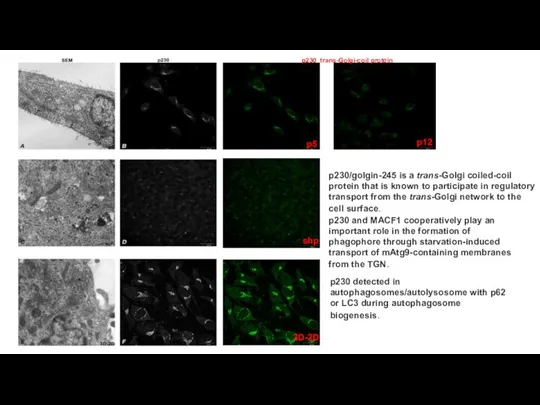
Слайд 17p12
p230 trans-Golgi-coil protein
p5
3D-2D
shp
p230/golgin-245 is a trans-Golgi coiled-coil protein that is known to
p12
p230 trans-Golgi-coil protein
p5
3D-2D
shp
p230/golgin-245 is a trans-Golgi coiled-coil protein that is known to
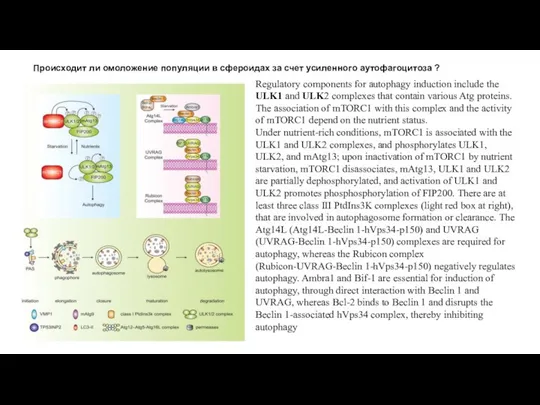
Слайд 18Происходит ли омоложение популяции в сфероидах за счет усиленного аутофагоцитоза ?
Regulatory components
Происходит ли омоложение популяции в сфероидах за счет усиленного аутофагоцитоза ?
Regulatory components
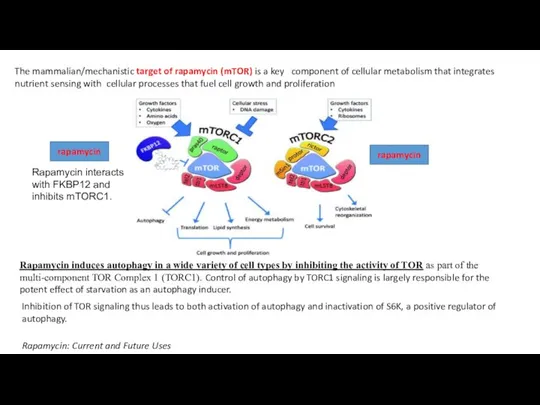
Слайд 19The mammalian/mechanistic target of rapamycin (mTOR) is a key component of cellular metabolism that integrates
nutrient sensing with cellular processes that fuel cell growth and proliferation
rapamycin
rapamycin
Rapamycin interacts with FKBP12 and inhibits mTORC1.
Rapamycin: Current and Future
The mammalian/mechanistic target of rapamycin (mTOR) is a key component of cellular metabolism that integrates
nutrient sensing with cellular processes that fuel cell growth and proliferation
rapamycin
rapamycin
Rapamycin interacts with FKBP12 and inhibits mTORC1.
Rapamycin: Current and Future
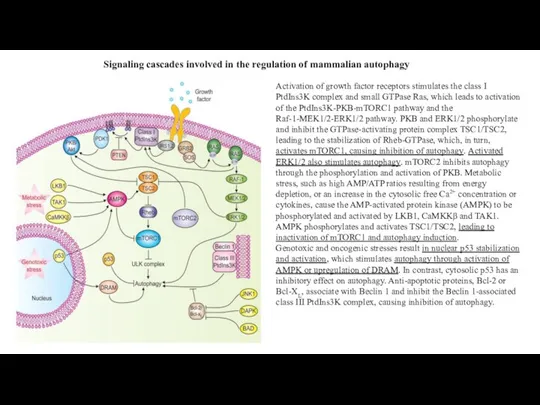
Слайд 20Signaling cascades involved in the regulation of mammalian autophagy
Activation of growth factor
Signaling cascades involved in the regulation of mammalian autophagy
Activation of growth factor
Слайд 21Decreased Production of Reactive Oxygen Species in 3D-mesenhcymal Stem Cell Spheroids Leads
Decreased Production of Reactive Oxygen Species in 3D-mesenhcymal Stem Cell Spheroids Leads
Слайд 22PI3K/AKT and MAPK inhibit autophagy by regulating mTOR signaling pathway, p53 serves
PI3K/AKT and MAPK inhibit autophagy by regulating mTOR signaling pathway, p53 serves
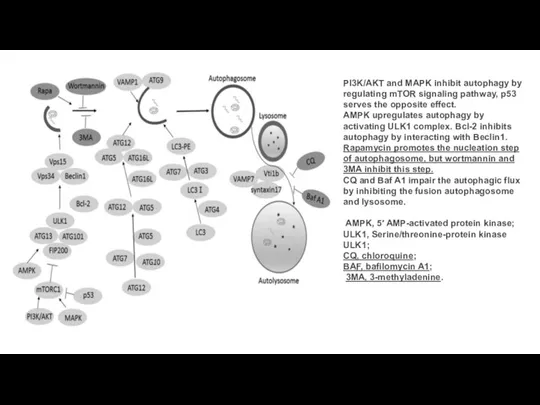
Слайд 23Petrenko et al., 2017. The therapeutic potential of threedimensional multipotent mesenchymal stromal
Petrenko et al., 2017. The therapeutic potential of threedimensional multipotent mesenchymal stromal
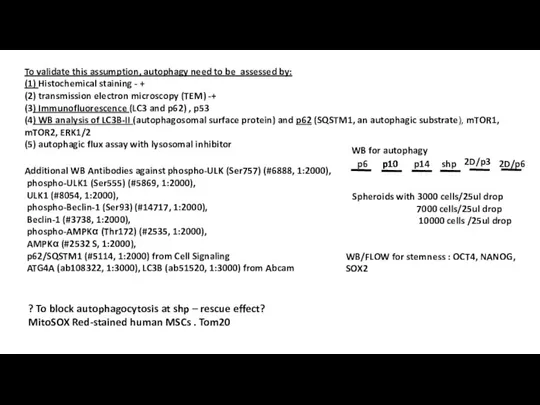
Слайд 24To validate this assumption, autophagy need to be assessed by:
(1) Histochemical
To validate this assumption, autophagy need to be assessed by:
(1) Histochemical
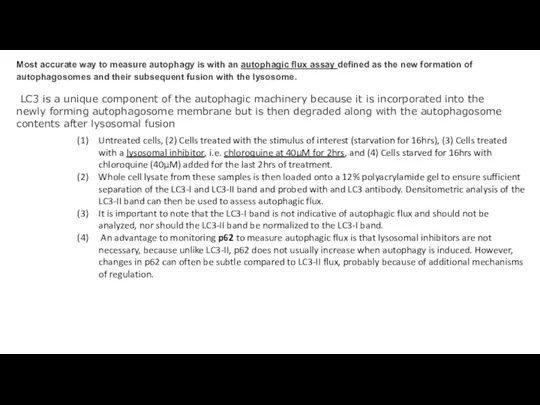
Слайд 25Most accurate way to measure autophagy is with an autophagic flux assay defined
Most accurate way to measure autophagy is with an autophagic flux assay defined
Слайд 26Одним из специфических свойств МСК является колониеобразование. При этом установлено, что только
Одним из специфических свойств МСК является колониеобразование. При этом установлено, что только
 Птицы Рязанской области
 От семечка до
 Семейство Розоцветные
 11.7 Хромомная теория. Генетика пола. Наследование, сцепленное с полом
 Автор: учитель биологии Константинова Елена Анатольевна
 Физические и химические явления в природе
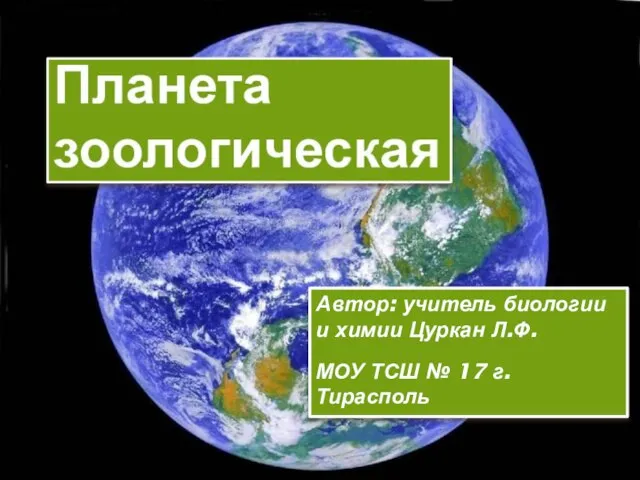 Презентация на тему Планета Зоологическая
 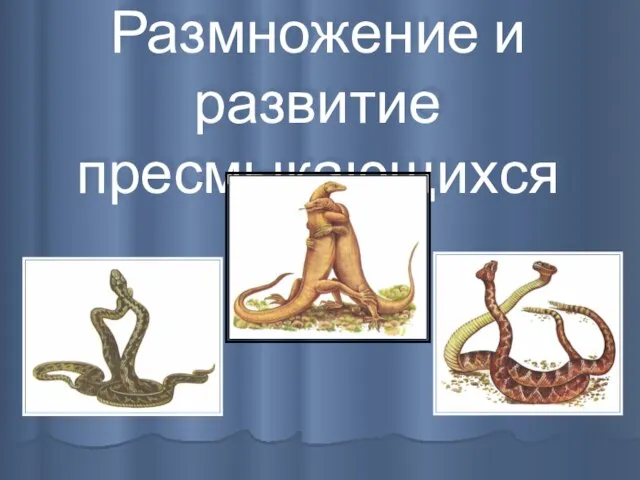 Презентация на тему Размножение и развитие пресмыкающихся
  Размножение покрытосеменных растений
 Цветы
Цветы Барофизиология
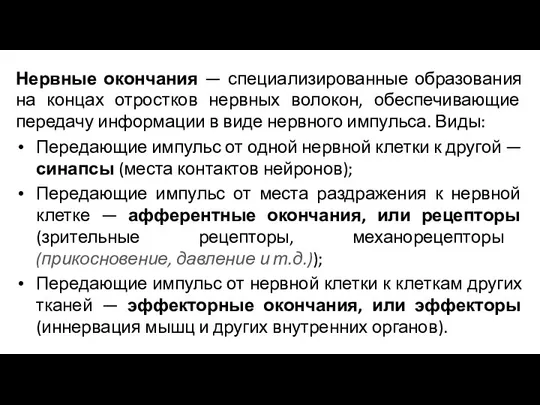 Нервные окончания
 Знакомство с внешним строением растения. Лабораторная работа 3
 Презентация на тему "Отдел Мохообразные. Общая характеристика" - презентации по Биологии
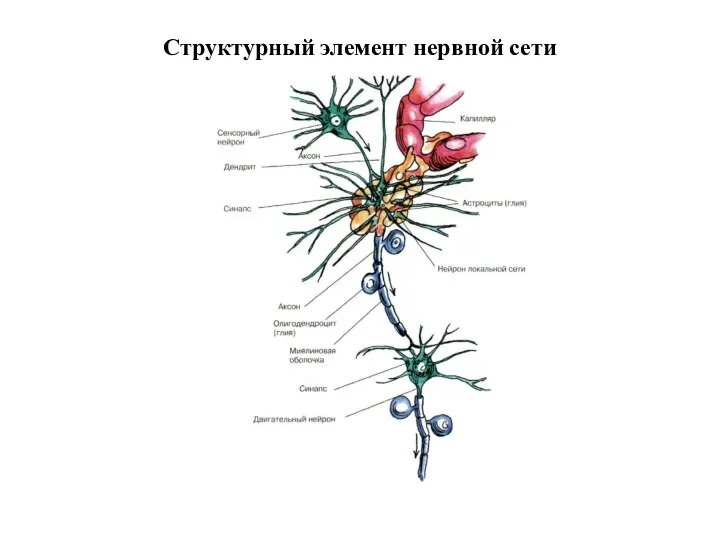 Структурный элемент нервной сети
 Unusual animals in the Mariana Trench
 Что такое почва
 Нервная система
 Для чего собаке хвост
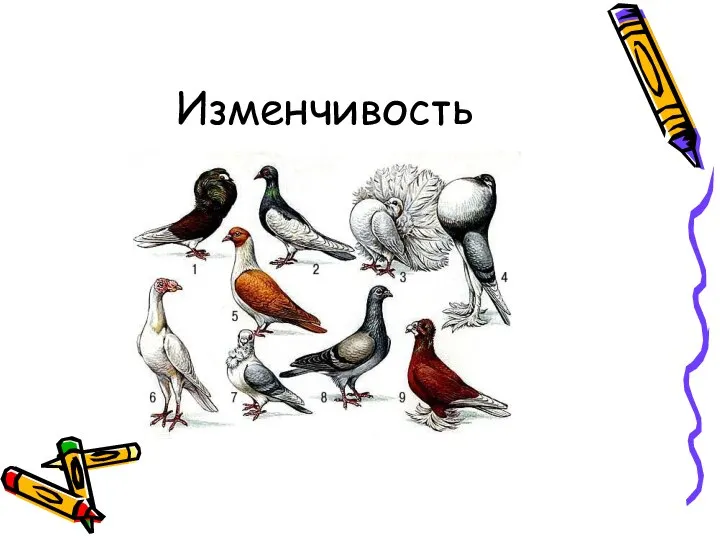 Изменчивость. Наследственная изменчивость
 Укоренение черенков
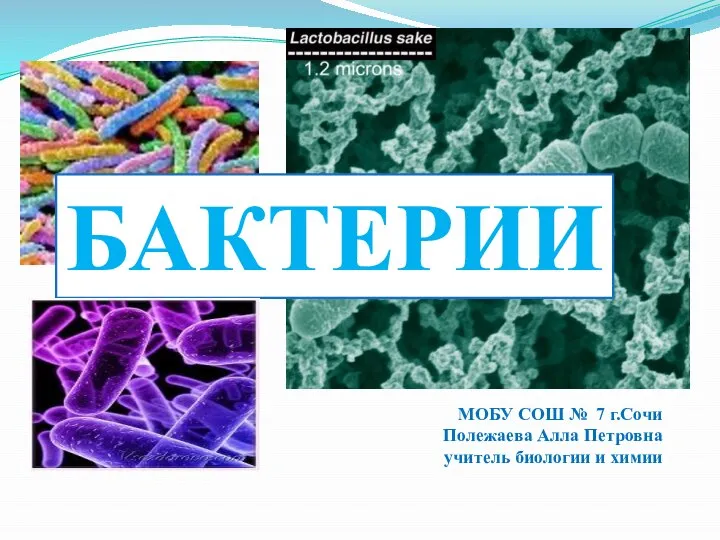 Виды бактерий
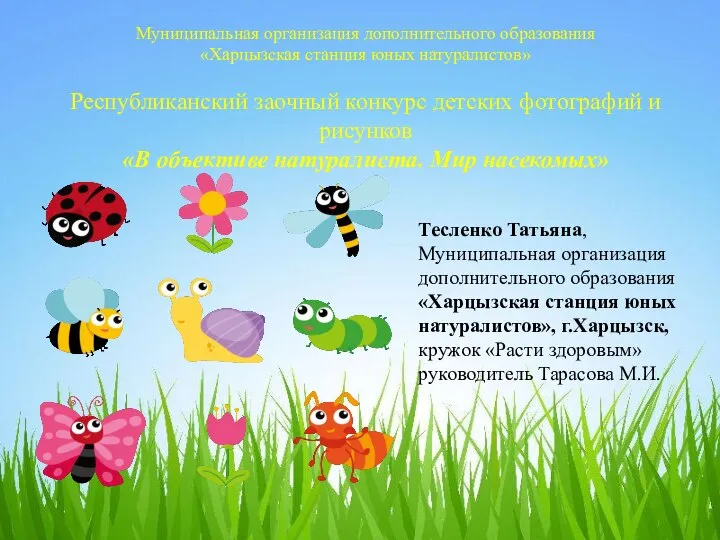 Мир насекомых. Фоторабота Тесленко Татьяны
 Царство животные. Урок 1
 Медовая викторина
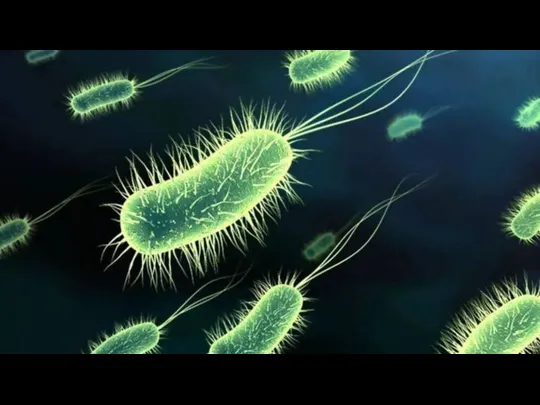 Бактерии: строение и жизнедеятельность. 5 класс
 054 урок Побеги и почки
 Фестиваль тюльпанов в Калмыкии