- A Ramsey’s model for the economy of China.

Содержание
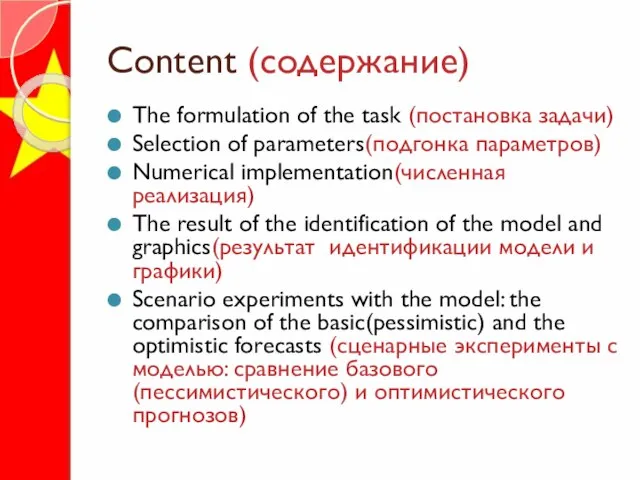
- 2. Content (содержание) The formulation of the task (постановка задачи) Selection of parameters(подгонка параметров) Numerical implementation(численная реализация)
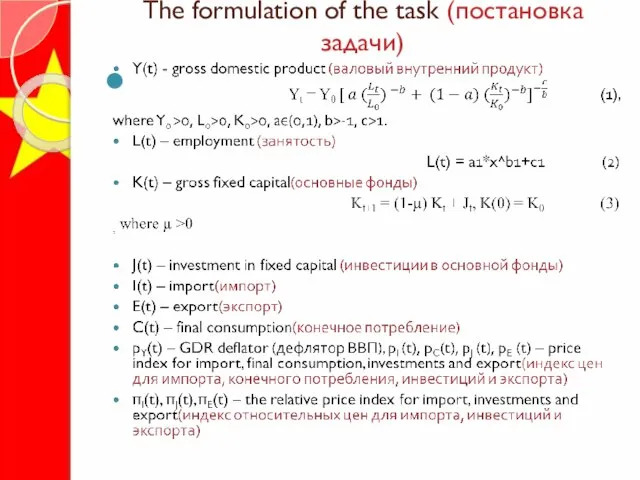
- 3. The formulation of the task (постановка задачи)
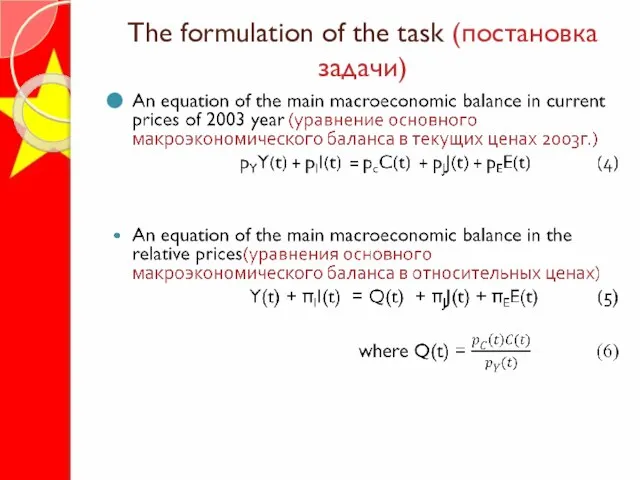
- 4. The formulation of the task (постановка задачи)
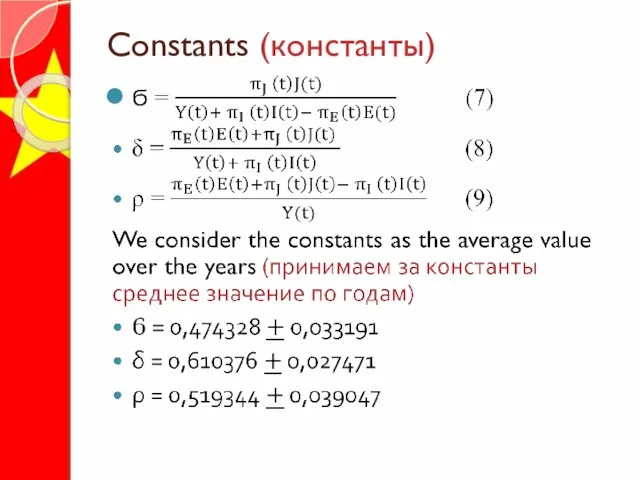
- 5. Constants (константы)
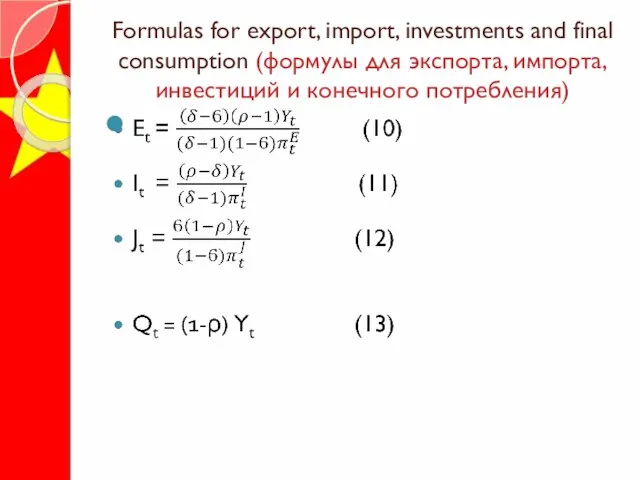
- 6. Formulas for export, import, investments and final consumption (формулы для экспорта, импорта, инвестиций и конечного потребления)
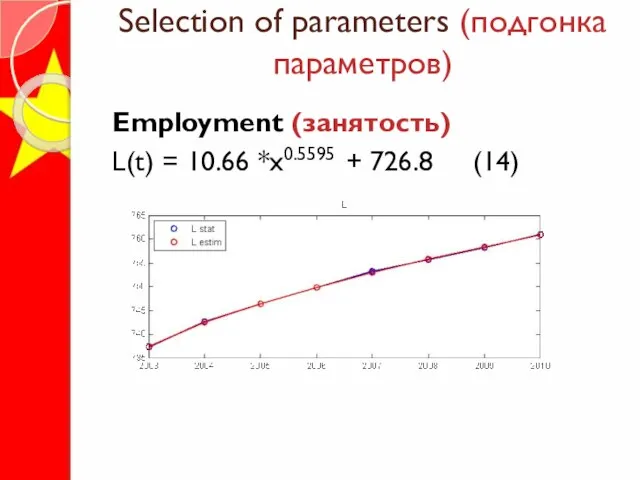
- 7. Selection of parameters (подгонка параметров) Employment (занятость) L(t) = 10.66 *x0.5595 + 726.8 (14)
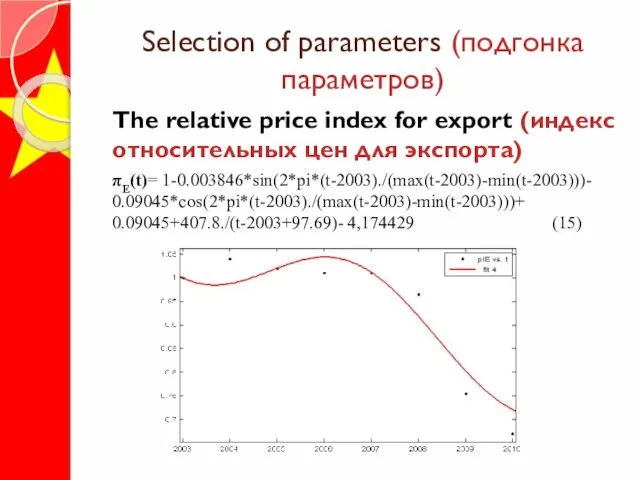
- 8. Selection of parameters (подгонка параметров) The relative price index for export (индекс относительных цен для экспорта)
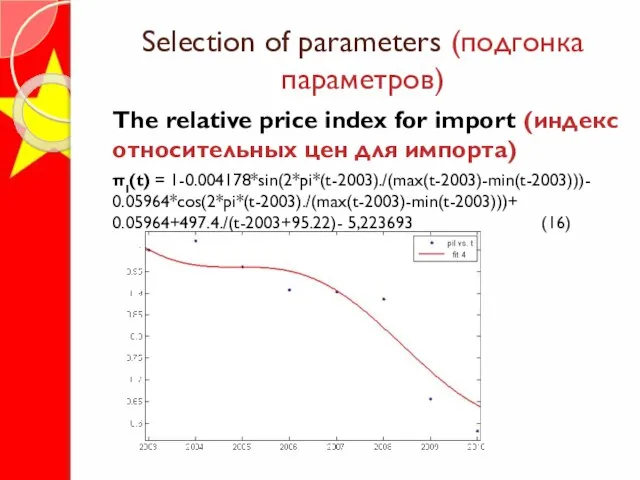
- 9. Selection of parameters (подгонка параметров) The relative price index for import (индекс относительных цен для импорта)
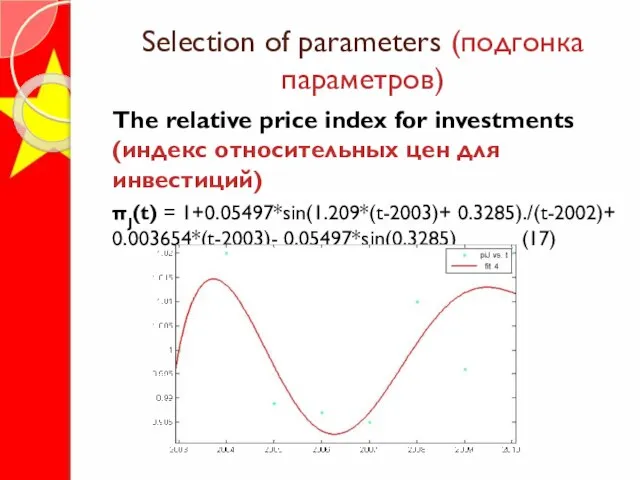
- 10. Selection of parameters (подгонка параметров) The relative price index for investments (индекс относительных цен для инвестиций)
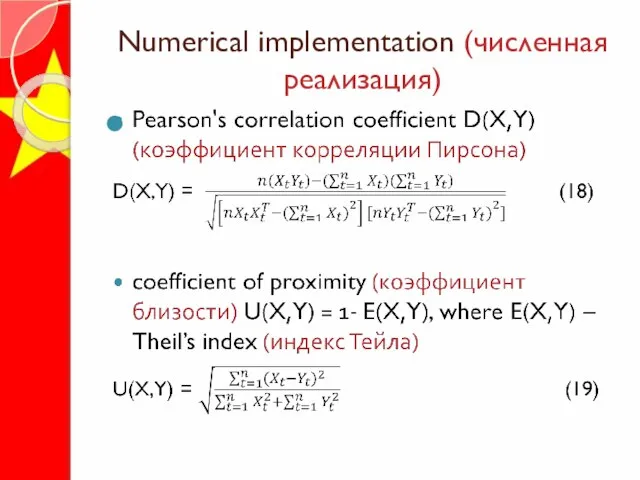
- 11. Numerical implementation (численная реализация)
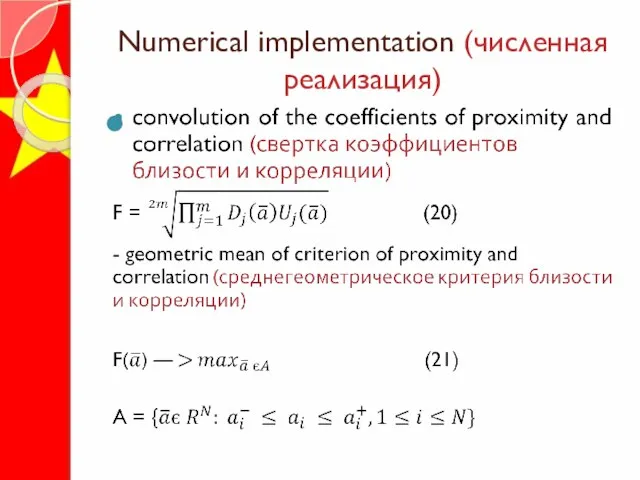
- 12. Numerical implementation (численная реализация)
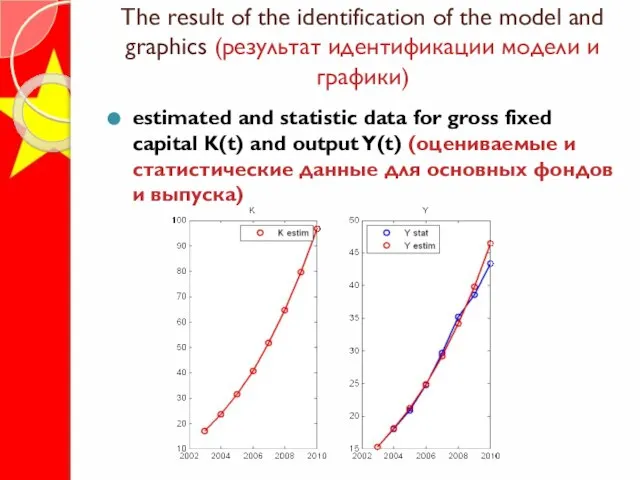
- 13. The result of the identification of the model and graphics (результат идентификации модели и графики) estimated
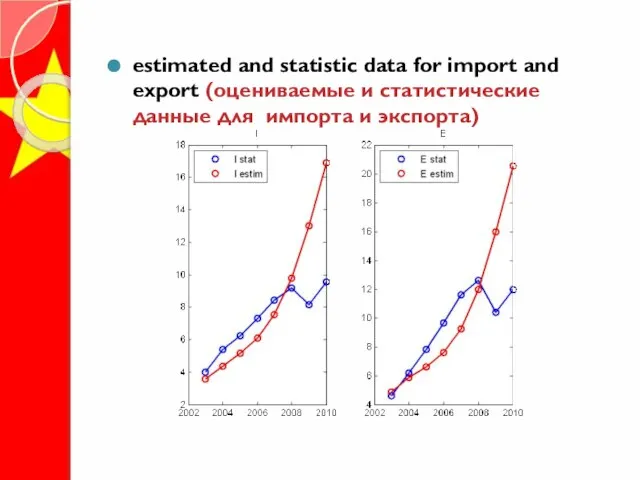
- 14. estimated and statistic data for import and export (оцениваемые и статистические данные для импорта и экспорта)
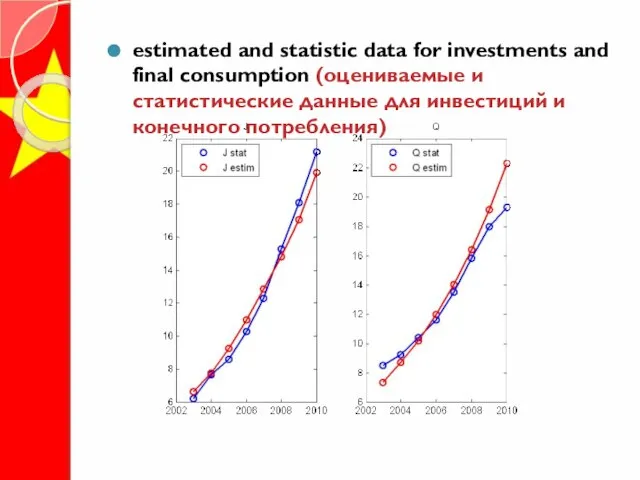
- 15. estimated and statistic data for investments and final consumption (оцениваемые и статистические данные для инвестиций и
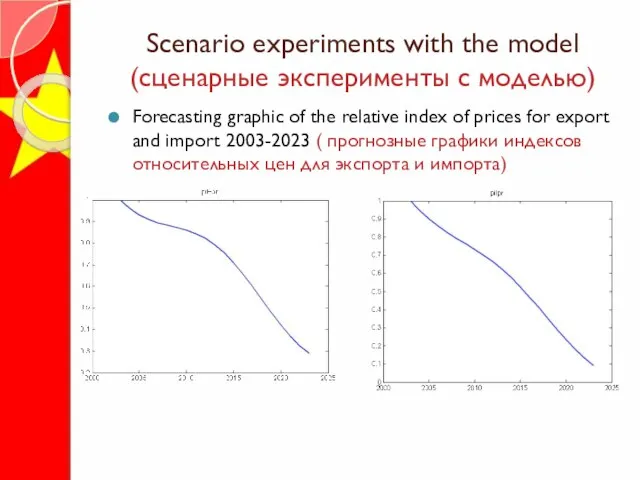
- 16. Scenario experiments with the model (сценарные эксперименты с моделью) Forecasting graphic of the relative index of
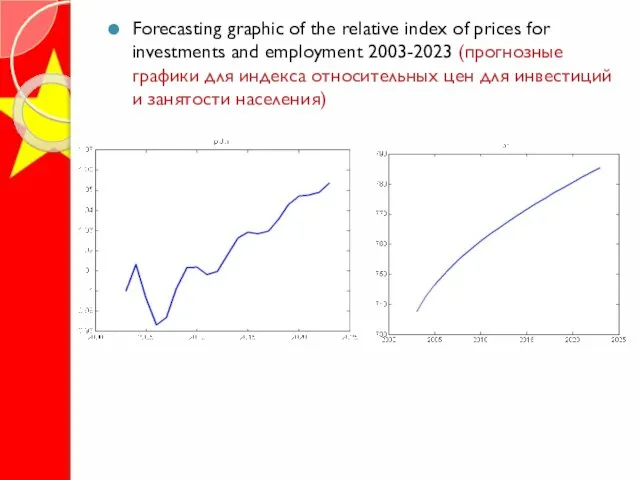
- 17. Forecasting graphic of the relative index of prices for investments and employment 2003-2023 (прогнозные графики для
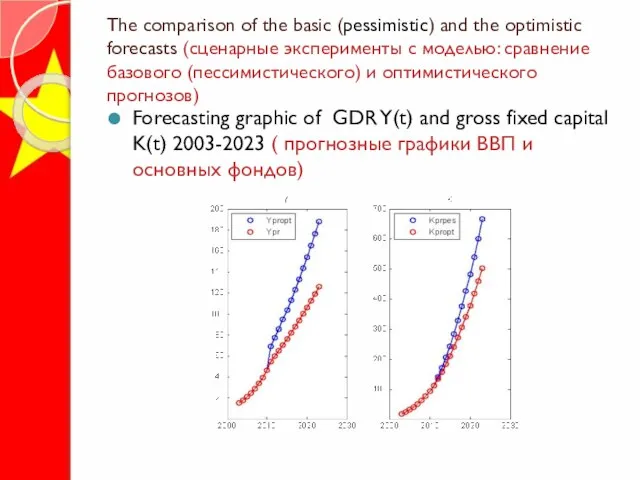
- 18. The comparison of the basic (pessimistic) and the optimistic forecasts (сценарные эксперименты с моделью: сравнение базового
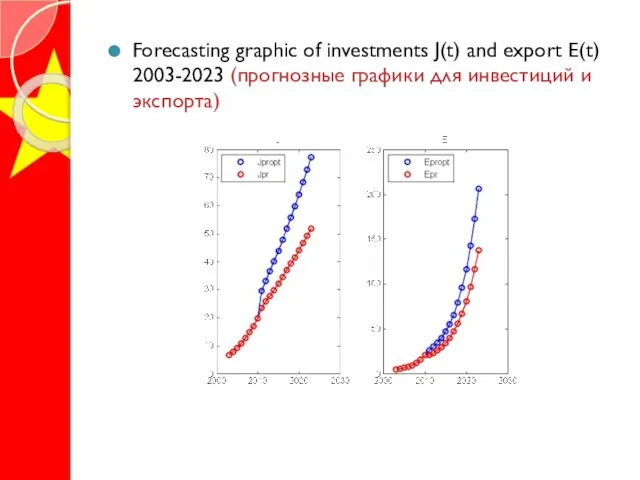
- 19. Forecasting graphic of investments J(t) and export E(t) 2003-2023 (прогнозные графики для инвестиций и экспорта)
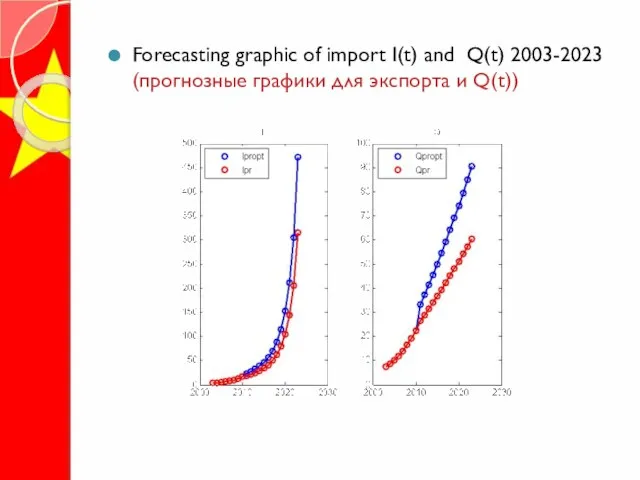
- 20. Forecasting graphic of import I(t) and Q(t) 2003-2023 (прогнозные графики для экспорта и Q(t))
- 22. Скачать презентацию
Слайд 2Content (содержание)
The formulation of the task (постановка задачи)
Selection of parameters(подгонка параметров)
Numerical implementation(численная
Content (содержание)
The formulation of the task (постановка задачи)
Selection of parameters(подгонка параметров)
Numerical implementation(численная
Слайд 3The formulation of the task (постановка задачи)
The formulation of the task (постановка задачи)
Слайд 4The formulation of the task (постановка задачи)
The formulation of the task (постановка задачи)
Слайд 5Constants (константы)
Constants (константы)
Слайд 6Formulas for export, import, investments and final consumption (формулы для экспорта, импорта,
Formulas for export, import, investments and final consumption (формулы для экспорта, импорта,
Слайд 7Selection of parameters (подгонка параметров)
Employment (занятость)
L(t) = 10.66 *x0.5595 + 726.8 (14)
Selection of parameters (подгонка параметров)
Employment (занятость)
L(t) = 10.66 *x0.5595 + 726.8 (14)
Слайд 8Selection of parameters (подгонка параметров)
The relative price index for export (индекс относительных
Selection of parameters (подгонка параметров)
The relative price index for export (индекс относительных
Слайд 9Selection of parameters (подгонка параметров)
The relative price index for import (индекс относительных
Selection of parameters (подгонка параметров)
The relative price index for import (индекс относительных
Слайд 10Selection of parameters (подгонка параметров)
The relative price index for investments (индекс относительных
Selection of parameters (подгонка параметров)
The relative price index for investments (индекс относительных
Слайд 11Numerical implementation (численная реализация)
Numerical implementation (численная реализация)
Слайд 12Numerical implementation (численная реализация)
Numerical implementation (численная реализация)
Слайд 13The result of the identification of the model and graphics (результат идентификации
The result of the identification of the model and graphics (результат идентификации
Слайд 14estimated and statistic data for import and export (оцениваемые и статистические данные
estimated and statistic data for import and export (оцениваемые и статистические данные
Слайд 15estimated and statistic data for investments and final consumption (оцениваемые и статистические
estimated and statistic data for investments and final consumption (оцениваемые и статистические
Слайд 16Scenario experiments with the model (сценарные эксперименты с моделью)
Forecasting graphic of the
Scenario experiments with the model (сценарные эксперименты с моделью)
Forecasting graphic of the
Слайд 17Forecasting graphic of the relative index of prices for investments and employment
Forecasting graphic of the relative index of prices for investments and employment
Слайд 18The comparison of the basic (pessimistic) and the optimistic forecasts (сценарные эксперименты
The comparison of the basic (pessimistic) and the optimistic forecasts (сценарные эксперименты
Слайд 19Forecasting graphic of investments J(t) and export E(t) 2003-2023 (прогнозные графики для
Forecasting graphic of investments J(t) and export E(t) 2003-2023 (прогнозные графики для
Слайд 20Forecasting graphic of import I(t) and Q(t) 2003-2023 (прогнозные графики для экспорта
Forecasting graphic of import I(t) and Q(t) 2003-2023 (прогнозные графики для экспорта
 Архитектура Древней Руси 11-13 вв
 Презентация на тему Устное народное творчество
  «Вселенная в алфавитном порядке»
 Стресс… ( исцели себя)
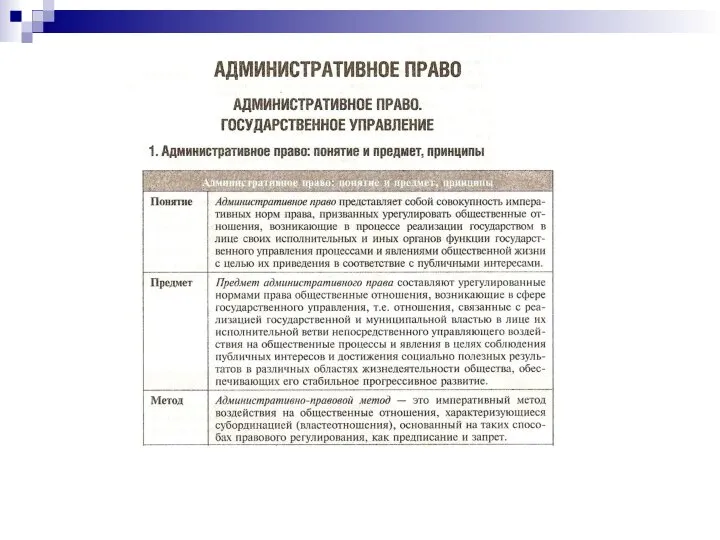 Административное право. (Тема 16)
 Русские народные музыкальные инструменты
 Проект по дисциплине Дизайн в сфере применения
 مفتش المدارس
 Говорите по-итальянски
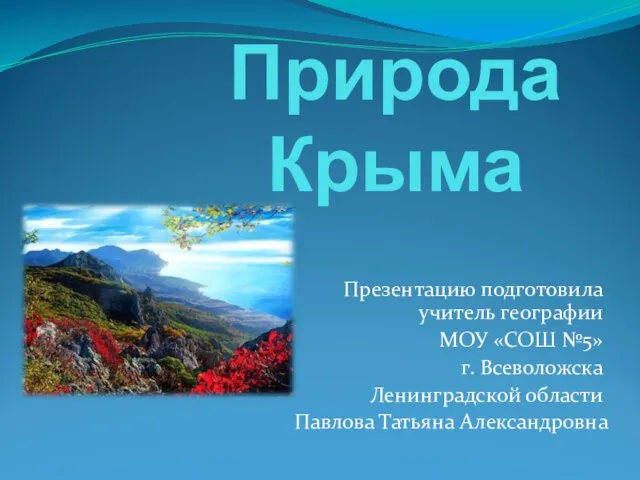 Презентация на тему Природа Крыма
  Русский символизм
 Выпускная квалификационная работа: Лимиты водоотведения на основе расчетов предельно допустимого сброса
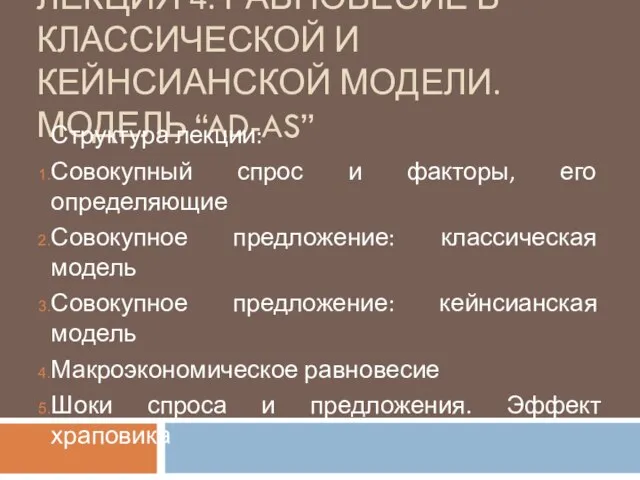 Равновесие в классической и кейнсианской модели
 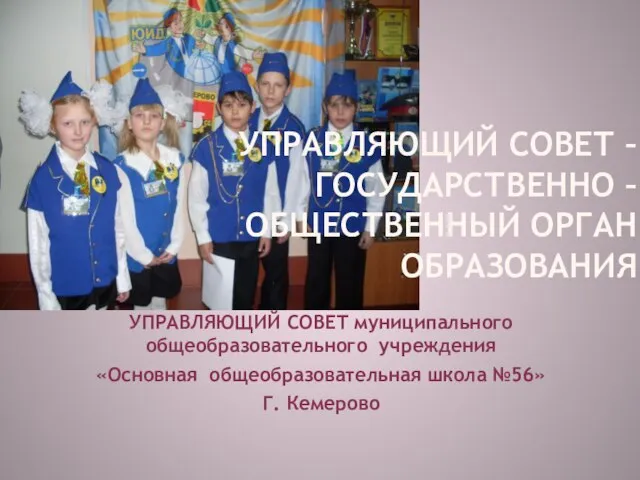 Управляющий совет –государственно – общественный орган образования
 Городские общественные пространства
 Технологии художественно-прикладной обработки материалов
 Руководство по летной эксплуатации вертолета Ми - 8. Расчет полета. Общие указания и исходные данные
 Презентация на тему Орфограммы наречий
 Проект «Парк-оберег»в ТСЖ «Север-2000»
 Герои - односельчане
 Архитектуры с параллелизмом на уровне команд
 Χωχαρουπα
 Организация учебно-научного сотрудничества с высшим учебным заведением
 Откуда на окнах берутся морозные узоры
 Организация научных исследований в области дошкольного образования
 Royal family
 Святые земли Вологодской
 Дорожное путешествие в КраеФест