- Capital badgeting

Содержание
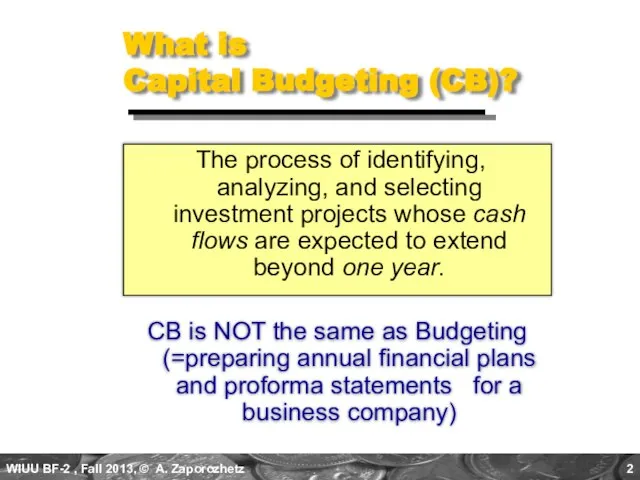
- 2. What is Capital Budgeting (CB)? The process of identifying, analyzing, and selecting investment projects whose cash
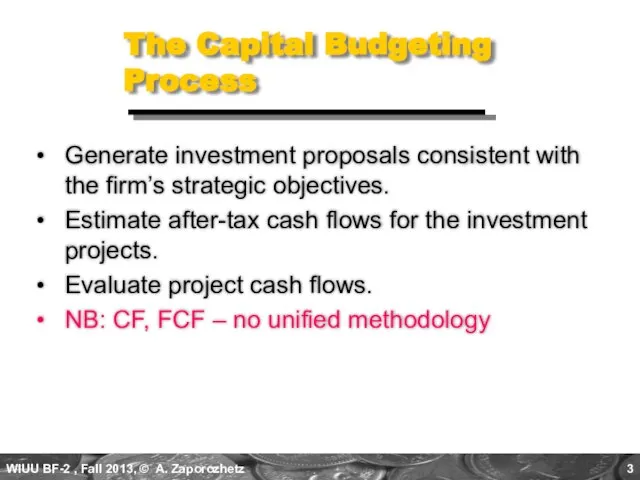
- 3. The Capital Budgeting Process Generate investment proposals consistent with the firm’s strategic objectives. Estimate after-tax cash
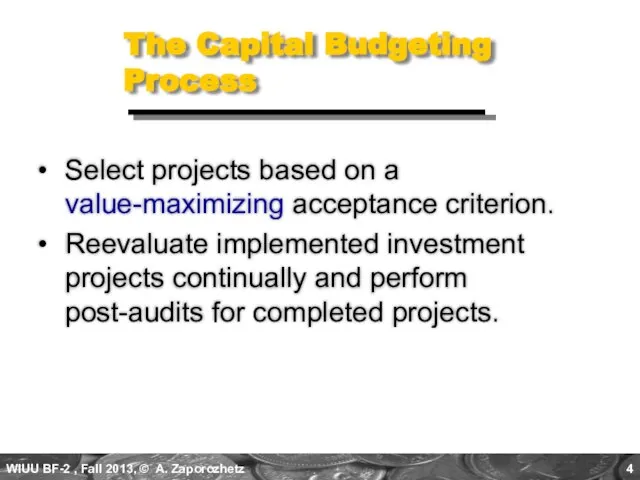
- 4. The Capital Budgeting Process Select projects based on a value-maximizing acceptance criterion. Reevaluate implemented investment projects
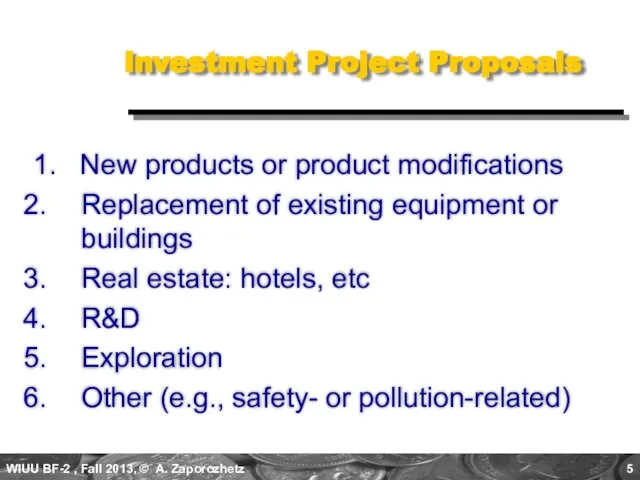
- 5. Investment Project Proposals 1. New products or product modifications Replacement of existing equipment or buildings Real
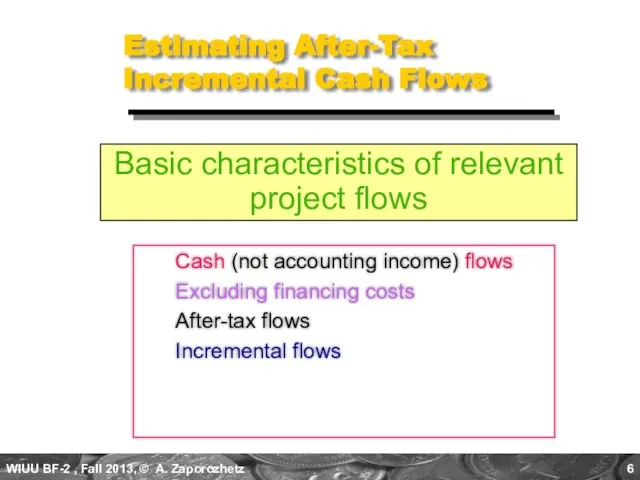
- 6. Estimating After-Tax Incremental Cash Flows Cash (not accounting income) flows Excluding financing costs After-tax flows Incremental
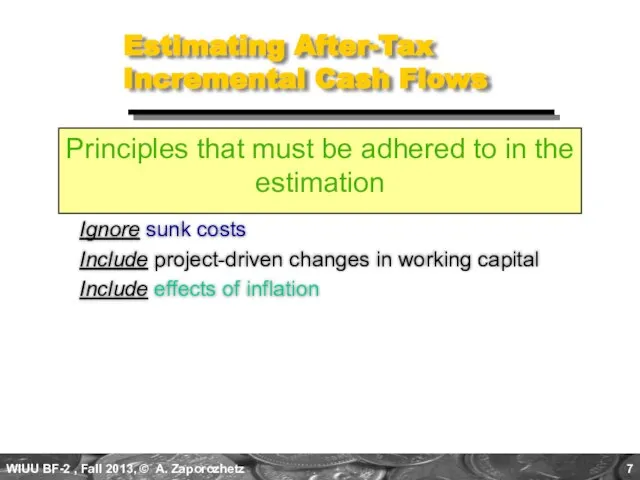
- 7. Estimating After-Tax Incremental Cash Flows Ignore sunk costs Include project-driven changes in working capital Include effects
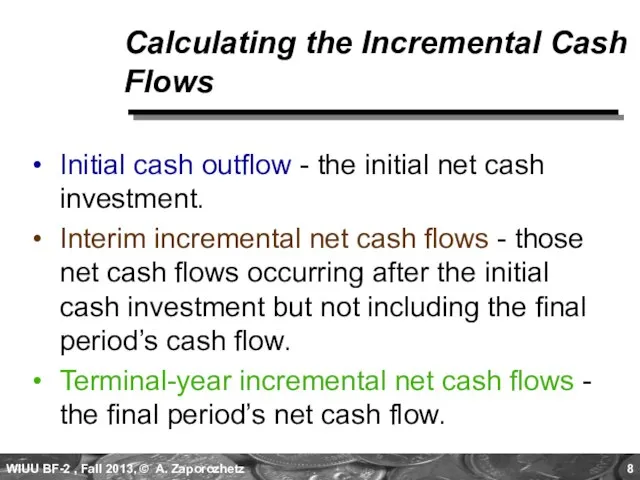
- 8. Calculating the Incremental Cash Flows Initial cash outflow - the initial net cash investment. Interim incremental
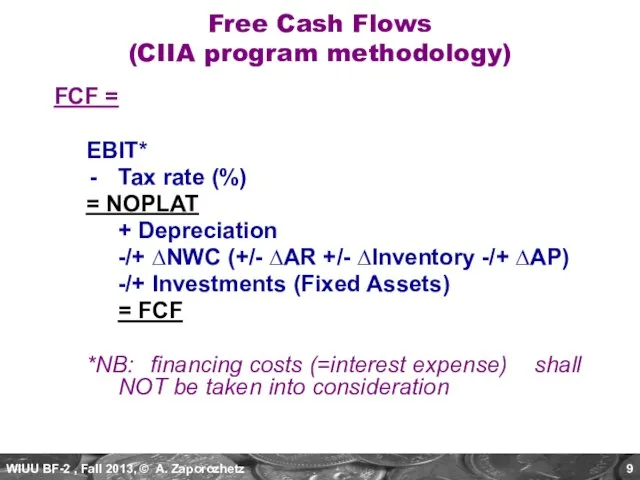
- 9. FCF = EBIT* Tax rate (%) = NOPLAT + Depreciation -/+ ∆NWC (+/- ∆AR +/- ∆Inventory
- 10. Initial Cash Outflow, ICO a) Cost of “new” assets b) + Capitalized expenditures c) + (-)
- 11. Terminal-Year Incremental Cash Flows a) Calculate the incremental net cash flow for the terminal period b)
- 12. Project Evaluation: Alternative Methods Payback Period (PBP) Discounted PBP (DPBP) Internal Rate of Return (IRR) Net
- 13. Proposed Project Data Julie is evaluating a new project for her firm, Basket Wonders (BW). She
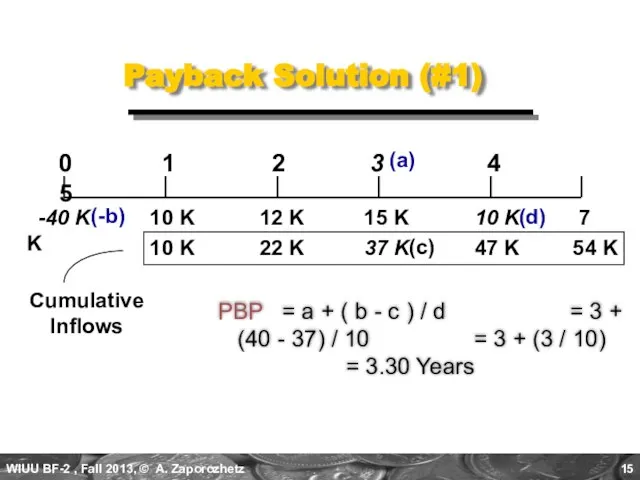
- 14. Payback Period (PBP) PBP is the period of time required for the cumulative expected cash flows
- 15. (c) 10 K 22 K 37 K 47 K 54 K Payback Solution (#1) PBP =
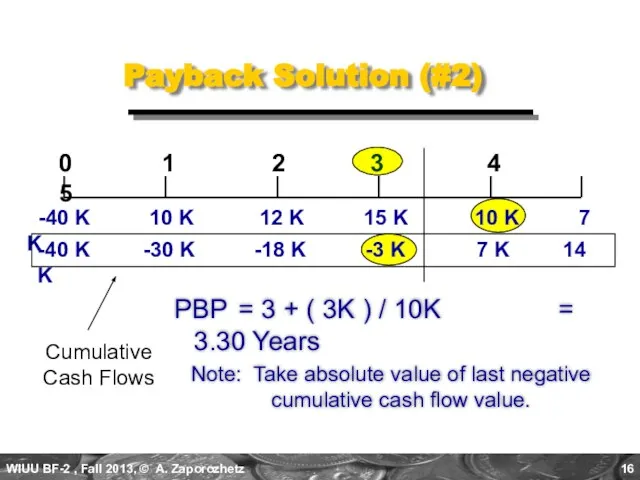
- 16. Payback Solution (#2) PBP = 3 + ( 3K ) / 10K = 3.30 Years Note:
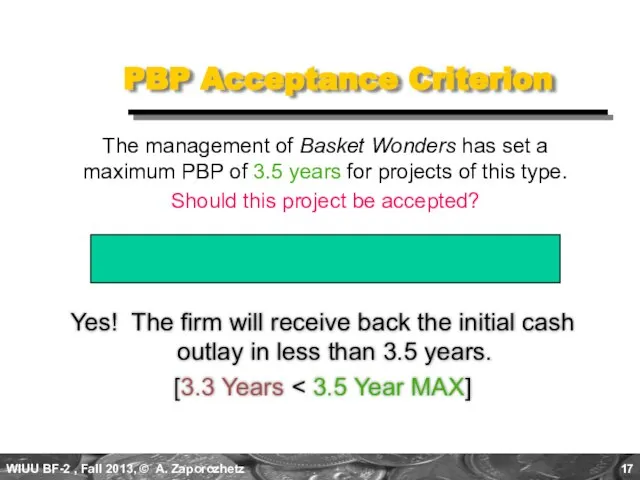
- 17. PBP Acceptance Criterion Yes! The firm will receive back the initial cash outlay in less than
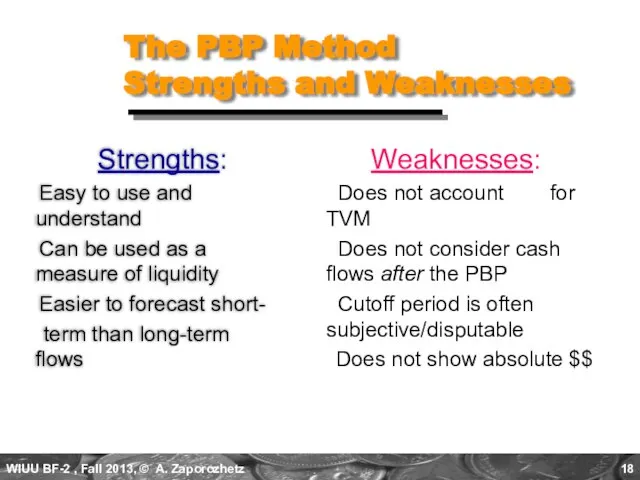
- 18. The PBP Method Strengths and Weaknesses Strengths: Easy to use and understand Can be used as
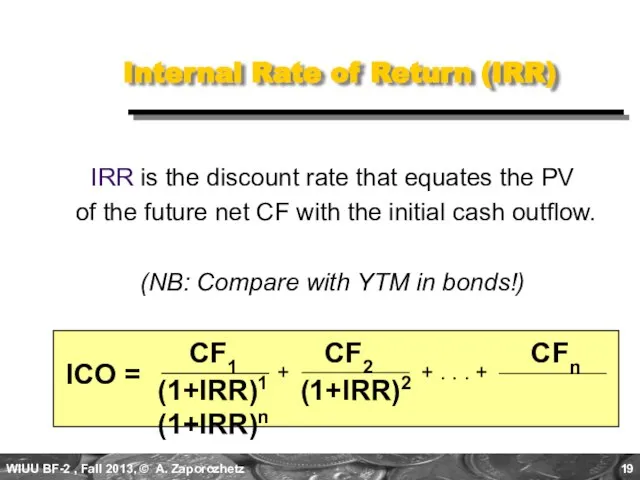
- 19. Internal Rate of Return (IRR) IRR is the discount rate that equates the PV of the
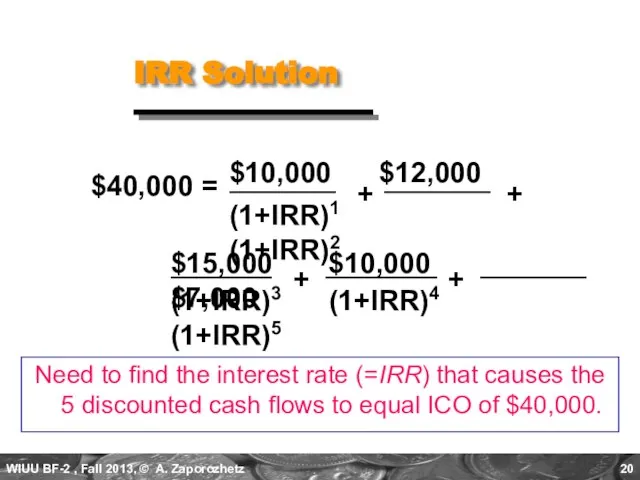
- 20. $15,000 $10,000 $7,000 IRR Solution $10,000 $12,000 (1+IRR)1 (1+IRR)2 Need to find the interest rate (=IRR)
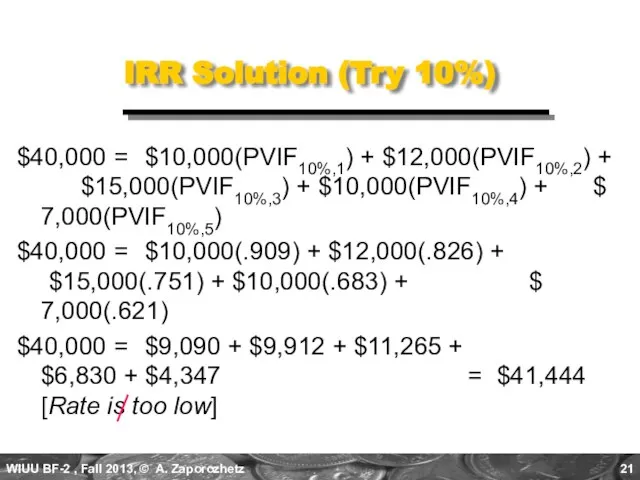
- 21. IRR Solution (Try 10%) $40,000 = $10,000(PVIF10%,1) + $12,000(PVIF10%,2) + $15,000(PVIF10%,3) + $10,000(PVIF10%,4) + $ 7,000(PVIF10%,5)
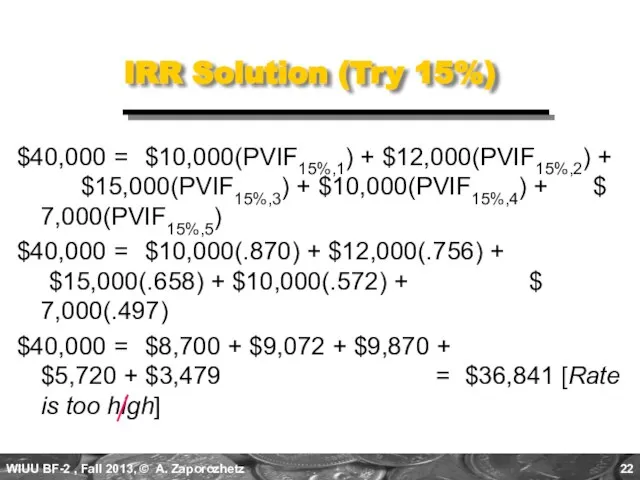
- 22. IRR Solution (Try 15%) $40,000 = $10,000(PVIF15%,1) + $12,000(PVIF15%,2) + $15,000(PVIF15%,3) + $10,000(PVIF15%,4) + $ 7,000(PVIF15%,5)
- 23. 0.10 $41,444 0.05 IRR $40,000 $4,603 0.15 $36,841 X $1,444 0.05 $4,603 IRR Solution (Interpolate) $1,444
- 24. .10 $41,444 .05 IRR $40,000 $4,603 .15 $36,841 X $1,444 .05 $4,603 IRR Solution (Interpolate) $1,444
- 25. 0.10 $41,444 0.05 IRR $40,000 $4,603 0.15 $36,841 ($1,444)(0.05) $4,603 IRR Solution (Interpolate) $1,444 X X
- 26. IRR Acceptance Criterion No! The firm will “receive” 11.57% for each dollar “required” for this project
- 27. IRR Strengths and Weaknesses Strengths: Accounts for TVM Considers all the cash flows Less subjectivity Weaknesses:
- 28. Net Present Value (NPV) NPV is the present value of an investment project’s net DCFs minus
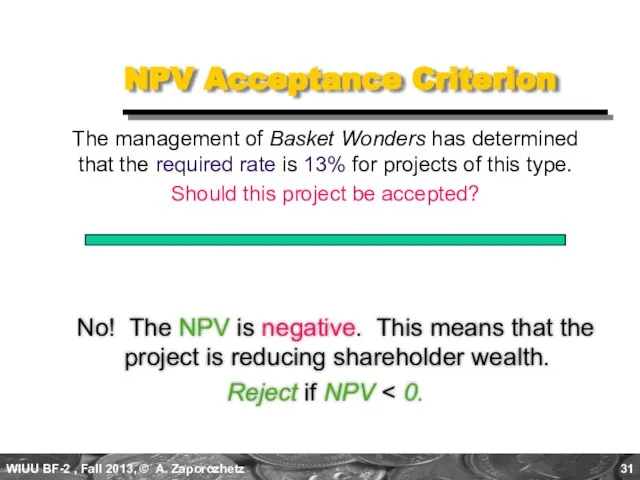
- 29. Basket Wonders has determined that the appropriate discount rate (k) for this project is 13%. $10,000
- 30. NPV Solution NPV = $10,000(PVIF13%,1) + $12,000(PVIF13%,2) + $15,000(PVIF13%,3) + $10,000(PVIF13%,4) + $ 7,000(PVIF13%,5) - $40,000
- 31. NPV Acceptance Criterion No! The NPV is negative. This means that the project is reducing shareholder
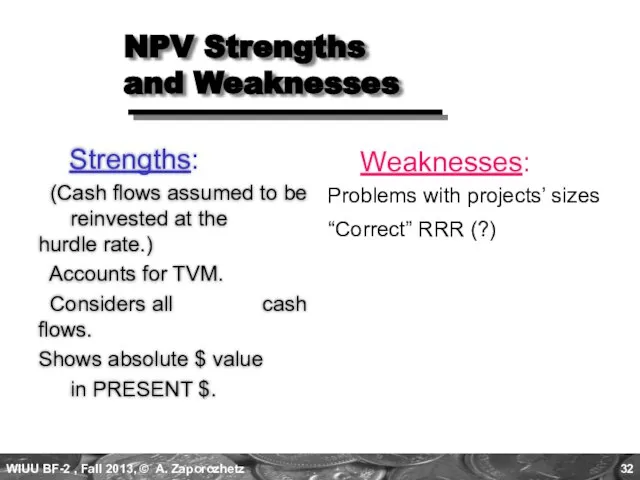
- 32. NPV Strengths and Weaknesses Strengths: (Cash flows assumed to be reinvested at the hurdle rate.) Accounts
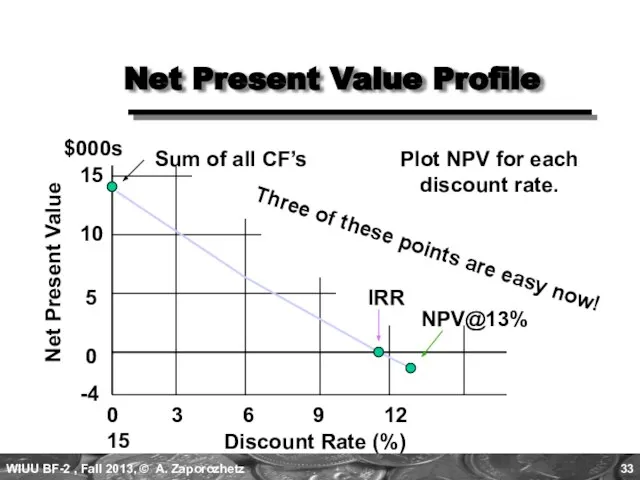
- 33. Net Present Value Profile Discount Rate (%) 0 3 6 9 12 15 IRR NPV@13% Sum
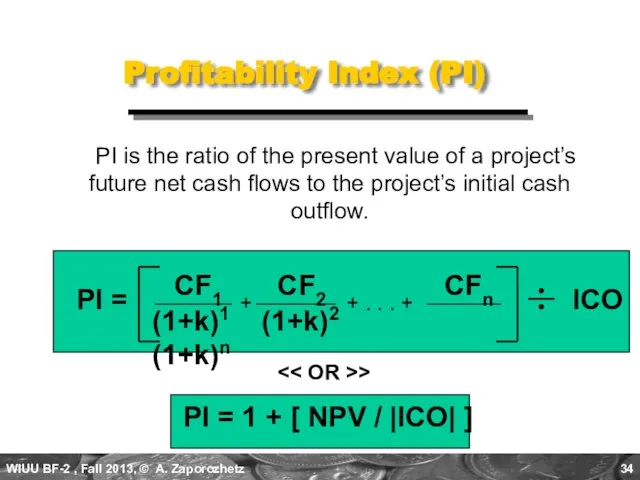
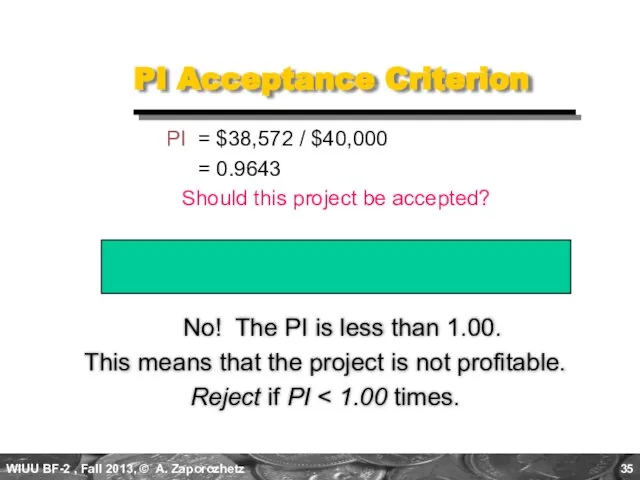
- 34. Profitability Index (PI) PI is the ratio of the present value of a project’s future net
- 35. PI Acceptance Criterion No! The PI is less than 1.00. This means that the project is
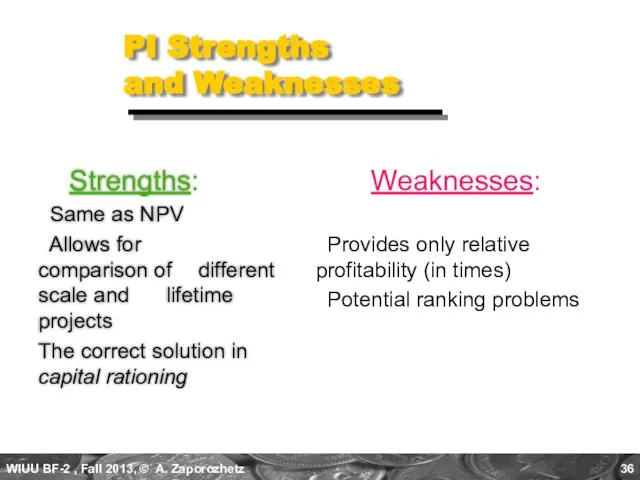
- 36. PI Strengths and Weaknesses Strengths: Same as NPV Allows for comparison of different scale and lifetime
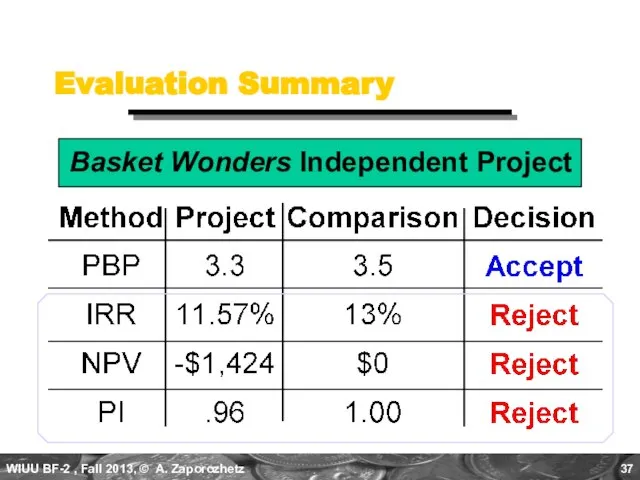
- 37. Evaluation Summary Basket Wonders Independent Project
- 38. Other Project Relationships Mutually Exclusive - A project whose acceptance precludes the acceptance of one or
- 39. Potential Problems Under Mutual Exclusivity A. Scale of Investment B. Cash-flow Pattern C. Project Life Ranking
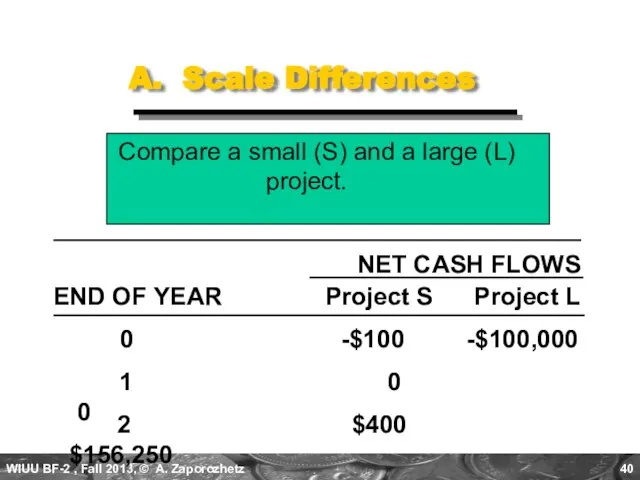
- 40. A. Scale Differences Compare a small (S) and a large (L) project. NET CASH FLOWS Project
- 41. A. Scale Differences Calculate the PBP, IRR, NPV@10%, and PI@10%. Which project is preferred? Why? Project
- 42. B. Cash Flow Pattern Let us compare a decreasing cash-flow (D) project and an increasing cash-flow
- 43. D 23% $197 1.16 I 17% $198 1.17 Cash Flow Pattern Calculate the IRR, NPV@10%, and
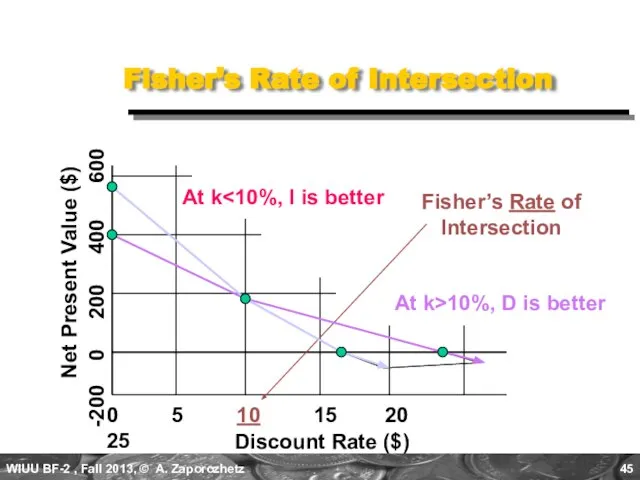
- 44. Examine NPV Profiles Discount Rate (%) 0 5 10 15 20 25 -200 0 200 400
- 45. Fisher’s Rate of Intersection Discount Rate ($) 0 5 10 15 20 25 -200 0 200
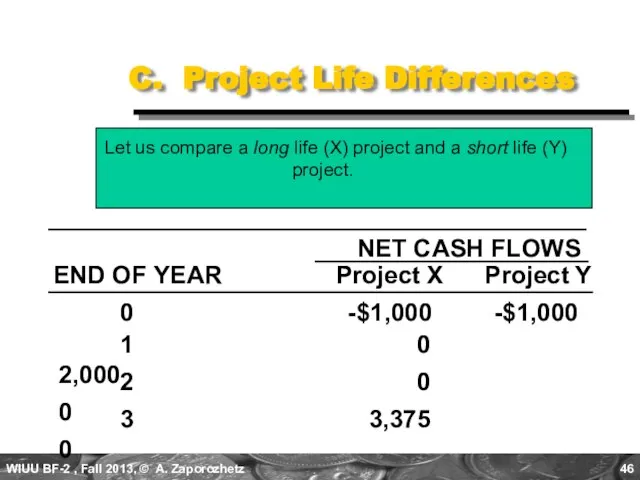
- 46. C. Project Life Differences Let us compare a long life (X) project and a short life
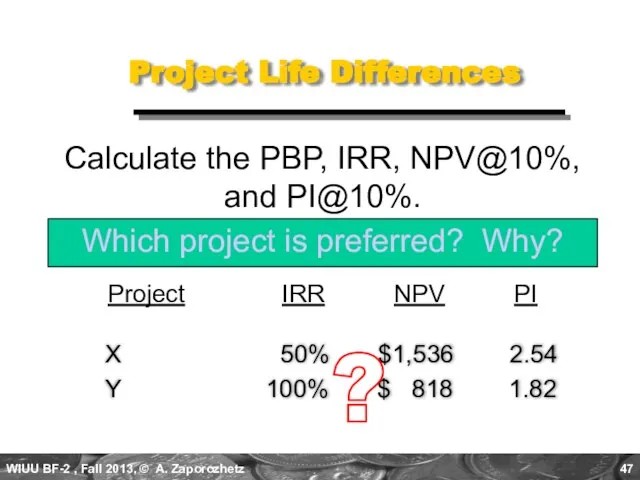
- 47. X 50% $1,536 2.54 Y 100% $ 818 1.82 Project Life Differences Calculate the PBP, IRR,
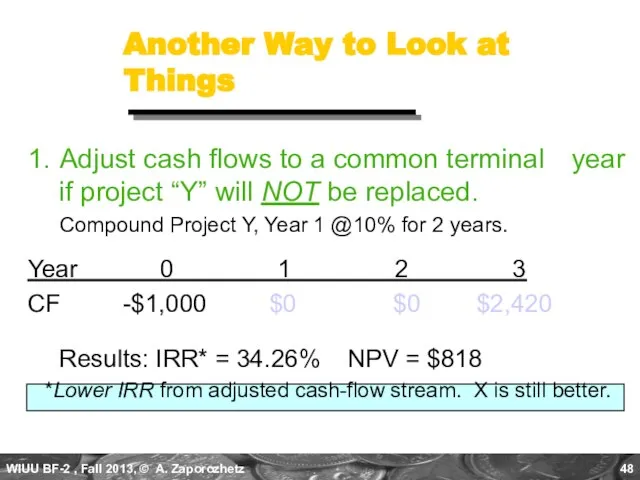
- 48. Another Way to Look at Things 1. Adjust cash flows to a common terminal year if
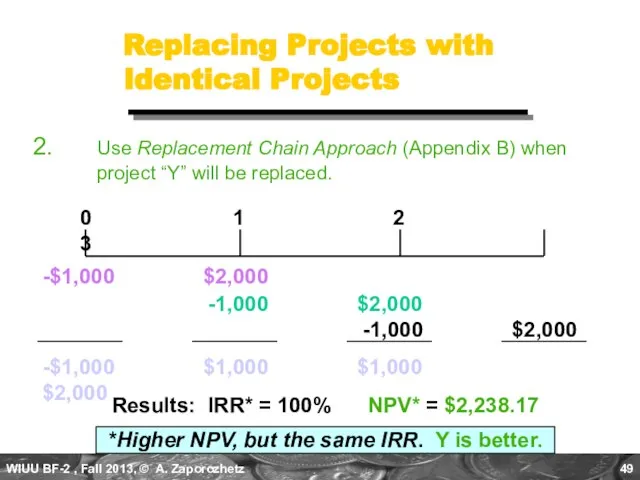
- 49. Replacing Projects with Identical Projects 2. Use Replacement Chain Approach (Appendix B) when project “Y” will
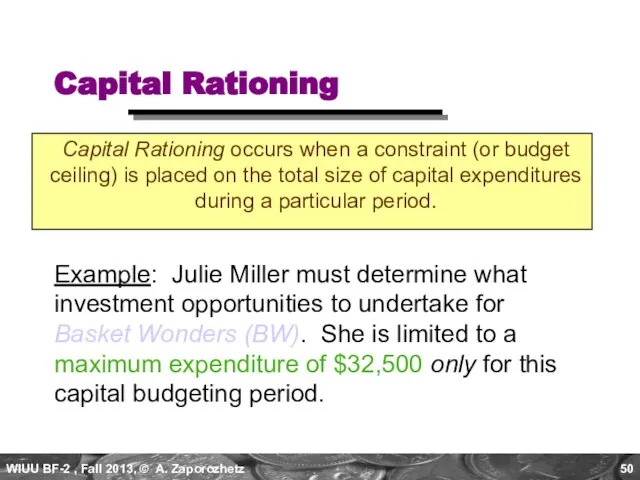
- 50. Capital Rationing Capital Rationing occurs when a constraint (or budget ceiling) is placed on the total
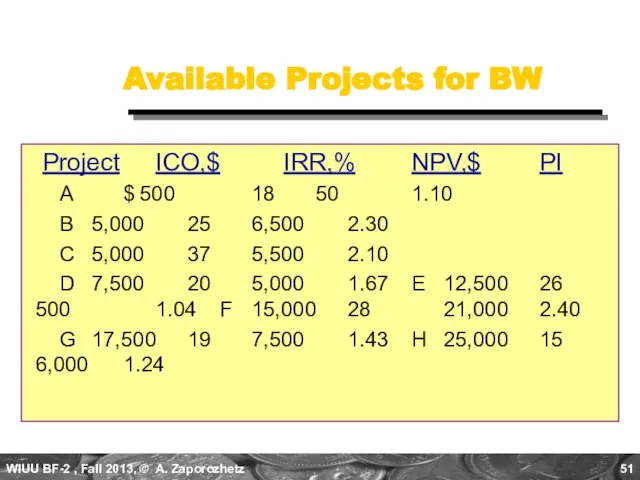
- 51. Available Projects for BW Project ICO,$ IRR,% NPV,$ PI A $ 500 18 50 1.10 B
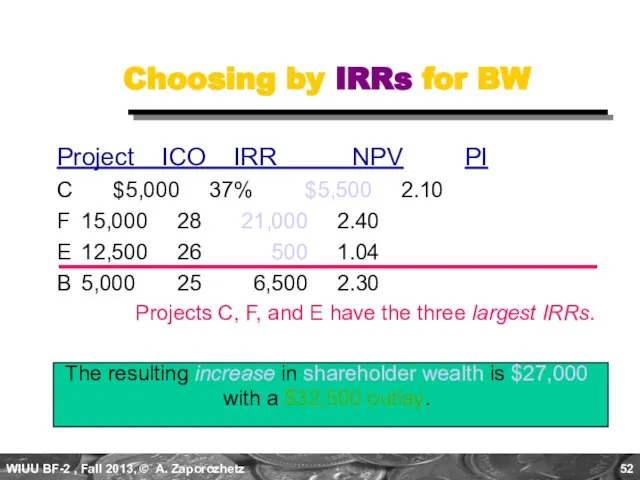
- 52. Choosing by IRRs for BW Project ICO IRR NPV PI C $5,000 37% $5,500 2.10 F
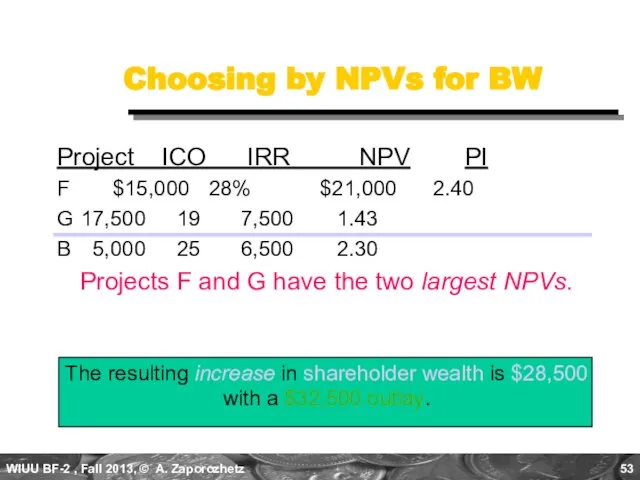
- 53. Choosing by NPVs for BW Project ICO IRR NPV PI F $15,000 28% $21,000 2.40 G
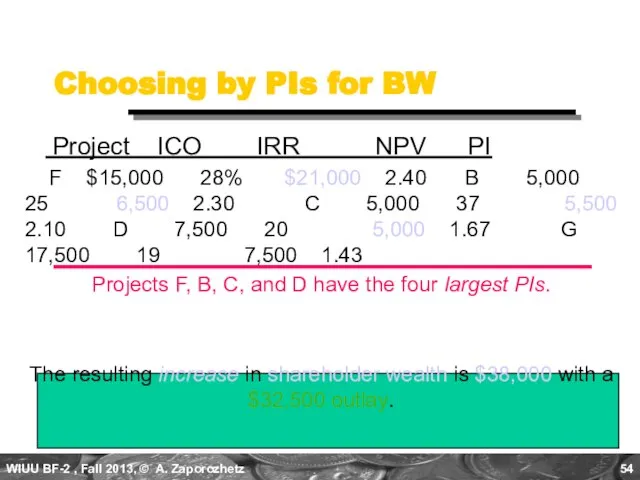
- 54. Choosing by PIs for BW Project ICO IRR NPV PI F $15,000 28% $21,000 2.40 B
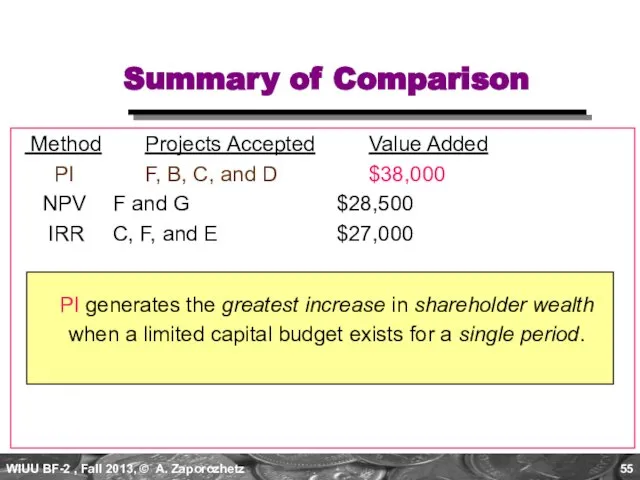
- 55. Summary of Comparison Method Projects Accepted Value Added PI F, B, C, and D $38,000 NPV
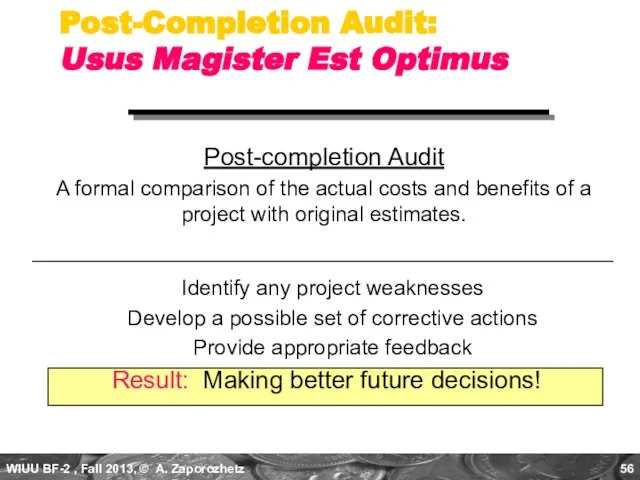
- 56. Post-Completion Audit: Usus Magister Est Optimus Post-completion Audit A formal comparison of the actual costs and
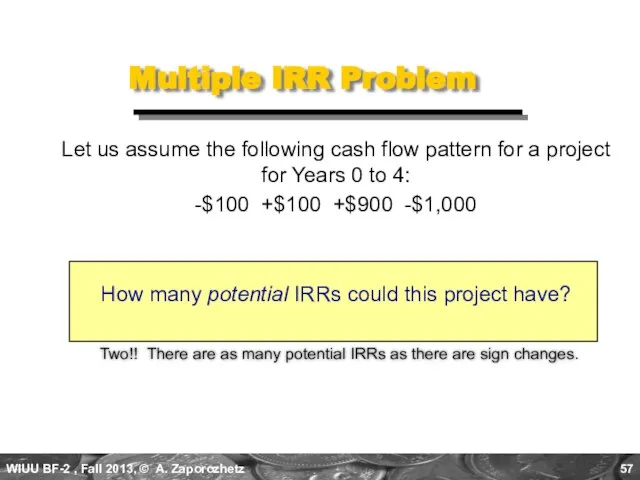
- 57. Multiple IRR Problem Two!! There are as many potential IRRs as there are sign changes. Let
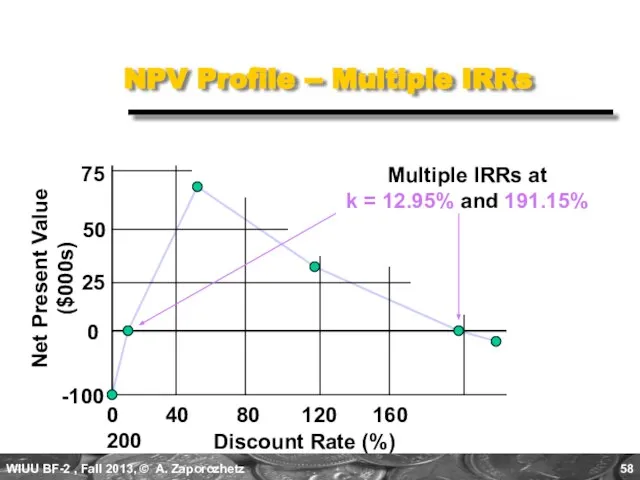
- 58. NPV Profile -- Multiple IRRs Discount Rate (%) 0 40 80 120 160 200 Net Present
- 60. Скачать презентацию
Слайд 3The Capital Budgeting Process
Generate investment proposals consistent with the firm’s strategic objectives.
Estimate
The Capital Budgeting Process
Generate investment proposals consistent with the firm’s strategic objectives.
Estimate
Слайд 4The Capital Budgeting Process
Select projects based on a value-maximizing acceptance criterion.
Reevaluate implemented
The Capital Budgeting Process
Select projects based on a value-maximizing acceptance criterion.
Reevaluate implemented
Слайд 5Investment Project Proposals
1. New products or product modifications
Replacement of existing equipment or
Investment Project Proposals
1. New products or product modifications
Replacement of existing equipment or
Слайд 6Estimating After-Tax Incremental Cash Flows
Cash (not accounting income) flows
Excluding financing costs
After-tax flows
Incremental
Estimating After-Tax Incremental Cash Flows
Cash (not accounting income) flows
Excluding financing costs
After-tax flows
Incremental
Слайд 7Estimating After-Tax Incremental Cash Flows
Ignore sunk costs
Include project-driven changes in working capital
Estimating After-Tax Incremental Cash Flows
Ignore sunk costs
Include project-driven changes in working capital
Слайд 8Calculating the Incremental Cash Flows
Initial cash outflow - the initial net cash
Calculating the Incremental Cash Flows
Initial cash outflow - the initial net cash
Слайд 9FCF =
EBIT*
Tax rate (%)
= NOPLAT
+ Depreciation
-/+ ∆NWC (+/- ∆AR +/-
FCF =
EBIT*
Tax rate (%)
= NOPLAT
+ Depreciation
-/+ ∆NWC (+/- ∆AR +/-
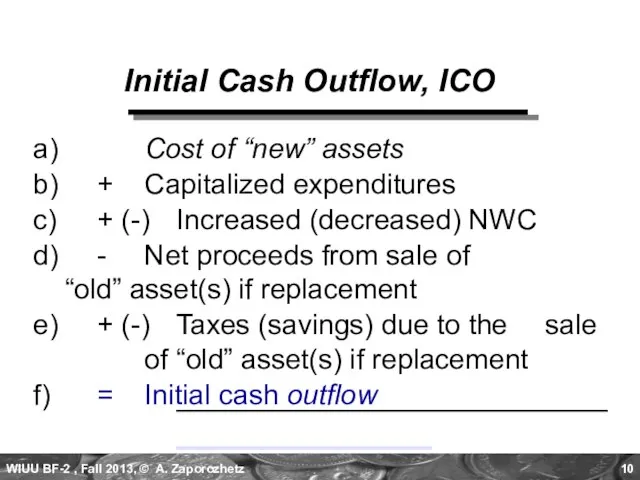
Слайд 10Initial Cash Outflow, ICO
a) Cost of “new” assets
b) + Capitalized expenditures
c) + (-) Increased
Initial Cash Outflow, ICO
a) Cost of “new” assets
b) + Capitalized expenditures
c) + (-) Increased
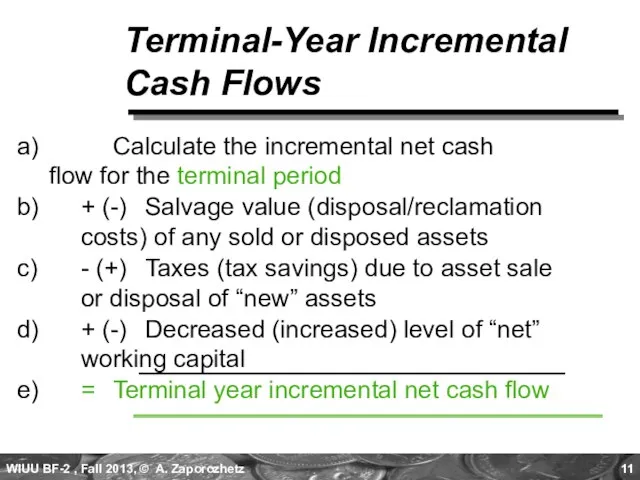
Слайд 11Terminal-Year Incremental Cash Flows
a) Calculate the incremental net cash flow for the
Terminal-Year Incremental Cash Flows
a) Calculate the incremental net cash flow for the
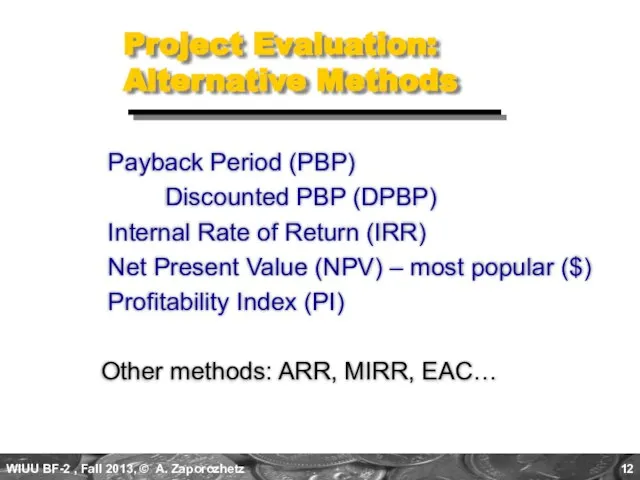
Слайд 12Project Evaluation: Alternative Methods
Payback Period (PBP)
Discounted PBP (DPBP)
Internal Rate
Project Evaluation: Alternative Methods
Payback Period (PBP)
Discounted PBP (DPBP)
Internal Rate
Слайд 13Proposed Project Data
Julie is evaluating a new project for her firm,
Proposed Project Data
Julie is evaluating a new project for her firm,

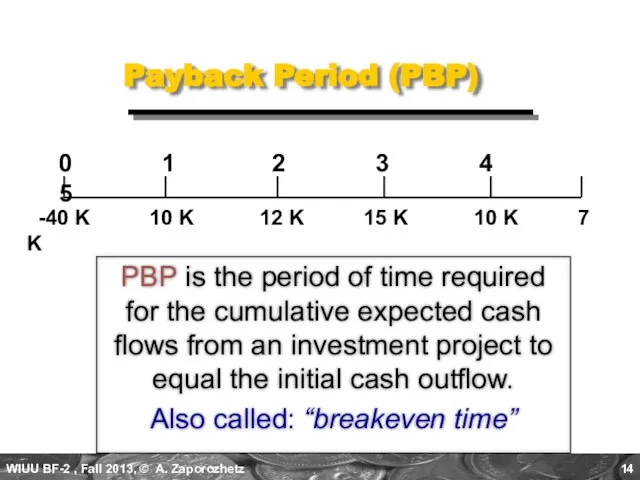
Слайд 14Payback Period (PBP)
PBP is the period of time required for the cumulative
Payback Period (PBP)
PBP is the period of time required for the cumulative
Слайд 15(c)
10 K 22 K 37 K 47 K 54 K
Payback Solution (#1)
PBP
(c)
10 K 22 K 37 K 47 K 54 K
Payback Solution (#1)
PBP
Слайд 16Payback Solution (#2)
PBP = 3 + ( 3K ) / 10K = 3.30
Payback Solution (#2)
PBP = 3 + ( 3K ) / 10K = 3.30
Слайд 17PBP Acceptance Criterion
Yes! The firm will receive back the initial cash outlay
PBP Acceptance Criterion
Yes! The firm will receive back the initial cash outlay
Слайд 18The PBP Method
Strengths and Weaknesses
Strengths:
Easy to use and understand
Can
The PBP Method
Strengths and Weaknesses
Strengths:
Easy to use and understand
Can
Слайд 19Internal Rate of Return (IRR)
IRR is the discount rate that equates the
Internal Rate of Return (IRR)
IRR is the discount rate that equates the
Слайд 20$15,000 $10,000 $7,000
IRR Solution
$10,000 $12,000
(1+IRR)1 (1+IRR)2
Need to find the interest rate
$15,000 $10,000 $7,000
IRR Solution
$10,000 $12,000
(1+IRR)1 (1+IRR)2
Need to find the interest rate
Слайд 21IRR Solution (Try 10%)
$40,000 = $10,000(PVIF10%,1) + $12,000(PVIF10%,2) + $15,000(PVIF10%,3) + $10,000(PVIF10%,4) +
IRR Solution (Try 10%)
$40,000 = $10,000(PVIF10%,1) + $12,000(PVIF10%,2) + $15,000(PVIF10%,3) + $10,000(PVIF10%,4) +
Слайд 22IRR Solution (Try 15%)
$40,000 = $10,000(PVIF15%,1) + $12,000(PVIF15%,2) + $15,000(PVIF15%,3) + $10,000(PVIF15%,4)
IRR Solution (Try 15%)
$40,000 = $10,000(PVIF15%,1) + $12,000(PVIF15%,2) + $15,000(PVIF15%,3) + $10,000(PVIF15%,4)
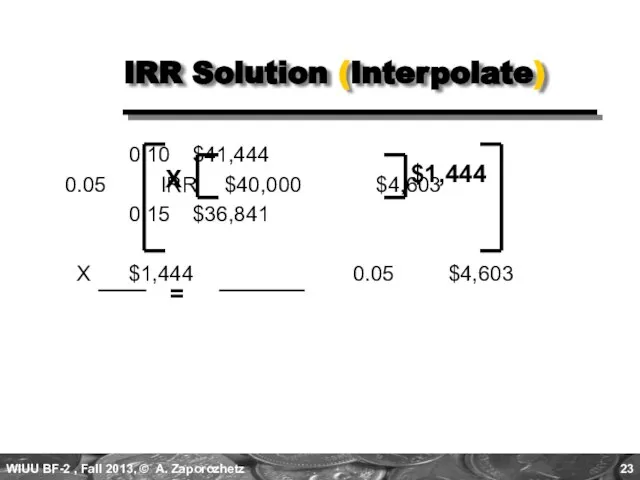
Слайд 23 0.10 $41,444
0.05 IRR $40,000 $4,603
0.15 $36,841
X $1,444 0.05 $4,603
IRR Solution (Interpolate)
$1,444
X
=
0.10 $41,444
0.05 IRR $40,000 $4,603
0.15 $36,841
X $1,444 0.05 $4,603
IRR Solution (Interpolate)
$1,444
X
=
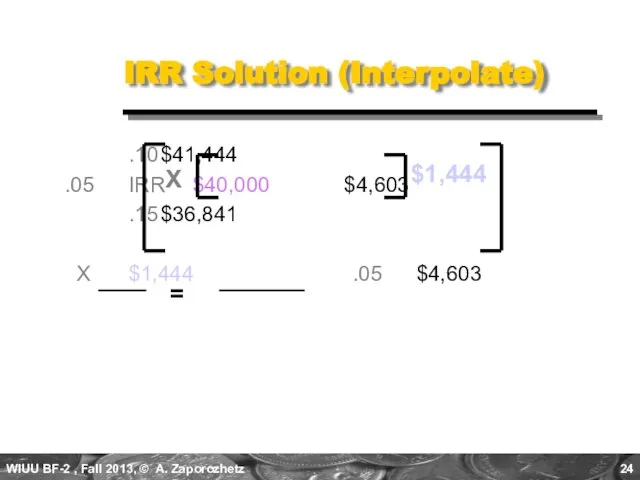
Слайд 24 .10 $41,444
.05 IRR $40,000 $4,603
.15 $36,841
X $1,444 .05 $4,603
IRR Solution (Interpolate)
$1,444
X
=
.10 $41,444
.05 IRR $40,000 $4,603
.15 $36,841
X $1,444 .05 $4,603
IRR Solution (Interpolate)
$1,444
X
=
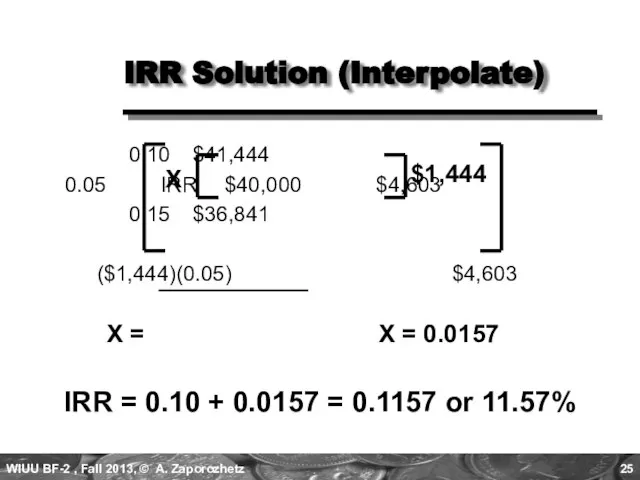
Слайд 25 0.10 $41,444
0.05 IRR $40,000 $4,603
0.15 $36,841
($1,444)(0.05) $4,603
IRR Solution (Interpolate)
$1,444
X
X =
X = 0.0157
IRR = 0.10 + 0.0157
0.10 $41,444
0.05 IRR $40,000 $4,603
0.15 $36,841
($1,444)(0.05) $4,603
IRR Solution (Interpolate)
$1,444
X
X =
X = 0.0157
IRR = 0.10 + 0.0157
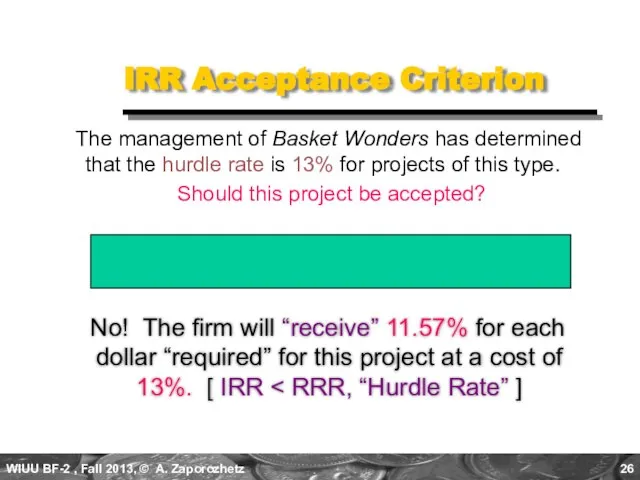
Слайд 26IRR Acceptance Criterion
No! The firm will “receive” 11.57% for each dollar
IRR Acceptance Criterion
No! The firm will “receive” 11.57% for each dollar
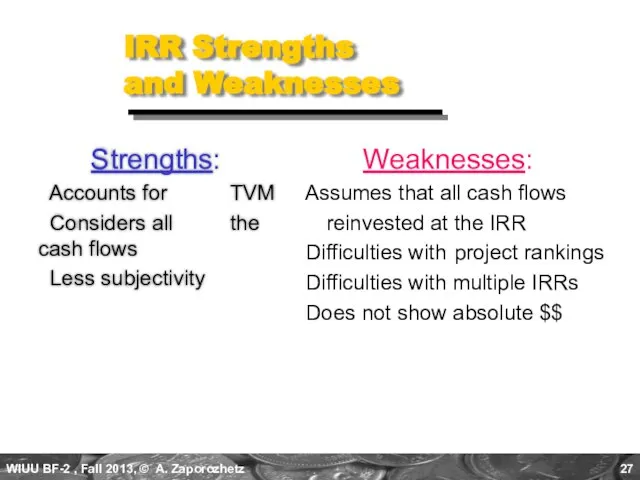
Слайд 27IRR Strengths
and Weaknesses
Strengths:
Accounts for TVM
Considers all the
IRR Strengths
and Weaknesses
Strengths:
Accounts for TVM
Considers all the
Слайд 28Net Present Value (NPV)
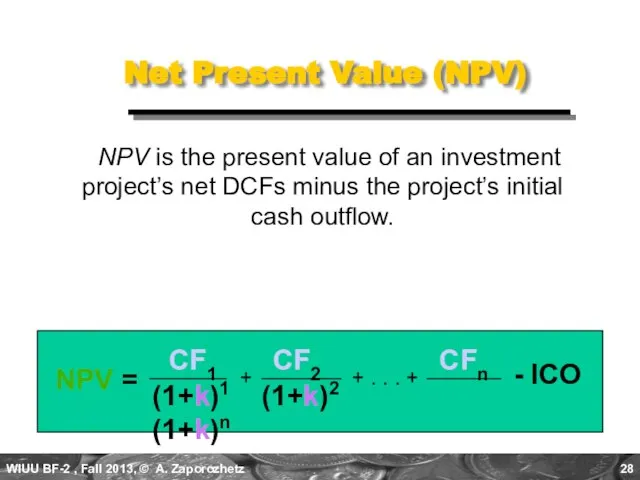
NPV is the present value of an investment
Net Present Value (NPV)
NPV is the present value of an investment
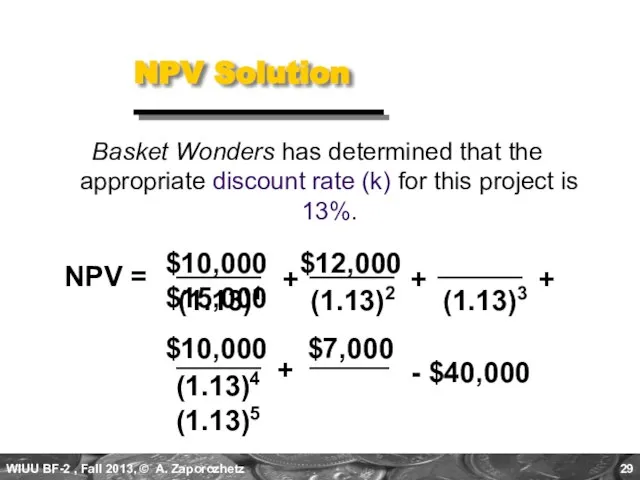
Слайд 29Basket Wonders has determined that the appropriate discount rate (k) for this
Basket Wonders has determined that the appropriate discount rate (k) for this
Слайд 30NPV Solution
NPV = $10,000(PVIF13%,1) + $12,000(PVIF13%,2) + $15,000(PVIF13%,3) + $10,000(PVIF13%,4) + $
NPV Solution
NPV = $10,000(PVIF13%,1) + $12,000(PVIF13%,2) + $15,000(PVIF13%,3) + $10,000(PVIF13%,4) + $
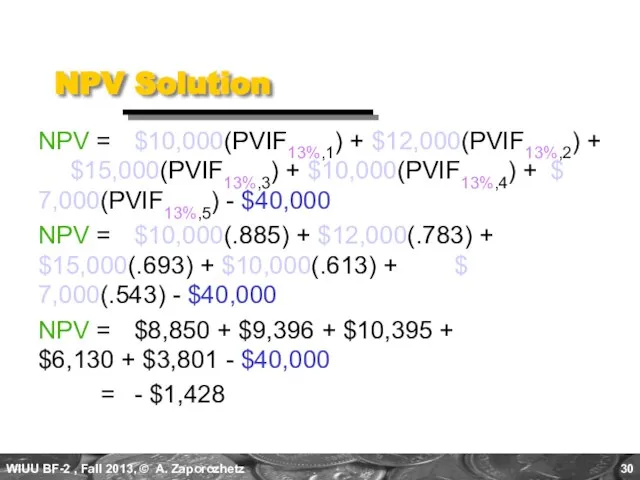
Слайд 31NPV Acceptance Criterion
No! The NPV is negative. This means that the
NPV Acceptance Criterion
No! The NPV is negative. This means that the
Слайд 32NPV Strengths
and Weaknesses
Strengths:
(Cash flows assumed to be reinvested at
NPV Strengths
and Weaknesses
Strengths:
(Cash flows assumed to be reinvested at
Слайд 33Net Present Value Profile
Discount Rate (%)
0 3 6 9 12 15
IRR
NPV@13%
Sum of
Net Present Value Profile
Discount Rate (%)
0 3 6 9 12 15
IRR
NPV@13%
Sum of
Слайд 34Profitability Index (PI)
PI is the ratio of the present value of
Profitability Index (PI)
PI is the ratio of the present value of
Слайд 35 PI Acceptance Criterion
No! The PI is less than 1.00.
This
PI Acceptance Criterion
No! The PI is less than 1.00.
This
Слайд 36PI Strengths
and Weaknesses
Strengths:
Same as NPV
Allows for comparison of
PI Strengths
and Weaknesses
Strengths:
Same as NPV
Allows for comparison of
Слайд 37Evaluation Summary
Basket Wonders Independent Project
Evaluation Summary
Basket Wonders Independent Project
Слайд 38Other Project Relationships
Mutually Exclusive - A project whose acceptance precludes the acceptance
Other Project Relationships
Mutually Exclusive - A project whose acceptance precludes the acceptance

Слайд 39Potential Problems
Under Mutual Exclusivity
A. Scale of Investment
B. Cash-flow Pattern
C. Project Life
Potential Problems
Under Mutual Exclusivity
A. Scale of Investment
B. Cash-flow Pattern
C. Project Life

Слайд 40A. Scale Differences
Compare a small (S) and a large (L) project.
NET
A. Scale Differences
Compare a small (S) and a large (L) project.
NET
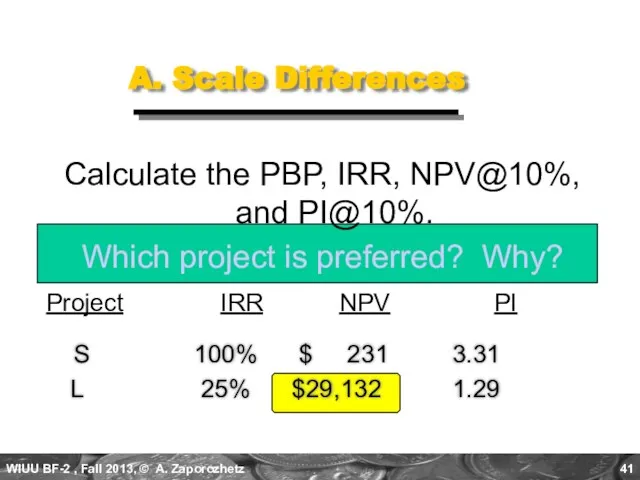
Слайд 41A. Scale Differences
Calculate the PBP, IRR, NPV@10%, and PI@10%.
Which project is preferred?
A. Scale Differences
Calculate the PBP, IRR, NPV@10%, and PI@10%.
Which project is preferred?
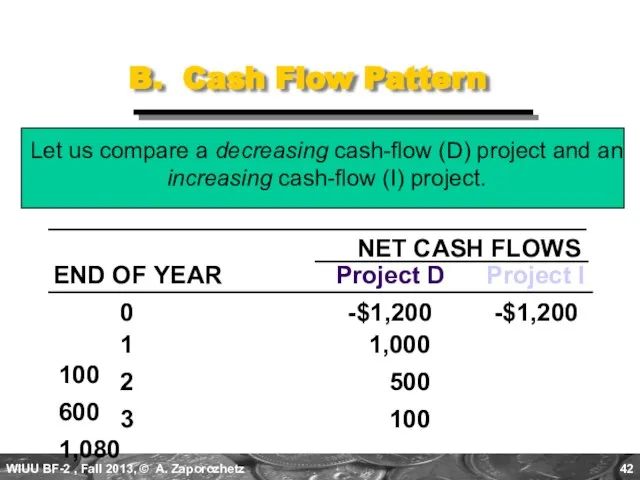
Слайд 42B. Cash Flow Pattern
Let us compare a decreasing cash-flow (D) project and
B. Cash Flow Pattern
Let us compare a decreasing cash-flow (D) project and
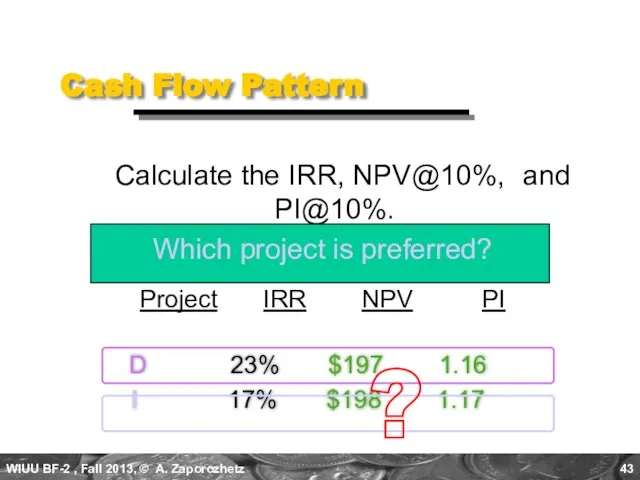
Слайд 43 D 23% $197 1.16
I 17% $198 1.17
Cash Flow Pattern
Calculate
D 23% $197 1.16
I 17% $198 1.17
Cash Flow Pattern
Calculate
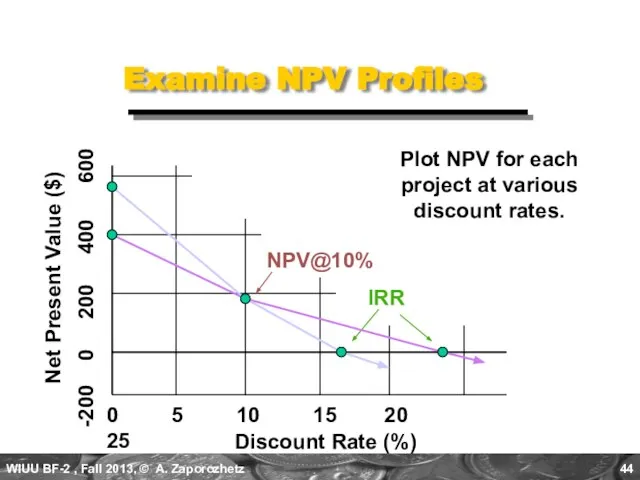
Слайд 44Examine NPV Profiles
Discount Rate (%)
0 5 10 15 20 25
-200 0 200
Examine NPV Profiles
Discount Rate (%)
0 5 10 15 20 25
-200 0 200
Слайд 45Fisher’s Rate of Intersection
Discount Rate ($)
0 5 10 15 20 25
-200 0
Fisher’s Rate of Intersection
Discount Rate ($)
0 5 10 15 20 25
-200 0
Слайд 46C. Project Life Differences
Let us compare a long life (X) project
C. Project Life Differences
Let us compare a long life (X) project
Слайд 47 X 50% $1,536 2.54
Y 100% $ 818 1.82
Project Life Differences
Calculate
X 50% $1,536 2.54
Y 100% $ 818 1.82
Project Life Differences
Calculate
Слайд 48Another Way to Look at Things
1. Adjust cash flows to a common terminal
Another Way to Look at Things
1. Adjust cash flows to a common terminal
Слайд 49Replacing Projects with Identical Projects
2. Use Replacement Chain Approach (Appendix B) when project
Replacing Projects with Identical Projects
2. Use Replacement Chain Approach (Appendix B) when project
Слайд 50Capital Rationing
Capital Rationing occurs when a constraint (or budget ceiling) is placed
Capital Rationing
Capital Rationing occurs when a constraint (or budget ceiling) is placed
Слайд 51Available Projects for BW
Project ICO,$ IRR,% NPV,$ PI
A $ 500 18
Available Projects for BW
Project ICO,$ IRR,% NPV,$ PI
A $ 500 18
Слайд 52Choosing by IRRs for BW
Project ICO IRR NPV PI
C $5,000 37% $5,500 2.10
Choosing by IRRs for BW
Project ICO IRR NPV PI
C $5,000 37% $5,500 2.10
Слайд 53Choosing by NPVs for BW
Project ICO IRR NPV PI
F $15,000 28% $21,000
Choosing by NPVs for BW
Project ICO IRR NPV PI
F $15,000 28% $21,000
Слайд 54Choosing by PIs for BW
Project ICO IRR NPV PI
F $15,000
Choosing by PIs for BW
Project ICO IRR NPV PI
F $15,000
Слайд 55Summary of Comparison
Method Projects Accepted Value Added
PI F, B, C,
Summary of Comparison
Method Projects Accepted Value Added
PI F, B, C,
Слайд 56Post-Completion Audit:
Usus Magister Est Optimus
Post-completion Audit
A formal comparison of the actual
Post-Completion Audit:
Usus Magister Est Optimus
Post-completion Audit
A formal comparison of the actual
Слайд 57Multiple IRR Problem
Two!! There are as many potential IRRs as there
Multiple IRR Problem
Two!! There are as many potential IRRs as there
Слайд 58NPV Profile -- Multiple IRRs
Discount Rate (%)
0 40 80 120 160 200
Net
NPV Profile -- Multiple IRRs
Discount Rate (%)
0 40 80 120 160 200
Net
 Папка проведение ВВ
 Загадка карты
 Разработка модифицированной (авторизованной) учебной программы
 Можно ли верить рекламе?
 Многослойное стекло в технике Галле, Императорского стеклянного завода
 Теория обучения (Дидактика)
  ХУДОЖЕСТВЕННОЕ ОФОРМЛЕНИЕ МАГИЧЕСКИХ РИТУАЛОВ И ОБРЯДОВ
 10
10 Будущее доменных имен
 Иллюстрации к стихам Агнии Львовны Барто
 По морю, по океану
 Ярмарка инноваций в образовании Секция: Инновации в дошкольном образовании
 شرحةأسماء الإشارة بالصوت 2
 Образовательный процесс в условиях инновационного развития вуза
 в 20 школе
 Деньги–оплатники. Фальшивые деньги – ложники
 Презентация к уроку русского языка в 3 классе на тему: «Текст. Закрепление»
 Дәріс №9
 Жилетки. Турнир на кубок микрорайона
 Имидж сотрудников. Стиль, карьера и красота
 Формы (источники) права. Основы права. Тема 5
 Отношения в обществе
 Муниципальное образовательное учреждение средняя общеобразовательная школа № 36 г. Владимира
 Региональные и федеральные службы помощи
 Тема
Тема Принципы защиты интеллектуальной собственности при создании инновационных проектов
 Презентация на тему Обстоятельство (4 класс)
 Знаки препинания в простом осложнённом предложении (однородные члены предложения)