- FIRM BEHAVIOR AND THE ORGANIZATION OF Industry

Содержание
- 2. 13 The Costs of Production
- 3. The Market Forces of Supply and Demand Supply and demand are the two words that economists
- 4. WHAT ARE COSTS? According to the Law of Supply: Firms are willing to produce and sell
- 5. WHAT ARE COSTS? The Firm’s Objective The economic goal of the firm is to maximize profits.
- 6. Total Revenue, Total Cost, and Profit Total Revenue The amount a firm receives for the sale
- 7. Total Revenue, Total Cost, and Profit Profit is the firm’s total revenue minus its total cost.
- 8. Costs as Opportunity Costs A firm’s cost of production includes all the opportunity costs of making
- 9. Economic Profit versus Accounting Profit Economists measure a firm’s economic profit as total revenue minus total
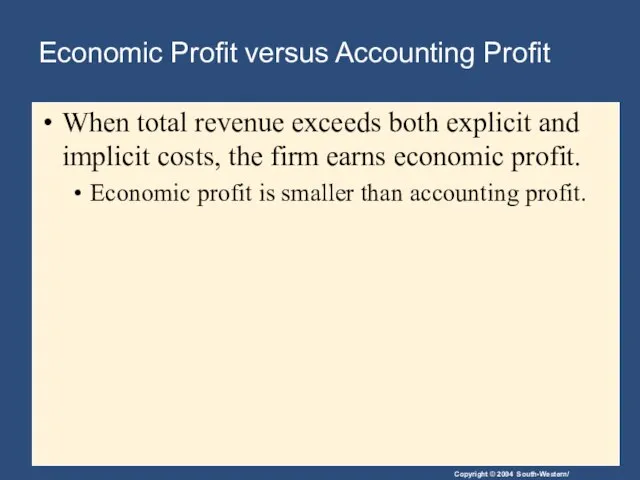
- 10. Economic Profit versus Accounting Profit When total revenue exceeds both explicit and implicit costs, the firm
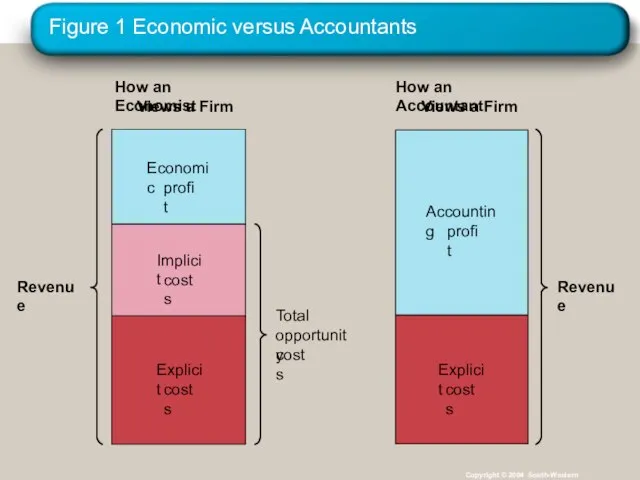
- 11. Figure 1 Economic versus Accountants Copyright © 2004 South-Western How an Economist Views a Firm How
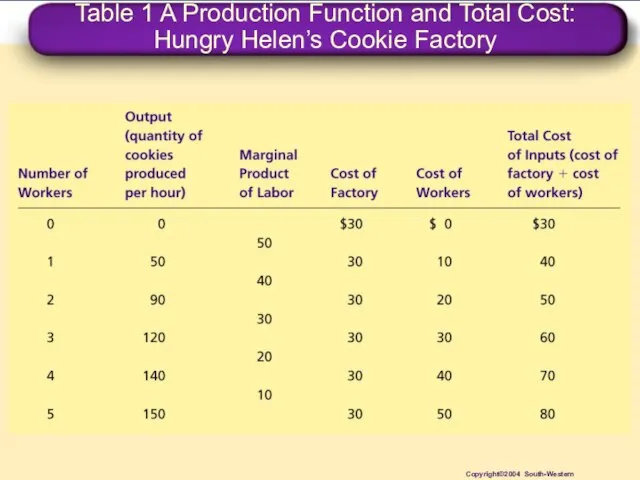
- 12. Table 1 A Production Function and Total Cost: Hungry Helen’s Cookie Factory Copyright©2004 South-Western
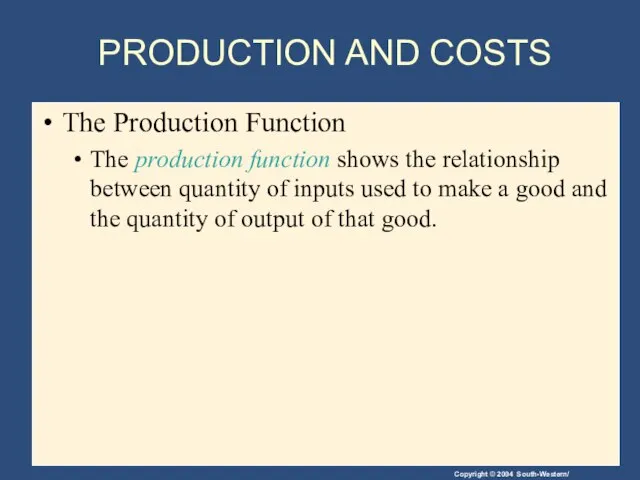
- 13. PRODUCTION AND COSTS The Production Function The production function shows the relationship between quantity of inputs
- 14. The Production Function Marginal Product The marginal product of any input in the production process is
- 15. The Production Function Diminishing Marginal Product Diminishing marginal product is the property whereby the marginal product
- 16. Figure 2 Hungry Helen’s Production Function Copyright © 2004 South-Western Quantity of Output (cookies per hour)
- 17. The Production Function Diminishing Marginal Product The slope of the production function measures the marginal product
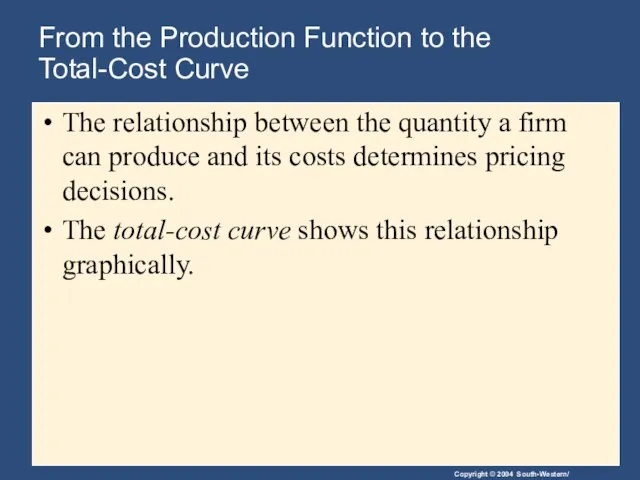
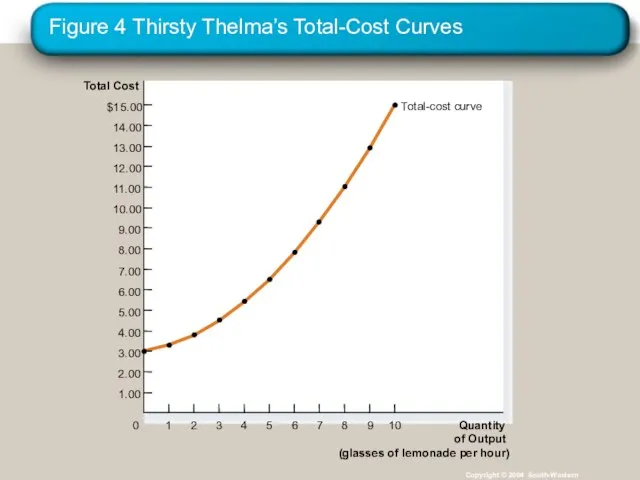
- 18. From the Production Function to the Total-Cost Curve The relationship between the quantity a firm can
- 19. Table 1 A Production Function and Total Cost: Hungry Helen’s Cookie Factory Copyright©2004 South-Western
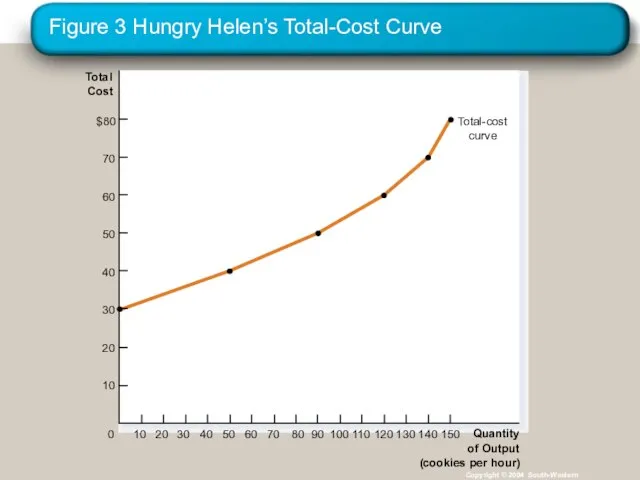
- 20. Figure 3 Hungry Helen’s Total-Cost Curve Copyright © 2004 South-Western Total Cost $80 70 60 50
- 21. THE VARIOUS MEASURES OF COST Costs of production may be divided into fixed costs and variable
- 22. Fixed and Variable Costs Fixed costs are those costs that do not vary with the quantity
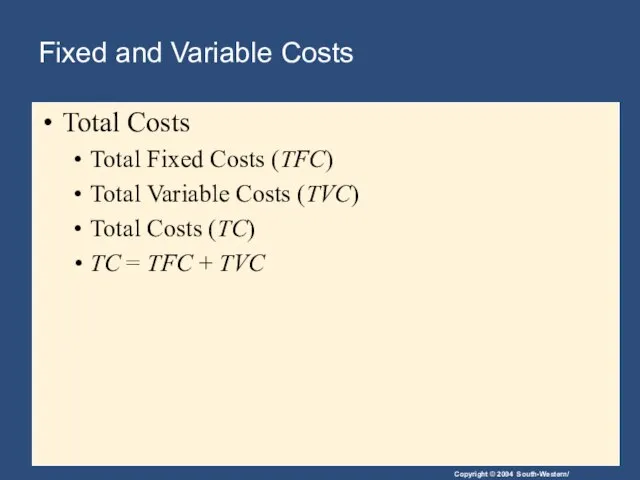
- 23. Fixed and Variable Costs Total Costs Total Fixed Costs (TFC) Total Variable Costs (TVC) Total Costs
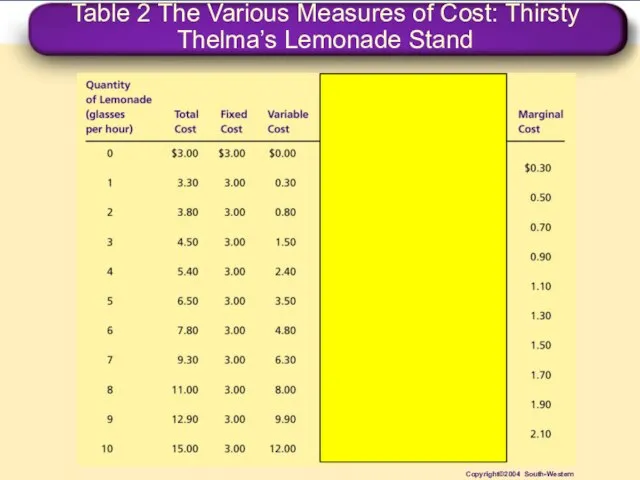
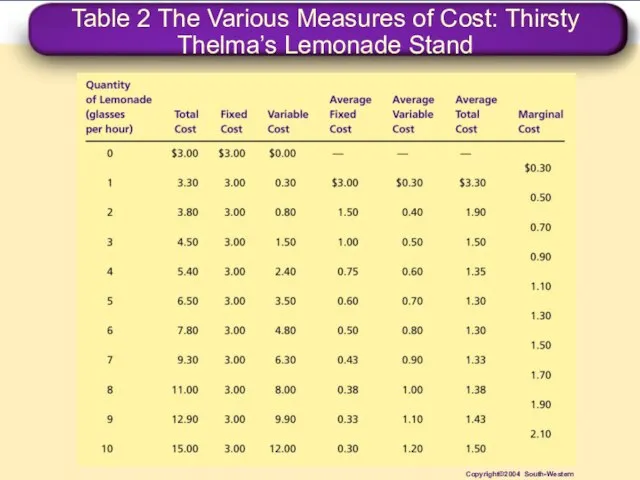
- 24. Table 2 The Various Measures of Cost: Thirsty Thelma’s Lemonade Stand Copyright©2004 South-Western
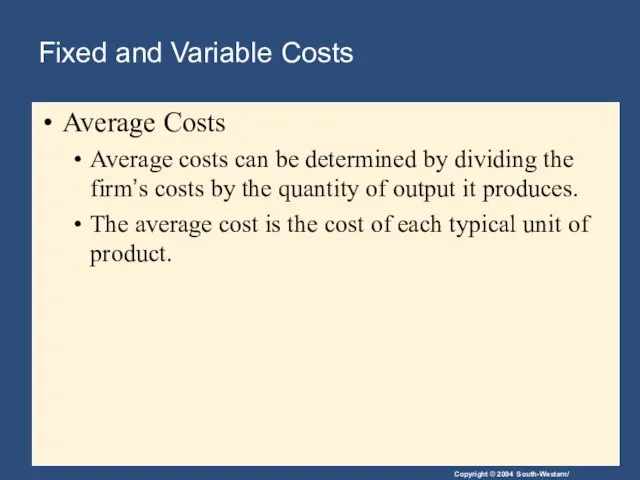
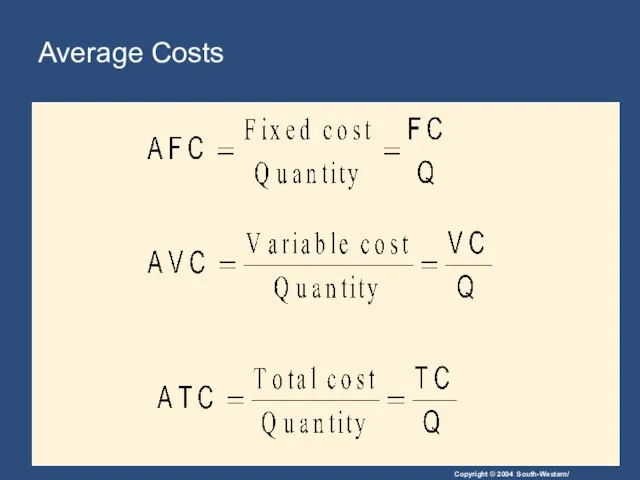
- 25. Fixed and Variable Costs Average Costs Average costs can be determined by dividing the firm’s costs
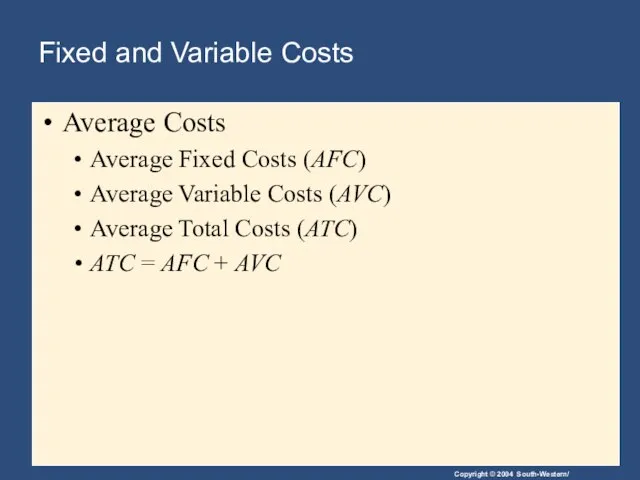
- 26. Fixed and Variable Costs Average Costs Average Fixed Costs (AFC) Average Variable Costs (AVC) Average Total
- 27. Average Costs
- 28. Table 2 The Various Measures of Cost: Thirsty Thelma’s Lemonade Stand Copyright©2004 South-Western
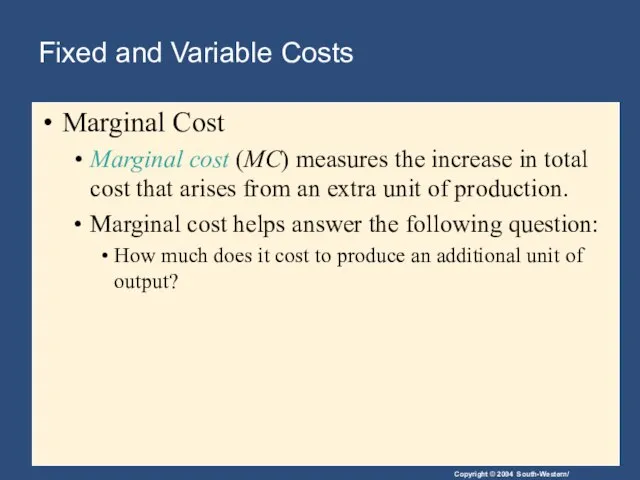
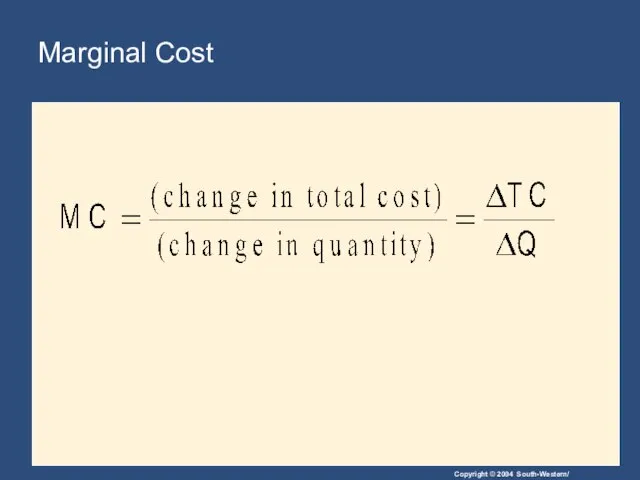
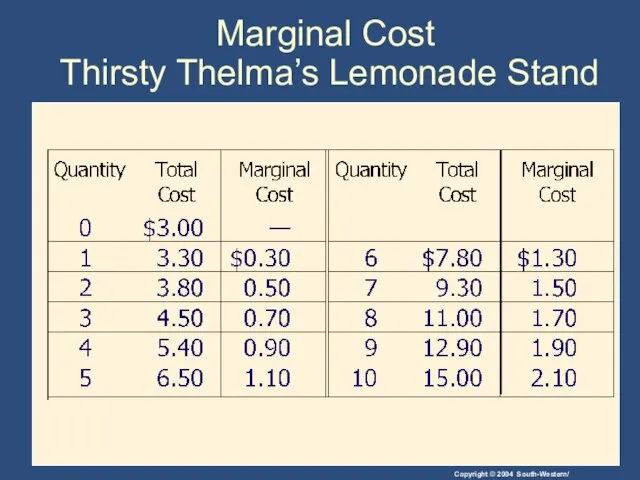
- 29. Fixed and Variable Costs Marginal Cost Marginal cost (MC) measures the increase in total cost that
- 30. Marginal Cost
- 31. Marginal Cost Thirsty Thelma’s Lemonade Stand
- 32. Figure 4 Thirsty Thelma’s Total-Cost Curves Copyright © 2004 South-Western Total Cost $15.00 14.00 13.00 12.00
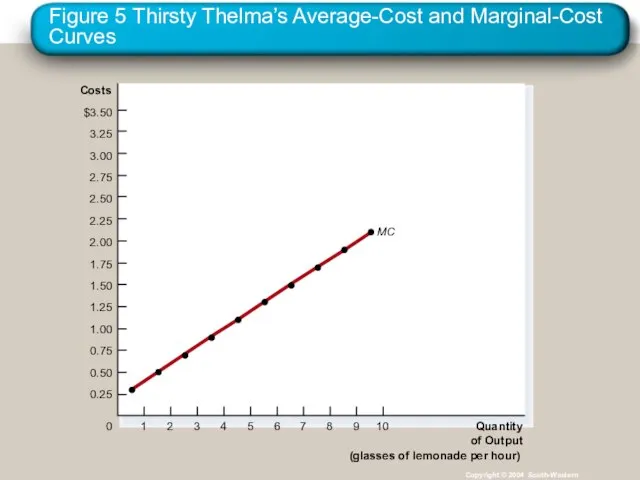
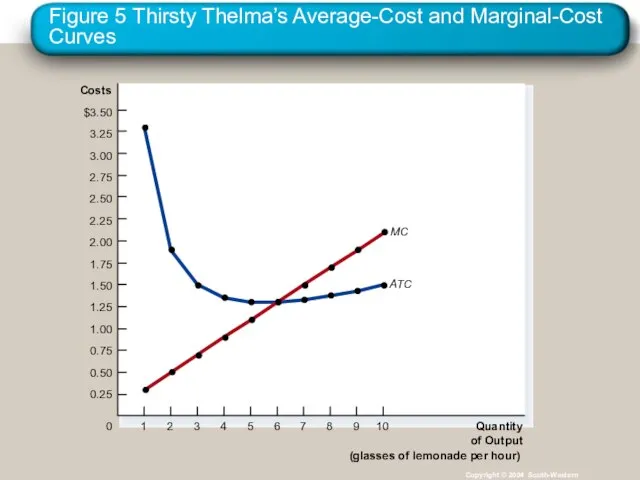
- 33. Figure 5 Thirsty Thelma’s Average-Cost and Marginal-Cost Curves Copyright © 2004 South-Western Costs $3.50 3.25 3.00
- 34. Cost Curves and Their Shapes Marginal cost rises with the amount of output produced. This reflects
- 35. Figure 5 Thirsty Thelma’s Average-Cost and Marginal-Cost Curves Copyright © 2004 South-Western Costs $3.50 3.25 3.00
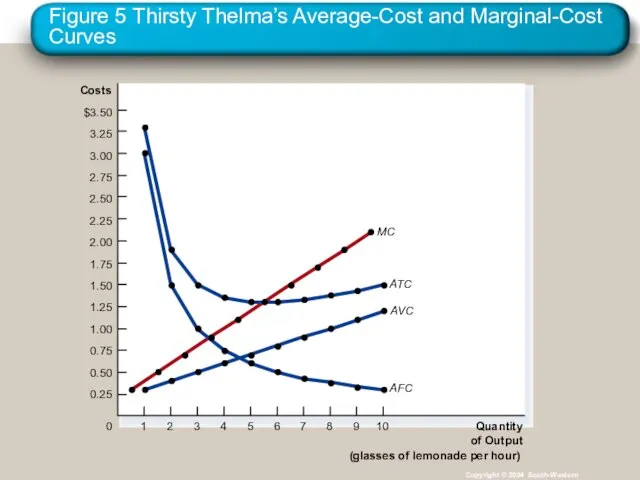
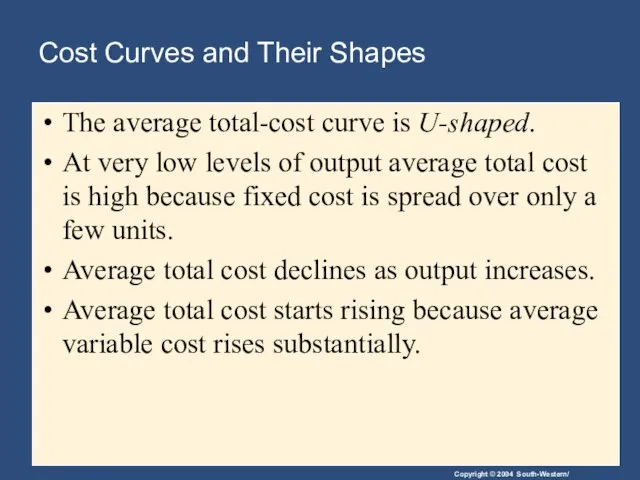
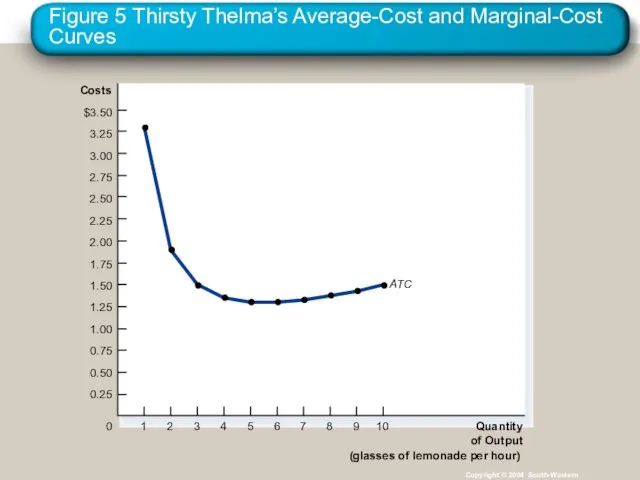
- 36. Cost Curves and Their Shapes The average total-cost curve is U-shaped. At very low levels of
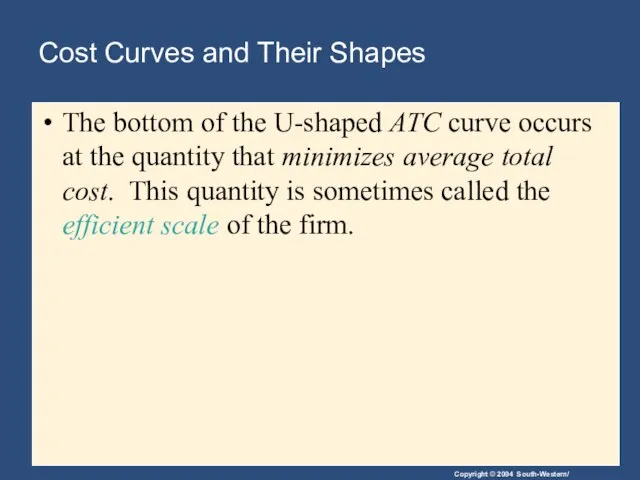
- 37. Cost Curves and Their Shapes The bottom of the U-shaped ATC curve occurs at the quantity
- 38. Figure 5 Thirsty Thelma’s Average-Cost and Marginal-Cost Curves Copyright © 2004 South-Western Costs $3.50 3.25 3.00
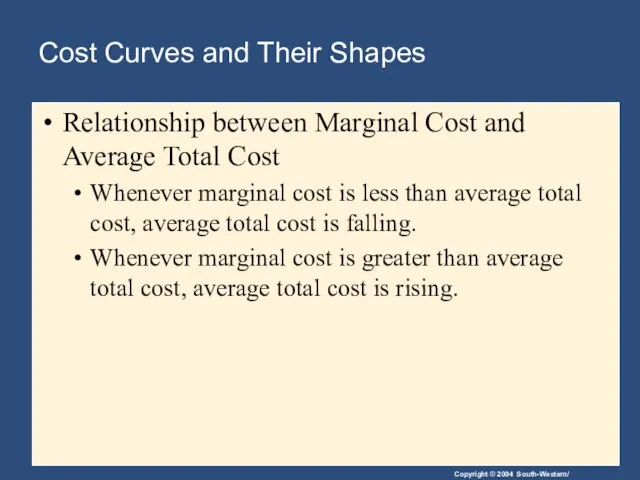
- 39. Cost Curves and Their Shapes Relationship between Marginal Cost and Average Total Cost Whenever marginal cost
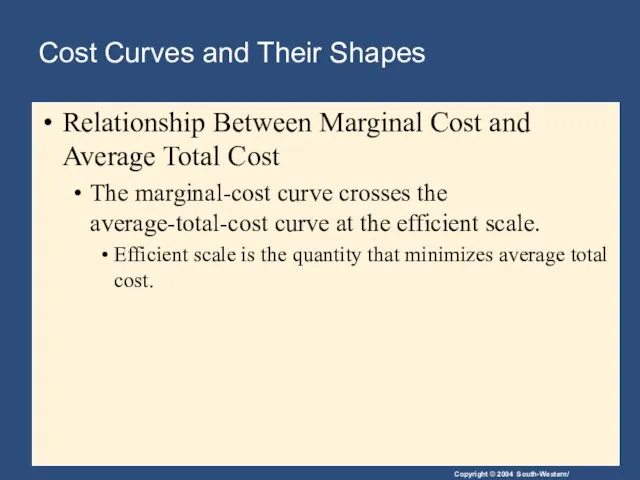
- 40. Cost Curves and Their Shapes Relationship Between Marginal Cost and Average Total Cost The marginal-cost curve
- 41. Figure 5 Thirsty Thelma’s Average-Cost and Marginal-Cost Curves Copyright © 2004 South-Western Costs $3.50 3.25 3.00
- 42. Typical Cost Curves It is now time to examine the relationships that exist between the different
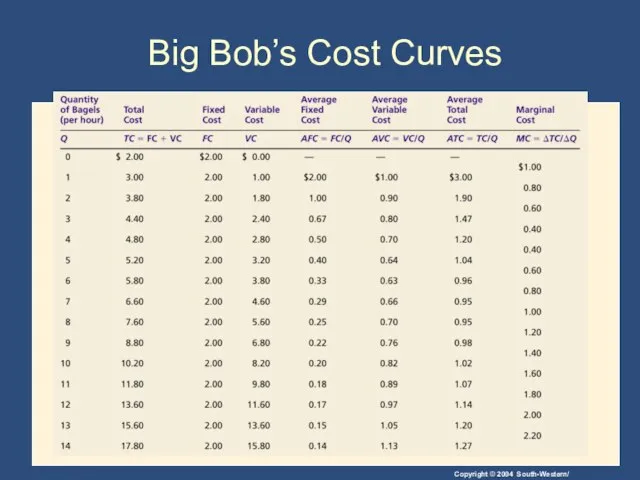
- 43. Big Bob’s Cost Curves
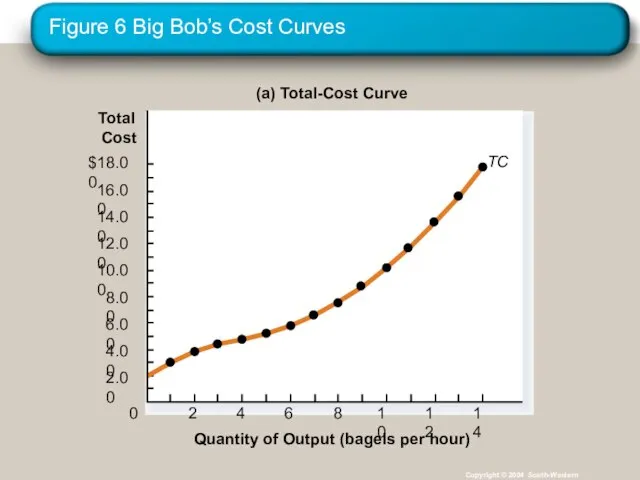
- 44. Figure 6 Big Bob’s Cost Curves Copyright © 2004 South-Western (a) Total-Cost Curve $18.00 16.00 14.00
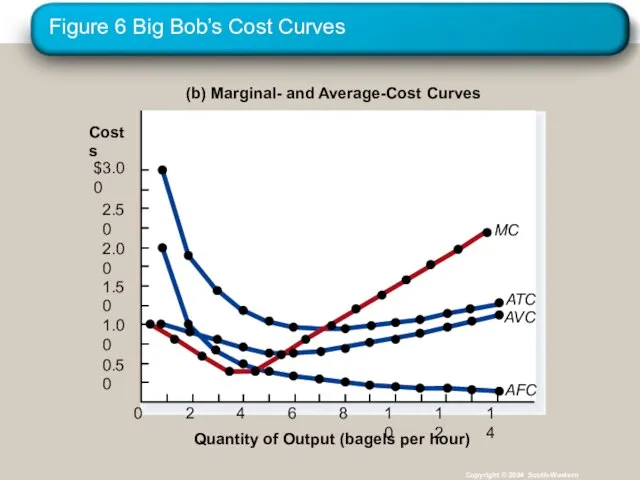
- 45. Figure 6 Big Bob’s Cost Curves Copyright © 2004 South-Western (b) Marginal- and Average-Cost Curves Quantity
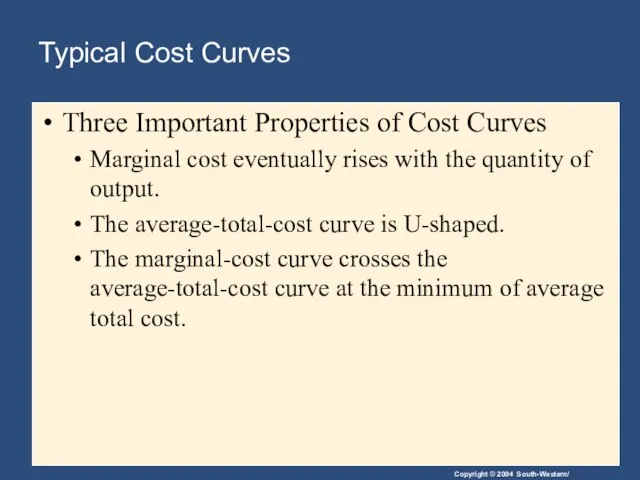
- 46. Typical Cost Curves Three Important Properties of Cost Curves Marginal cost eventually rises with the quantity
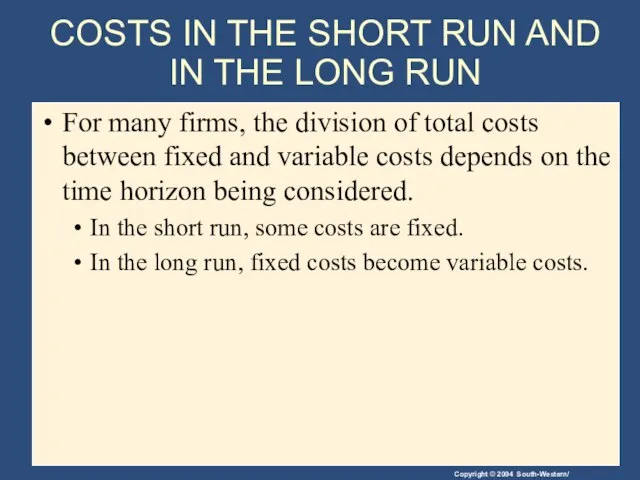
- 47. COSTS IN THE SHORT RUN AND IN THE LONG RUN For many firms, the division of
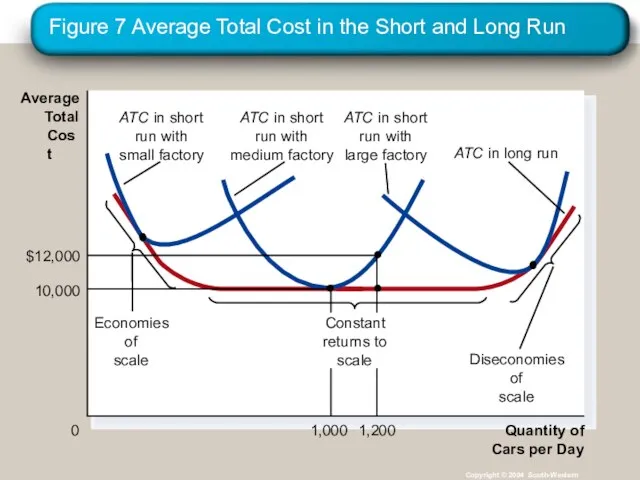
- 48. COSTS IN THE SHORT RUN AND IN THE LONG RUN Because many costs are fixed in
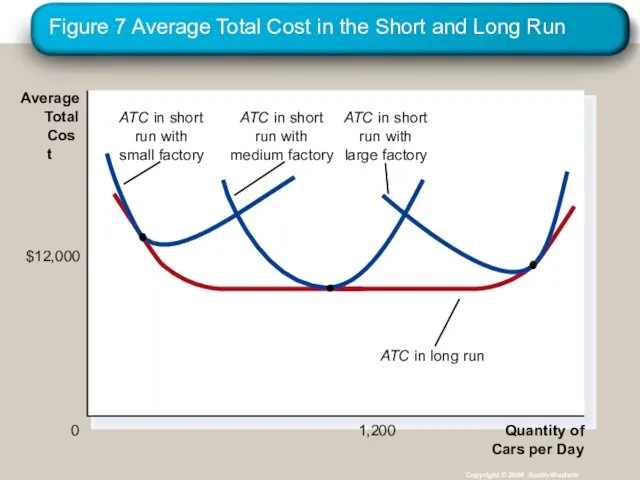
- 49. Figure 7 Average Total Cost in the Short and Long Run Copyright © 2004 South-Western Quantity
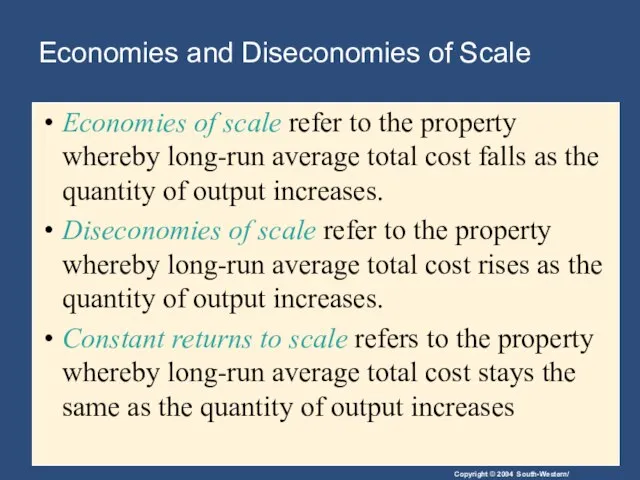
- 50. Economies and Diseconomies of Scale Economies of scale refer to the property whereby long-run average total
- 51. Figure 7 Average Total Cost in the Short and Long Run Copyright © 2004 South-Western Quantity
- 52. Summary The goal of firms is to maximize profit, which equals total revenue minus total cost.
- 53. Summary A firm’s costs reflect its production process. A typical firm’s production function gets flatter as
- 54. Summary Average total cost is total cost divided by the quantity of output. Marginal cost is
- 56. Скачать презентацию
Слайд 3The Market Forces of Supply and Demand
Supply and demand are the two
The Market Forces of Supply and Demand
Supply and demand are the two
Слайд 4WHAT ARE COSTS?
According to the Law of Supply:
Firms are willing to produce
WHAT ARE COSTS?
According to the Law of Supply:
Firms are willing to produce
Слайд 5WHAT ARE COSTS?
The Firm’s Objective
The economic goal of the firm is to
WHAT ARE COSTS?
The Firm’s Objective
The economic goal of the firm is to
Слайд 6Total Revenue, Total Cost, and Profit
Total Revenue
The amount a firm receives for
Total Revenue, Total Cost, and Profit
Total Revenue
The amount a firm receives for
Слайд 7Total Revenue, Total Cost, and Profit
Profit is the firm’s total revenue minus
Total Revenue, Total Cost, and Profit
Profit is the firm’s total revenue minus
Слайд 8Costs as Opportunity Costs
A firm’s cost of production includes all the opportunity
Costs as Opportunity Costs
A firm’s cost of production includes all the opportunity
Слайд 9Economic Profit versus Accounting Profit
Economists measure a firm’s economic profit as total
Economic Profit versus Accounting Profit
Economists measure a firm’s economic profit as total
Слайд 10Economic Profit versus Accounting Profit
When total revenue exceeds both explicit and implicit
Economic Profit versus Accounting Profit
When total revenue exceeds both explicit and implicit
Слайд 11Figure 1 Economic versus Accountants
Copyright © 2004 South-Western
How an Economist
Views a Firm
How
Figure 1 Economic versus Accountants
Copyright © 2004 South-Western
How an Economist
Views a Firm
How
Слайд 12Table 1 A Production Function and Total Cost: Hungry Helen’s Cookie Factory
Copyright©2004
Table 1 A Production Function and Total Cost: Hungry Helen’s Cookie Factory
Copyright©2004
Слайд 13PRODUCTION AND COSTS
The Production Function
The production function shows the relationship between quantity
PRODUCTION AND COSTS
The Production Function
The production function shows the relationship between quantity
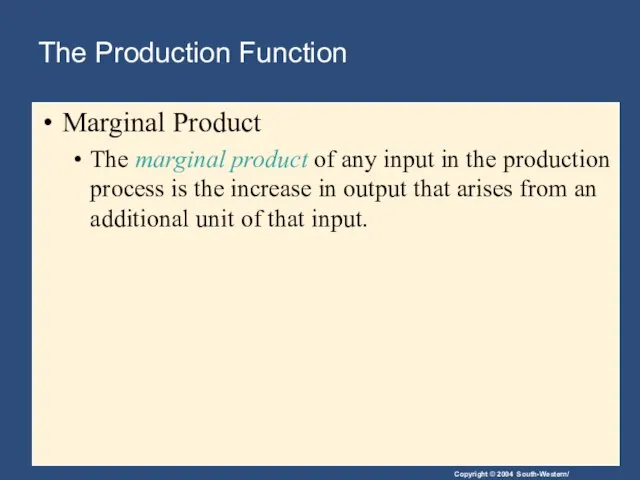
Слайд 14The Production Function
Marginal Product
The marginal product of any input in the
The Production Function
Marginal Product
The marginal product of any input in the
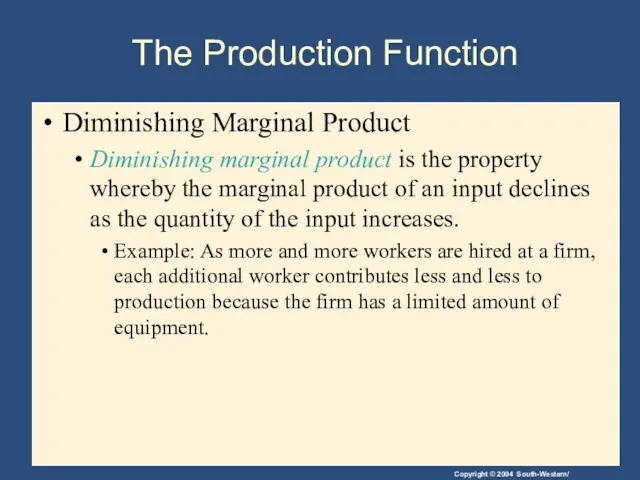
Слайд 15The Production Function
Diminishing Marginal Product
Diminishing marginal product is the property whereby
The Production Function
Diminishing Marginal Product
Diminishing marginal product is the property whereby
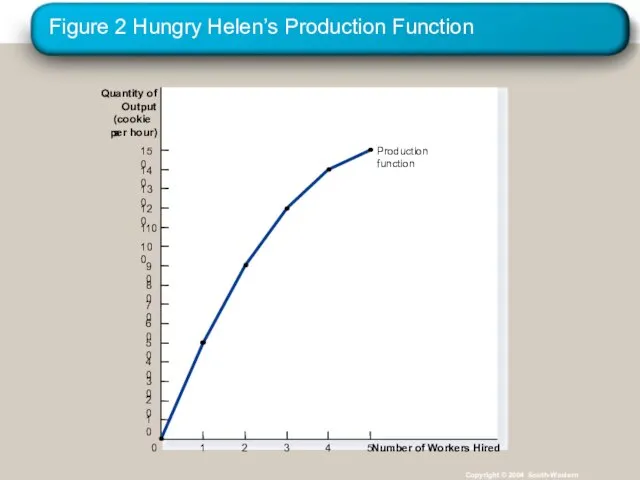
Слайд 16Figure 2 Hungry Helen’s Production Function
Copyright © 2004 South-Western
Quantity of
Output
(cookies
per hour)
150
140
130
120
110
100
90
80
70
60
50
40
30
20
10
Number of
Figure 2 Hungry Helen’s Production Function
Copyright © 2004 South-Western
Quantity of
Output
(cookies
per hour)
150
140
130
120
110
100
90
80
70
60
50
40
30
20
10
Number of
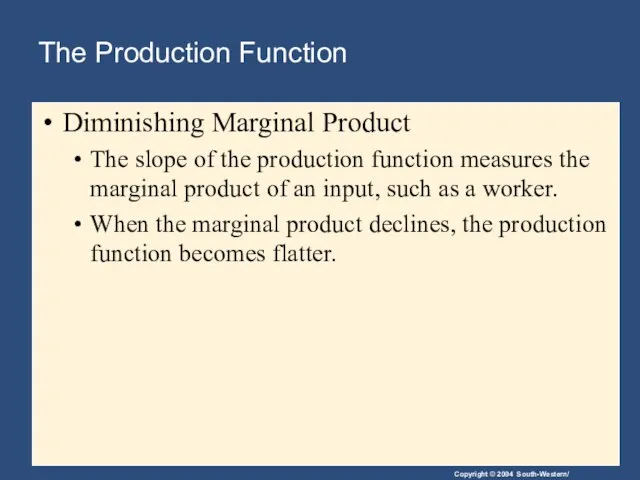
Слайд 17The Production Function
Diminishing Marginal Product
The slope of the production function
The Production Function
Diminishing Marginal Product
The slope of the production function
Слайд 18From the Production Function to the Total-Cost Curve
The relationship between the quantity
From the Production Function to the Total-Cost Curve
The relationship between the quantity
Слайд 19Table 1 A Production Function and Total Cost: Hungry Helen’s Cookie Factory
Copyright©2004
Table 1 A Production Function and Total Cost: Hungry Helen’s Cookie Factory
Copyright©2004

Слайд 20Figure 3 Hungry Helen’s Total-Cost Curve
Copyright © 2004 South-Western
Total
Cost
$80
70
60
50
40
30
20
10
Quantity
of Output
(cookies per hour)
0
10
20
30
150
130
110
90
70
50
40
140
120
100
80
60
Figure 3 Hungry Helen’s Total-Cost Curve
Copyright © 2004 South-Western
Total
Cost
$80
70
60
50
40
30
20
10
Quantity
of Output
(cookies per hour)
0
10
20
30
150
130
110
90
70
50
40
140
120
100
80
60
Слайд 21THE VARIOUS MEASURES OF COST
Costs of production may be divided into fixed
THE VARIOUS MEASURES OF COST
Costs of production may be divided into fixed
Слайд 22Fixed and Variable Costs
Fixed costs are those costs that do not vary
Fixed and Variable Costs
Fixed costs are those costs that do not vary
Слайд 23Fixed and Variable Costs
Total Costs
Total Fixed Costs (TFC)
Total Variable Costs (TVC)
Total Costs
Fixed and Variable Costs
Total Costs
Total Fixed Costs (TFC)
Total Variable Costs (TVC)
Total Costs
Слайд 24Table 2 The Various Measures of Cost: Thirsty Thelma’s Lemonade Stand
Copyright©2004 South-Western
Table 2 The Various Measures of Cost: Thirsty Thelma’s Lemonade Stand
Copyright©2004 South-Western
Слайд 25Fixed and Variable Costs
Average Costs
Average costs can be determined by dividing the
Fixed and Variable Costs
Average Costs
Average costs can be determined by dividing the
Слайд 26Fixed and Variable Costs
Average Costs
Average Fixed Costs (AFC)
Average Variable Costs (AVC)
Average Total
Fixed and Variable Costs
Average Costs
Average Fixed Costs (AFC)
Average Variable Costs (AVC)
Average Total
Слайд 27Average Costs
Average Costs
Слайд 28Table 2 The Various Measures of Cost: Thirsty Thelma’s Lemonade Stand
Copyright©2004 South-Western
Table 2 The Various Measures of Cost: Thirsty Thelma’s Lemonade Stand
Copyright©2004 South-Western
Слайд 29Fixed and Variable Costs
Marginal Cost
Marginal cost (MC) measures the increase in total
Fixed and Variable Costs
Marginal Cost
Marginal cost (MC) measures the increase in total
Слайд 30Marginal Cost
Marginal Cost
Слайд 31Marginal Cost
Thirsty Thelma’s Lemonade Stand
Marginal Cost
Thirsty Thelma’s Lemonade Stand
Слайд 32Figure 4 Thirsty Thelma’s Total-Cost Curves
Copyright © 2004 South-Western
Total Cost
$15.00
14.00
13.00
12.00
11.00
10.00
9.00
8.00
7.00
6.00
5.00
4.00
3.00
2.00
1.00
Quantity
of Output
(glasses of
Figure 4 Thirsty Thelma’s Total-Cost Curves
Copyright © 2004 South-Western
Total Cost
$15.00
14.00
13.00
12.00
11.00
10.00
9.00
8.00
7.00
6.00
5.00
4.00
3.00
2.00
1.00
Quantity
of Output
(glasses of
Слайд 33Figure 5 Thirsty Thelma’s Average-Cost and Marginal-Cost Curves
Copyright © 2004 South-Western
Costs
$3.50
3.25
3.00
2.75
2.50
2.25
2.00
1.75
1.50
1.25
1.00
0.75
0.50
0.25
Quantity
of Output
(glasses
Figure 5 Thirsty Thelma’s Average-Cost and Marginal-Cost Curves
Copyright © 2004 South-Western
Costs
$3.50
3.25
3.00
2.75
2.50
2.25
2.00
1.75
1.50
1.25
1.00
0.75
0.50
0.25
Quantity
of Output
(glasses
Слайд 34Cost Curves and Their Shapes
Marginal cost rises with the amount of output
Cost Curves and Their Shapes
Marginal cost rises with the amount of output
Слайд 35Figure 5 Thirsty Thelma’s Average-Cost and Marginal-Cost Curves
Copyright © 2004 South-Western
Costs
$3.50
3.25
3.00
2.75
2.50
2.25
2.00
1.75
1.50
1.25
1.00
0.75
0.50
0.25
Quantity
of Output
(glasses
Figure 5 Thirsty Thelma’s Average-Cost and Marginal-Cost Curves
Copyright © 2004 South-Western
Costs
$3.50
3.25
3.00
2.75
2.50
2.25
2.00
1.75
1.50
1.25
1.00
0.75
0.50
0.25
Quantity
of Output
(glasses
Слайд 36Cost Curves and Their Shapes
The average total-cost curve is U-shaped.
At very low
Cost Curves and Their Shapes
The average total-cost curve is U-shaped.
At very low
Слайд 37Cost Curves and Their Shapes
The bottom of the U-shaped ATC curve occurs
Cost Curves and Their Shapes
The bottom of the U-shaped ATC curve occurs
Слайд 38Figure 5 Thirsty Thelma’s Average-Cost and Marginal-Cost Curves
Copyright © 2004 South-Western
Costs
$3.50
3.25
3.00
2.75
2.50
2.25
2.00
1.75
1.50
1.25
1.00
0.75
0.50
0.25
Quantity
of Output
(glasses
Figure 5 Thirsty Thelma’s Average-Cost and Marginal-Cost Curves
Copyright © 2004 South-Western
Costs
$3.50
3.25
3.00
2.75
2.50
2.25
2.00
1.75
1.50
1.25
1.00
0.75
0.50
0.25
Quantity
of Output
(glasses
Слайд 39Cost Curves and Their Shapes
Relationship between Marginal Cost and Average Total
Cost Curves and Their Shapes
Relationship between Marginal Cost and Average Total
Слайд 40Cost Curves and Their Shapes
Relationship Between Marginal Cost and Average Total
Cost Curves and Their Shapes
Relationship Between Marginal Cost and Average Total
Слайд 41Figure 5 Thirsty Thelma’s Average-Cost and Marginal-Cost Curves
Copyright © 2004 South-Western
Costs
$3.50
3.25
3.00
2.75
2.50
2.25
2.00
1.75
1.50
1.25
1.00
0.75
0.50
0.25
Quantity
of Output
(glasses
Figure 5 Thirsty Thelma’s Average-Cost and Marginal-Cost Curves
Copyright © 2004 South-Western
Costs
$3.50
3.25
3.00
2.75
2.50
2.25
2.00
1.75
1.50
1.25
1.00
0.75
0.50
0.25
Quantity
of Output
(glasses
Слайд 42Typical Cost Curves
It is now time to examine the relationships that exist
Typical Cost Curves
It is now time to examine the relationships that exist
Слайд 43Big Bob’s Cost Curves
Big Bob’s Cost Curves
Слайд 44Figure 6 Big Bob’s Cost Curves
Copyright © 2004 South-Western
(a) Total-Cost Curve
$18.00
16.00
14.00
12.00
10.00
8.00
6.00
4.00
Quantity of
Figure 6 Big Bob’s Cost Curves
Copyright © 2004 South-Western
(a) Total-Cost Curve
$18.00
16.00
14.00
12.00
10.00
8.00
6.00
4.00
Quantity of
Слайд 45Figure 6 Big Bob’s Cost Curves
Copyright © 2004 South-Western
(b) Marginal- and Average-Cost
Figure 6 Big Bob’s Cost Curves
Copyright © 2004 South-Western
(b) Marginal- and Average-Cost
Слайд 46Typical Cost Curves
Three Important Properties of Cost Curves
Marginal cost eventually rises
Typical Cost Curves
Three Important Properties of Cost Curves
Marginal cost eventually rises
Слайд 47COSTS IN THE SHORT RUN AND IN THE LONG RUN
For many firms,
COSTS IN THE SHORT RUN AND IN THE LONG RUN
For many firms,
Слайд 48COSTS IN THE SHORT RUN AND IN THE LONG RUN
Because many costs
COSTS IN THE SHORT RUN AND IN THE LONG RUN
Because many costs
Слайд 49Figure 7 Average Total Cost in the Short and Long Run
Copyright ©
Figure 7 Average Total Cost in the Short and Long Run
Copyright ©
Слайд 50Economies and Diseconomies of Scale
Economies of scale refer to the property whereby
Economies and Diseconomies of Scale
Economies of scale refer to the property whereby
Слайд 51Figure 7 Average Total Cost in the Short and Long Run
Copyright ©
Figure 7 Average Total Cost in the Short and Long Run
Copyright ©
Слайд 52Summary
The goal of firms is to maximize profit, which equals total revenue
Summary
The goal of firms is to maximize profit, which equals total revenue
Слайд 53Summary
A firm’s costs reflect its production process.
A typical firm’s production function gets
Summary
A firm’s costs reflect its production process.
A typical firm’s production function gets
Слайд 54Summary
Average total cost is total cost divided by the quantity of output.
Marginal
Summary
Average total cost is total cost divided by the quantity of output.
Marginal
 Устройства вывода информации
 Презентация на тему Библиотечный урок
 Что такое системно - деятельностный подход в образовании? Развитие личности человека - это развитие системы «человек - мир». В этом
  Особенности заданий для проведения ГИА
 Турнир Память 2018 год
 Презентация на тему Государственная дума и развитие парламентаризма в России
 ВКР: Особенности развития нагляднообразного мышления детей 3-4 летнего возраста
 Презентация на тему генетика пола
 EN-5200PLT
 Вепсская кукла
 Структура координационных соединений и металл-органических каркасов
 Презентация на тему День Знаний
  Что такое налоги и зачем их платить. Урок 1
 Сравнительная оценка различных методов дворового компостирования
 Презентация
 Термодинамика и статистическая физика
 Орнамент в круге. Зарисовка портрета человека. Краткосрочный этюд натюрморта. Работы учащихся
 Один дома 4. Новая реальность
 Политика
 Реки Африки
 Экономическая сущность налогов
 Правовые символы
 Машины для нарезки и протирания овощей
 Правление объектами ЖКХ
 Let’s practice
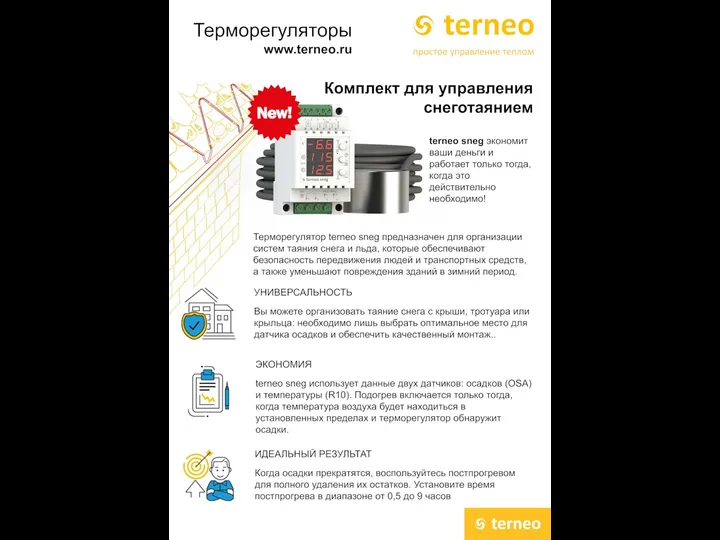 Терморегуляторы. Комплект для управления снеготаянием
 Путешествия. Открой мир для себя и своей семьи
 Готовность учителя начальных классов к реализации стандарта нового поколения