- Long run Economic

Содержание
- 2. How long-run growth can be measured by the increase in real GDP per capita, how this
- 3. How growth has varied among several important regions of the world and why the convergence hypothesis
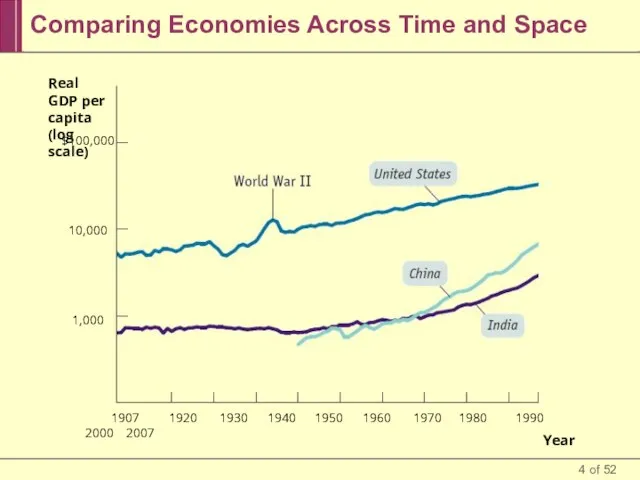
- 4. Comparing Economies Across Time and Space Real GDP per capita (log scale) $100,000 10,000 1,000 1907
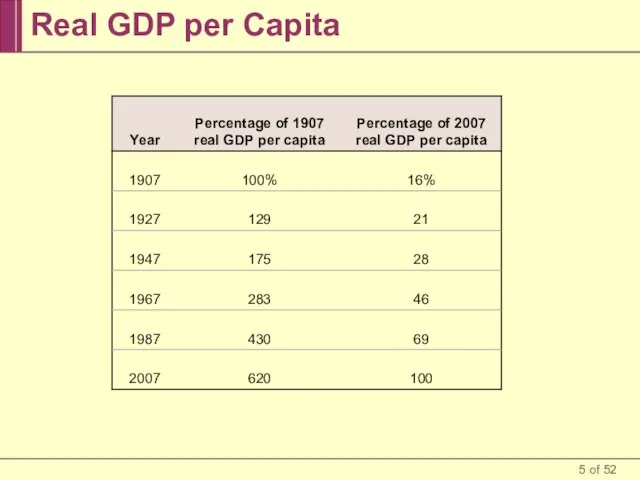
- 5. Real GDP per Capita
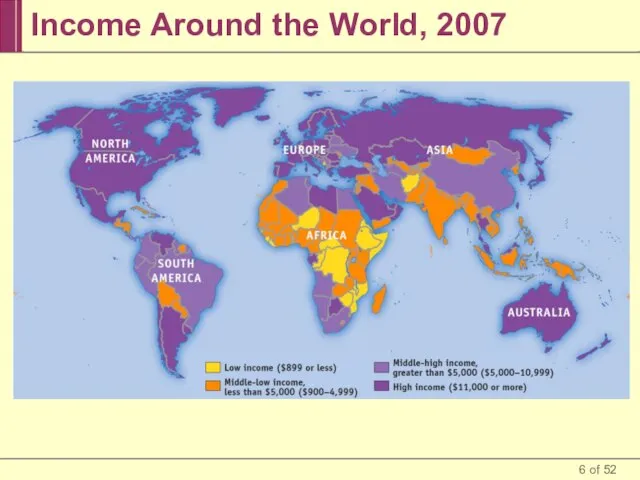
- 6. Income Around the World, 2007
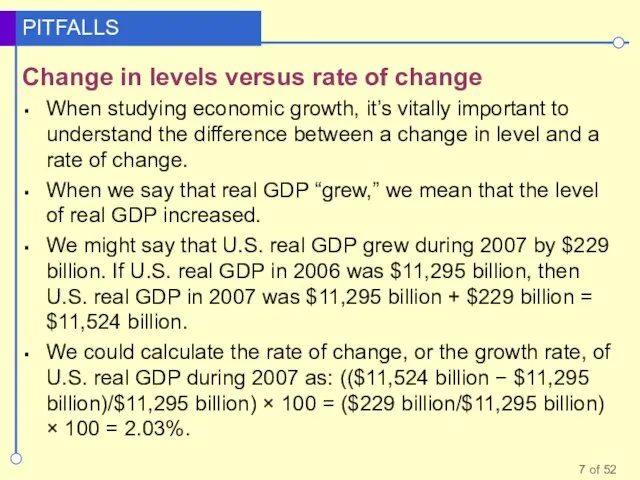
- 7. Change in levels versus rate of change When studying economic growth, it’s vitally important to understand
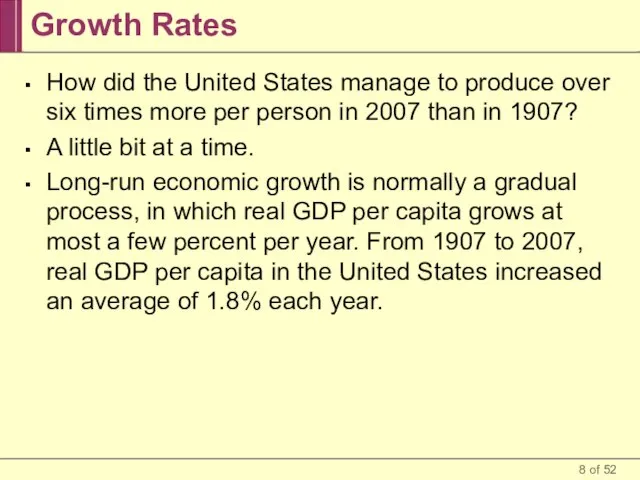
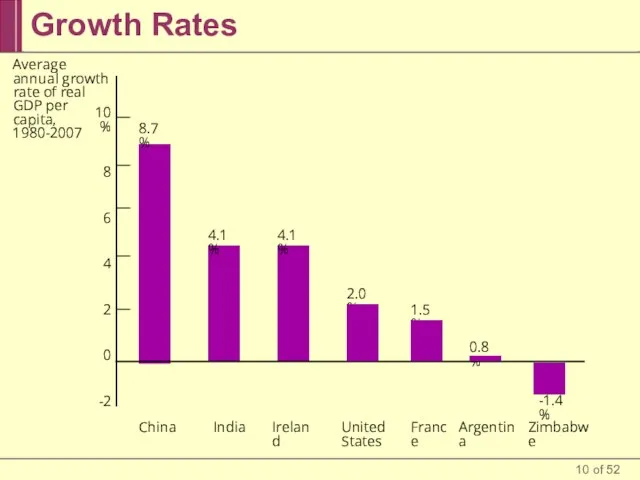
- 8. Growth Rates How did the United States manage to produce over six times more per person
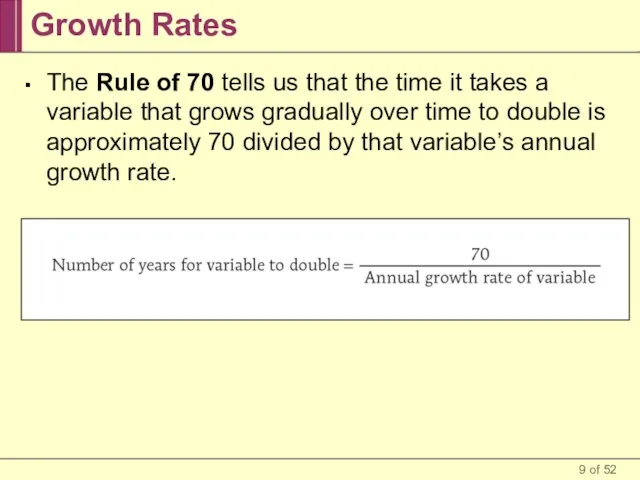
- 9. Growth Rates The Rule of 70 tells us that the time it takes a variable that
- 10. Growth Rates United States 10% 8 6 4 2 0 -2 Average annual growth rate of
- 11. India Takes Off India achieved independence from Great Britain in 1947, becoming the world’s most populous
- 12. The Luck of the Irish In the nineteenth century, Ireland was desperately poor. Even as late
- 13. The Sources of Long-Run Growth Labor productivity, often referred to simply as productivity, is output per
- 14. Accounting for Growth: The Aggregate Production Function The aggregate production function is a hypothetical function that
- 15. Accounting for Growth: The Aggregate Production Function A recent example of an aggregate production function applied
- 16. Accounting for Growth: The Aggregate Production Function Using this function, they tried to explain why China
- 17. Diminishing Returns to Physical Capital An aggregate production function exhibits diminishing returns to physical capital when,
- 18. Diminishing Returns to Physical Capital A Hypothetical Example: How Physical Capital per Worker Affects Productivity, Holding
- 19. Diminishing Returns to Physical Capital A Hypothetical Example: Increases in Physical Capital per Worker and the
- 20. The Wal-Mart Effect After 20 years of being sluggish, U.S. productivity growth accelerated sharply (grew at
- 21. Physical Capital and Productivity $60,000 50,000 30,000 0 Real GDP per worker $20,000 50,000 80,000 Physical
- 22. It May Be Diminished … But It’s Still Positive Diminishing returns to physical capital is an
- 23. Growth Accounting Growth accounting estimates the contribution of each major factor in the aggregate production function
- 24. Technological Progress and Productivity Growth $120,000 90,000 60,000 30,000 0 Real GDP per worker (2000 dollars)
- 25. What about Natural Resources? In contrast to earlier times, in the modern world, natural resources are
- 26. The Information Technology Paradox Many economists were puzzled by the slowdown in the U.S. growth rate
- 27. The Information Technology Paradox MIT economics professor and Nobel laureate Robert Solow, a pioneer in the
- 28. Why Growth Rates Differ A number of factors influence differences among countries in their growth rates.
- 29. Why Growth Rates Differ Human Capital in Latin America and East Asia
- 30. Inventing R&D Thomas Edison is best known as the inventor of the light bulb and the
- 31. The Role of Government in Promoting Economic Growth Political stability and protection of property rights are
- 32. The Role of Government in Promoting Economic Growth
- 33. The Brazilian Breadbasket In recent years, Brazil’s economy has made a strong showing, especially in agriculture.
- 34. Old Europe and New Technology
- 35. Success, Disappointment, and Failure Real GDP per capita (log scale) 1960 1970 1980 1990 2000 2007
- 36. Success, Disappointment, and Failure The world economy contains examples of success and failure in the effort
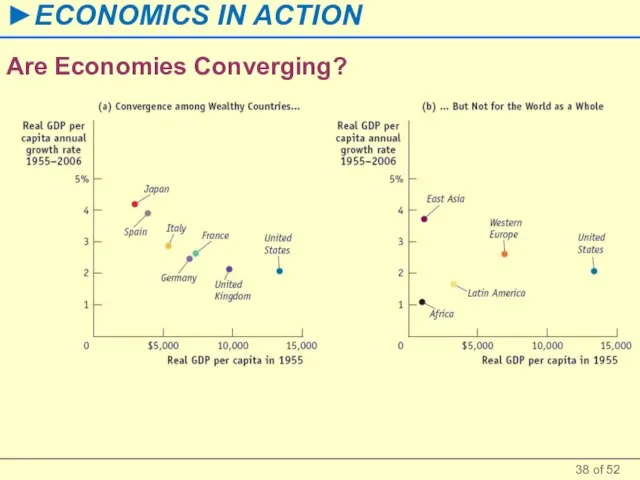
- 37. Success, Disappointment, and Failure The growth rates of economically advanced countries have converged, but not the
- 38. Are Economies Converging?
- 39. Success, Disappointment, and Failure East Asia’s spectacular growth was generated by high savings and investment spending
- 40. Is World Growth Sustainable? Long-run economic growth is sustainable if it can continue in the face
- 41. The Real Price of Oil, 1949-2007 Real domestic U.S. oil price (2000 dollars, per barrel) 1949
- 42. U.S. Oil Consumption and Growth over Time Oil consumption (thousands of barrels per day) 1949 1960
- 43. Economic Growth and the Environment The limits to growth arising from environmental degradation are more difficult
- 44. Climate Change and Growth Carbon dioxide emissions (million metric tons) 1980 1985 1990 1995 2000 2005
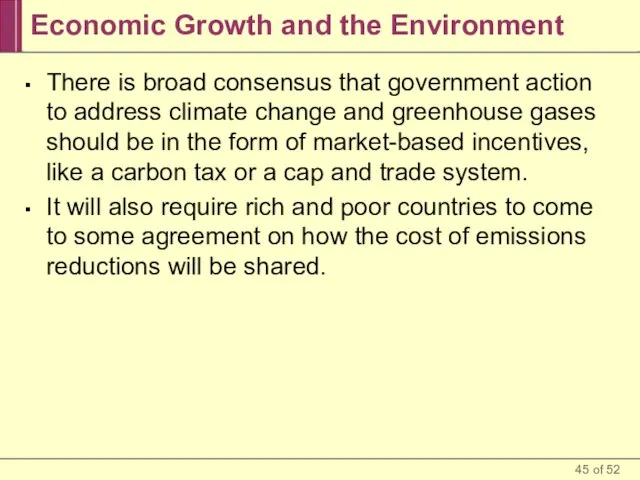
- 45. Economic Growth and the Environment There is broad consensus that government action to address climate change
- 46. Growth is measured as changes in real GDP per capita in order to eliminate the effects
- 47. The key to long-run economic growth is rising labor productivity, or just productivity, which is output
- 48. The large differences in countries’ growth rates are largely due to differences in their rates of
- 49. The world economy contains examples of success and failure in the effort to achieve long-run economic
- 50. Economists generally believe that environmental degradation poses a greater problem for whether long-run economic growth is
- 51. There is broad consensus that government action to address climate change and greenhouse gases should be
- 53. Скачать презентацию
Слайд 3How growth has varied among several important regions of the world and
How growth has varied among several important regions of the world and
Слайд 4Comparing Economies Across Time and Space
Real GDP per capita (log scale)
$100,000
10,000
1,000
1907
Comparing Economies Across Time and Space
Real GDP per capita (log scale)
$100,000
10,000
1,000
1907
Слайд 5Real GDP per Capita
Real GDP per Capita
Слайд 6Income Around the World, 2007
Income Around the World, 2007
Слайд 7Change in levels versus rate of change
When studying economic growth, it’s vitally
Change in levels versus rate of change
When studying economic growth, it’s vitally
Слайд 8Growth Rates
How did the United States manage to produce over six times
Growth Rates
How did the United States manage to produce over six times
Слайд 9
Growth Rates
The Rule of 70 tells us that the time it takes
Growth Rates
The Rule of 70 tells us that the time it takes
Слайд 10Growth Rates
United States
10%
8
6
4
2
0
-2
Average annual growth rate of real GDP per capita,
1980-2007
Ireland
Argentina
France
4.1%
2.0%
1.5%
0.8%
-1.4%
8.7%
China
India
Zimbabwe
4.1%
Growth Rates
United States
10%
8
6
4
2
0
-2
Average annual growth rate of real GDP per capita,
1980-2007
Ireland
Argentina
France
4.1%
2.0%
1.5%
0.8%
-1.4%
8.7%
China
India
Zimbabwe
4.1%
Слайд 11India Takes Off
India achieved independence from Great Britain in 1947, becoming the
India Takes Off
India achieved independence from Great Britain in 1947, becoming the
Слайд 12The Luck of the Irish
In the nineteenth century, Ireland was desperately poor.
Even
The Luck of the Irish
In the nineteenth century, Ireland was desperately poor.
Even

Слайд 13The Sources of Long-Run Growth
Labor productivity, often referred to simply as productivity,
The Sources of Long-Run Growth
Labor productivity, often referred to simply as productivity,

Слайд 14Accounting for Growth:
The Aggregate Production Function
The aggregate production function is a
Accounting for Growth:
The Aggregate Production Function
The aggregate production function is a
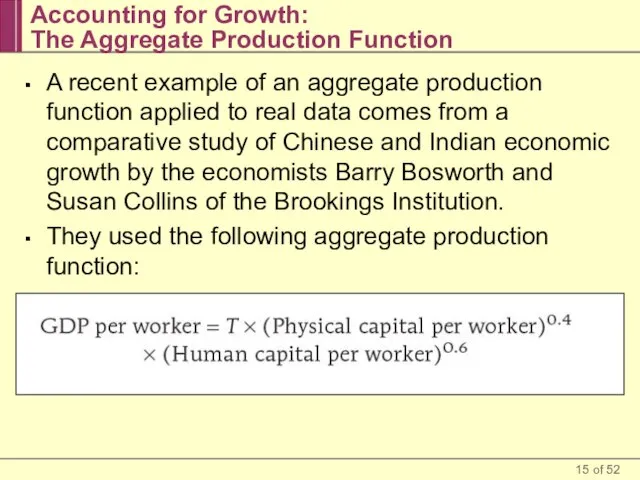
Слайд 15Accounting for Growth:
The Aggregate Production Function
A recent example of an aggregate
Accounting for Growth:
The Aggregate Production Function
A recent example of an aggregate
Слайд 16Accounting for Growth:
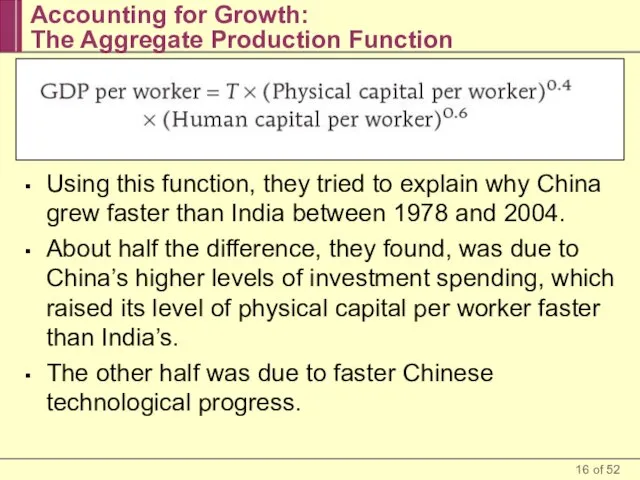
The Aggregate Production Function
Using this function, they tried to
Accounting for Growth:
The Aggregate Production Function
Using this function, they tried to
Слайд 17Diminishing Returns to Physical Capital
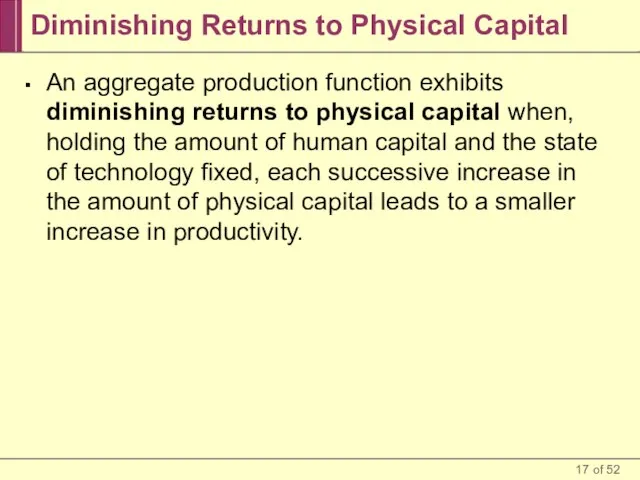
An aggregate production function exhibits diminishing returns to
Diminishing Returns to Physical Capital
An aggregate production function exhibits diminishing returns to
Слайд 18Diminishing Returns to Physical Capital
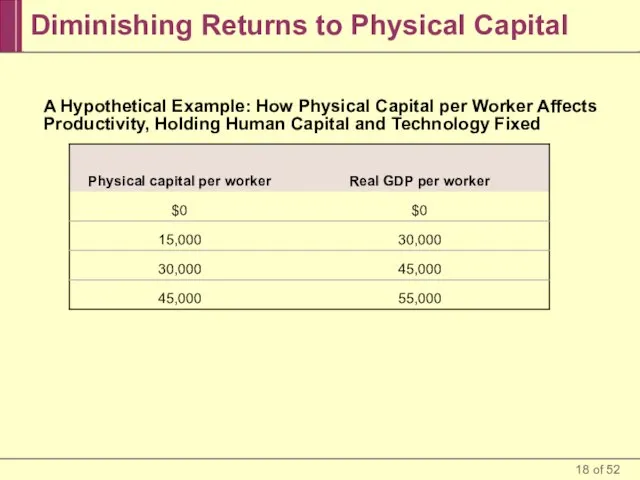
A Hypothetical Example: How Physical Capital per Worker
Diminishing Returns to Physical Capital
A Hypothetical Example: How Physical Capital per Worker
Слайд 19Diminishing Returns to Physical Capital
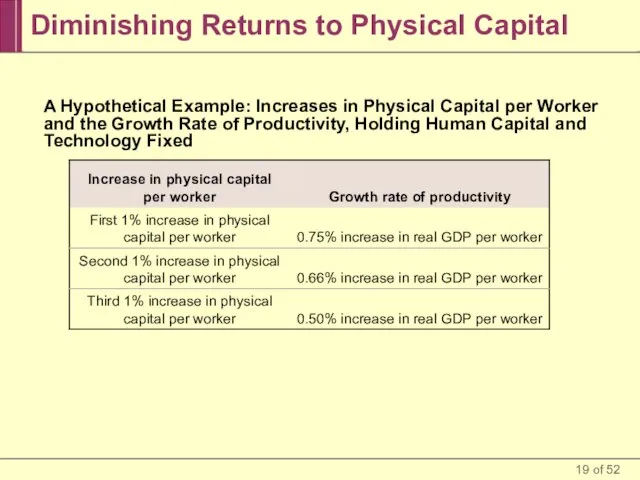
A Hypothetical Example: Increases in Physical Capital per
Diminishing Returns to Physical Capital
A Hypothetical Example: Increases in Physical Capital per
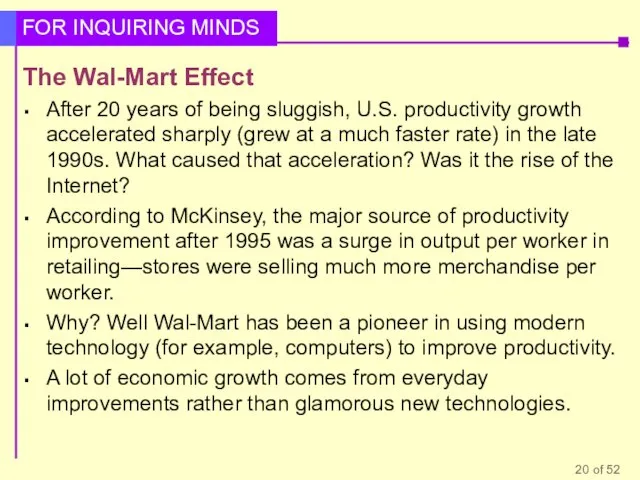
Слайд 20The Wal-Mart Effect
After 20 years of being sluggish, U.S. productivity growth accelerated
The Wal-Mart Effect
After 20 years of being sluggish, U.S. productivity growth accelerated
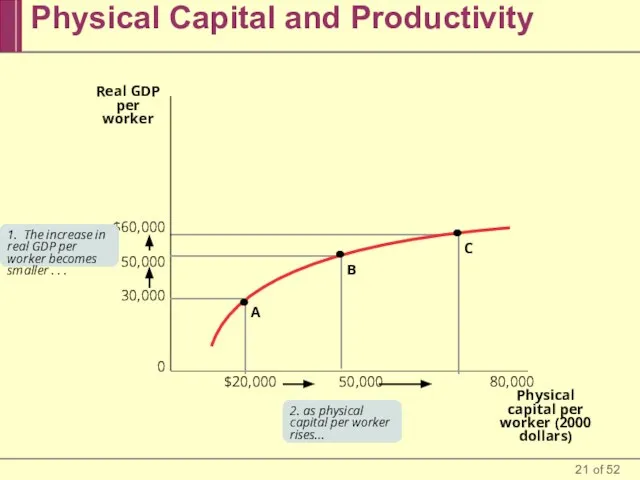
Слайд 21Physical Capital and Productivity
$60,000
50,000
30,000
0
Real GDP per worker
$20,000 50,000 80,000
Physical capital per worker
Physical Capital and Productivity
$60,000
50,000
30,000
0
Real GDP per worker
$20,000 50,000 80,000
Physical capital per worker
Слайд 22It May Be Diminished … But It’s Still Positive
Diminishing returns to physical
It May Be Diminished … But It’s Still Positive
Diminishing returns to physical
Слайд 23Growth Accounting
Growth accounting estimates the contribution of each major factor in the
Growth Accounting
Growth accounting estimates the contribution of each major factor in the
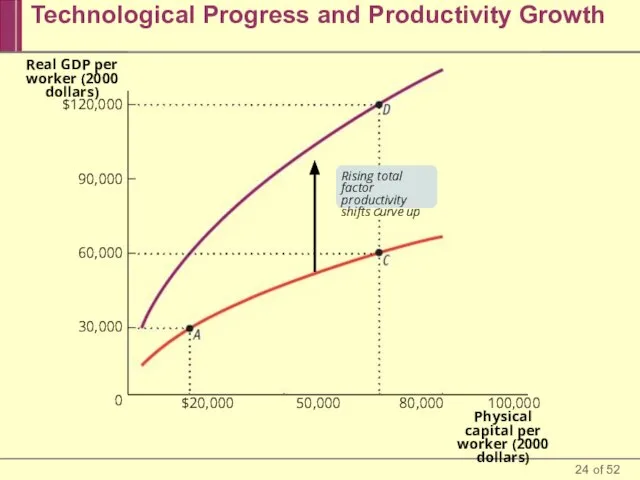
Слайд 24Technological Progress and Productivity Growth
$120,000
90,000
60,000
30,000
0
Real GDP per worker (2000 dollars)
$20,000 50,000 80,000
Technological Progress and Productivity Growth
$120,000
90,000
60,000
30,000
0
Real GDP per worker (2000 dollars)
$20,000 50,000 80,000
Слайд 25What about Natural Resources?
In contrast to earlier times, in the modern world,
What about Natural Resources?
In contrast to earlier times, in the modern world,
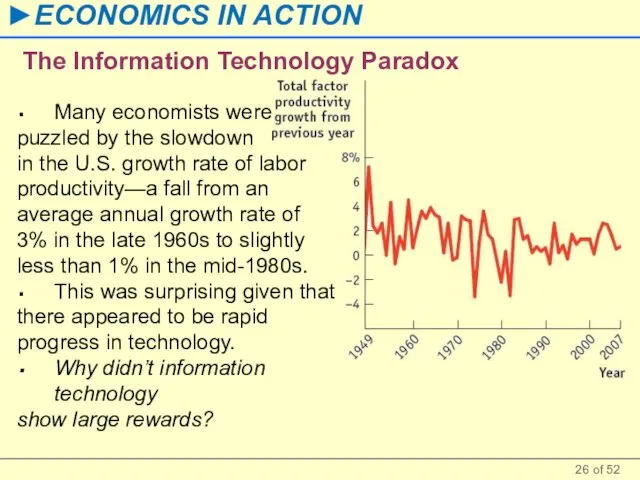
Слайд 26The Information Technology Paradox
Many economists were
puzzled by the slowdown
in the
The Information Technology Paradox
Many economists were
puzzled by the slowdown
in the
Слайд 27The Information Technology Paradox
MIT economics professor and Nobel laureate Robert Solow, a
The Information Technology Paradox
MIT economics professor and Nobel laureate Robert Solow, a
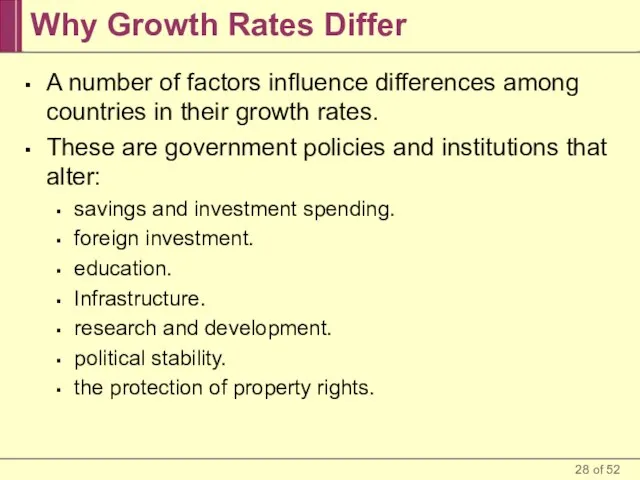
Слайд 28Why Growth Rates Differ
A number of factors influence differences among countries in
Why Growth Rates Differ
A number of factors influence differences among countries in
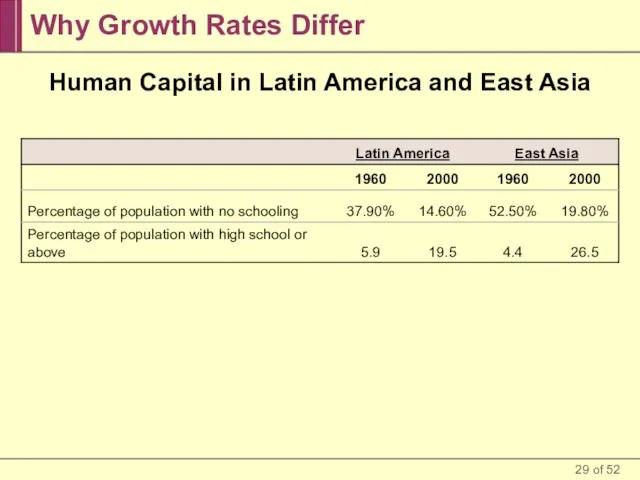
Слайд 29Why Growth Rates Differ
Human Capital in Latin America and East Asia
Why Growth Rates Differ
Human Capital in Latin America and East Asia
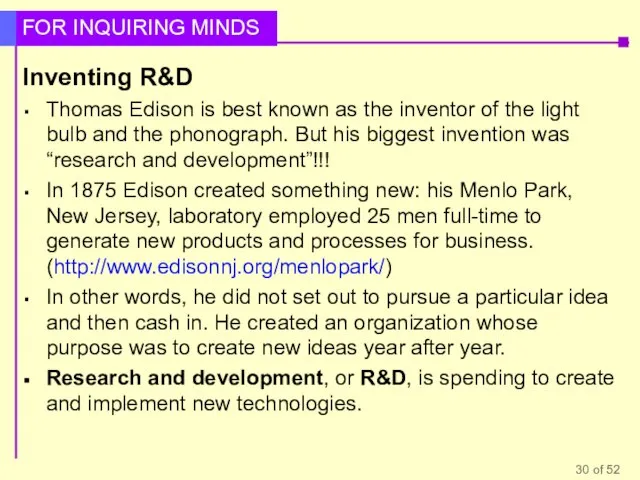
Слайд 30Inventing R&D
Thomas Edison is best known as the inventor of the light
Inventing R&D
Thomas Edison is best known as the inventor of the light
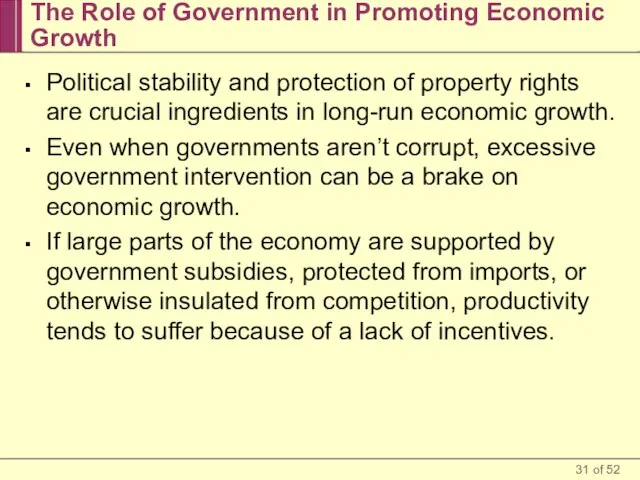
Слайд 31The Role of Government in Promoting Economic Growth
Political stability and protection of
The Role of Government in Promoting Economic Growth
Political stability and protection of
Слайд 32The Role of Government in Promoting Economic Growth
The Role of Government in Promoting Economic Growth

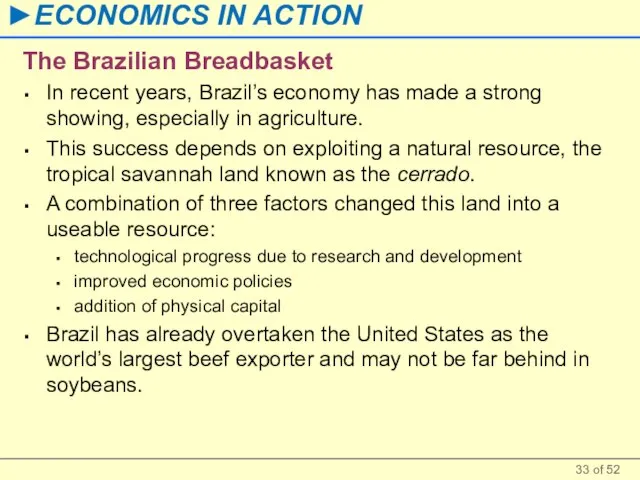
Слайд 33The Brazilian Breadbasket
In recent years, Brazil’s economy has made a strong showing,
The Brazilian Breadbasket
In recent years, Brazil’s economy has made a strong showing,
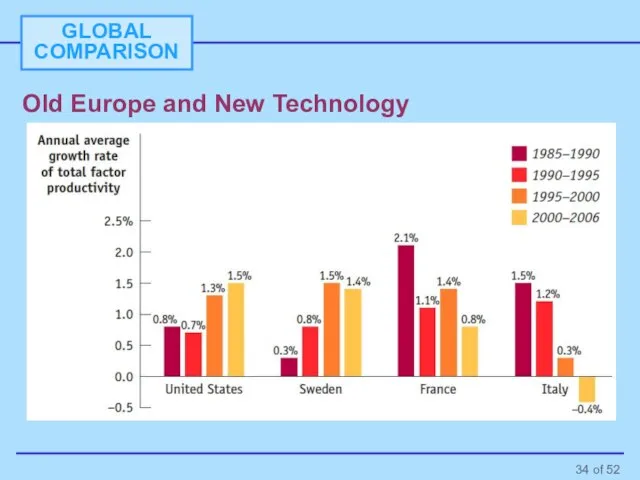
Слайд 34Old Europe and New Technology
Old Europe and New Technology
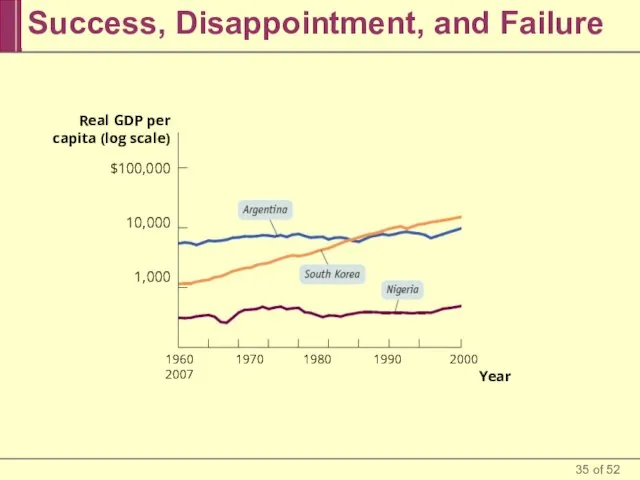
Слайд 35Success, Disappointment, and Failure
Real GDP per
capita (log scale)
1960 1970 1980 1990 2000
Success, Disappointment, and Failure
Real GDP per
capita (log scale)
1960 1970 1980 1990 2000
Слайд 36Success, Disappointment, and Failure
The world economy contains examples of success and failure
Success, Disappointment, and Failure
The world economy contains examples of success and failure
Слайд 37Success, Disappointment, and Failure
The growth rates of economically advanced countries have converged,
Success, Disappointment, and Failure
The growth rates of economically advanced countries have converged,
Слайд 38Are Economies Converging?
Are Economies Converging?
Слайд 39Success, Disappointment, and Failure
East Asia’s spectacular growth was generated by high savings
Success, Disappointment, and Failure
East Asia’s spectacular growth was generated by high savings
Слайд 40Is World Growth Sustainable?
Long-run economic growth is sustainable if it can continue
Is World Growth Sustainable?
Long-run economic growth is sustainable if it can continue
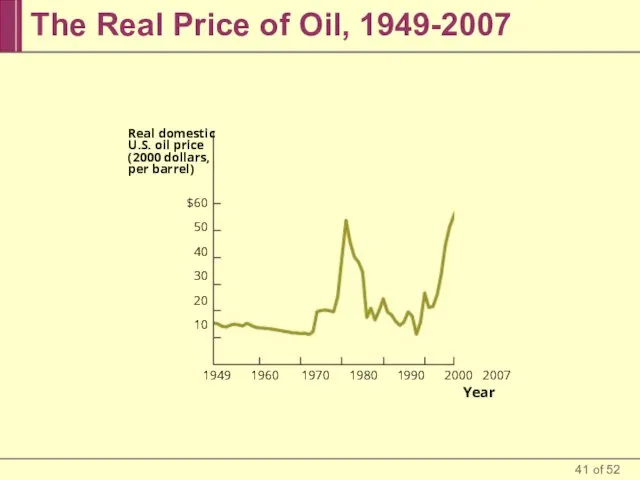
Слайд 41The Real Price of Oil, 1949-2007
Real domestic U.S. oil price
(2000 dollars, per
The Real Price of Oil, 1949-2007
Real domestic U.S. oil price
(2000 dollars, per
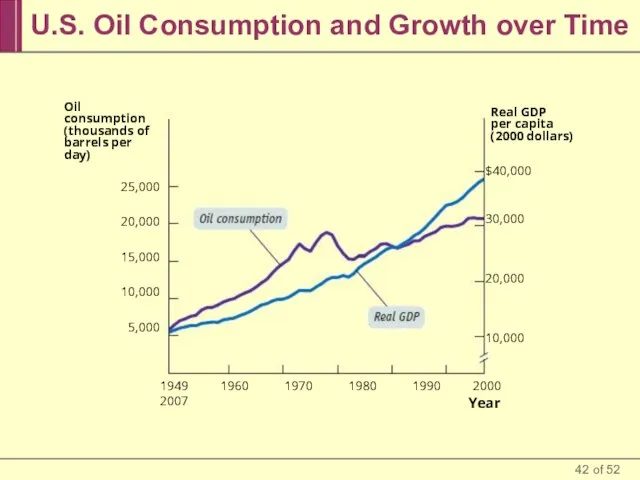
Слайд 42U.S. Oil Consumption and Growth over Time
Oil consumption
(thousands of
barrels per day)
1949 1960
U.S. Oil Consumption and Growth over Time
Oil consumption
(thousands of
barrels per day)
1949 1960
Слайд 43Economic Growth and the Environment
The limits to growth arising from environmental degradation
Economic Growth and the Environment
The limits to growth arising from environmental degradation
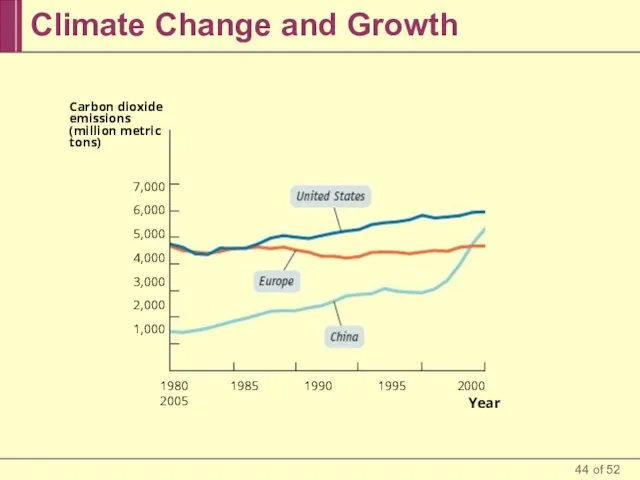
Слайд 44Climate Change and Growth
Carbon dioxide
emissions
(million metric tons)
1980 1985 1990 1995 2000 2005
Climate Change and Growth
Carbon dioxide
emissions
(million metric tons)
1980 1985 1990 1995 2000 2005
Слайд 45Economic Growth and the Environment
There is broad consensus that government action to
Economic Growth and the Environment
There is broad consensus that government action to
Слайд 46Growth is measured as changes in real GDP per capita in order
Growth is measured as changes in real GDP per capita in order
Слайд 47The key to long-run economic growth is rising labor productivity, or just
The key to long-run economic growth is rising labor productivity, or just
Слайд 48The large differences in countries’ growth rates are largely due to differences
The large differences in countries’ growth rates are largely due to differences
Слайд 49The world economy contains examples of success and failure in the effort
The world economy contains examples of success and failure in the effort
Слайд 50Economists generally believe that environmental degradation poses a greater problem for whether
Economists generally believe that environmental degradation poses a greater problem for whether
Слайд 51There is broad consensus that government action to address climate change and
There is broad consensus that government action to address climate change and

 День слепых
 Презентация на тему Алканы, алкены, алкины
 Менеджмент организации
 Встречное исключение участников общества
 Универсальные кухонные приводы
 Стили проектирования
 Тема проекта: Что важнее в авторской песне: текст или мелодия?
 Вид Зебра обыкновенная
 Жер бетіндегі биіктік негіздемені дамыту схемасы; жобаны жасау, алдын ала байқау, белгілерді бекіту
 Концепция естественнонаучного образования школьников
 Массив представляет собой совокупность данных одного типа с общим для всех элементов именем. Массив относится к структурированны
 Мои права и права других людей
 Коллективизация сельского хозяйства 1927 год
 Уфимский государственный авиационный технический университетИнститут физики перспективных материалов
 Telecommunications Каркин
 Оптимизационный пакет поправок в 44-ФЗ: Единые требования к извещению
 DELL’ОВЫЕ ПЕРСПЕКТИВЫ КОРПОРАТИВНЫХ ЗАКАЗЧИКОВСергей Сигарёв
 Понятие о документе. Свойства документа. Классификация документов. (Тема 2)
 Право получения стипендии. Сессия
 Семинар-практикум.«Методика администрирования web-сайтов»
 Вопрос 1
 Изготовление текстильной (авторской) куклы
 Christmas in Great Britain
 6_frantsuzskikh_osobennostey
 Инженерно-геодезические изыскания под реконструкцию здания дворца культуры г. Стерлитамак, Республика Башкортостан
 Итоговый конкурс проектов в РТУ МИРЭА - 2021
 Поговорим о беге…
 «Своя игра»