- Мониторинг и оценка региональных программ

Содержание
- 2. Outline Introduction Overview of Evaluation in Developed and Developing Countries Results-Based Monitoring and Evaluation (M&E) Approaches
- 3. Introduction: Importance of evaluation There are growing pressures in developing countries to improve performance of their
- 4. The Power of Measuring Results If you do not measure results, you cannot tell success from
- 5. Overview of Evaluation in Developed and Developing Countries
- 6. Evaluation in Developed Countries Most of the 32 OECD countries have mature M&E systems Earliest adopters
- 7. A Strong Evaluation Culture Exists when: Evaluation takes place in many policy domains Supply of evaluators
- 8. A Strong Evaluation Culture Exists when: (cont.) Institutional arrangements exist in government for conducting evaluations and
- 9. A Strong Evaluation Culture Exists when: (cont.) 7. An element of pluralism exists within each policy
- 10. Approaches Whole-of-Government Enclave Mixed
- 11. Whole-of-Government Approach Adopted in some early M&E pioneer countries Broad-based, comprehensive M&E at all levels of
- 12. Enclave Approach More limited, focus on one part or sector of government (a ministry or the
- 13. Mixed Approach Blended whole-of-government and enclave approaches Some areas have a comprehensive approach; others more sporadic
- 14. Evaluation in Developing Countries Face similar and different challenges Weak political will slows progress Difficulties in
- 15. Evaluation Systems in Developing Countries New evaluation systems need: political will in the government highly placed
- 16. Developing Countries Need to: Establish a foundation for evaluation statistical systems and data, as well as
- 17. Development Assistance Committee (DAC) Criteria for Evaluating Development Assistance Relevance Effectiveness Efficiency Impact Sustainability
- 18. Results-Based Monitoring and Evaluation
- 19. Results-Based Monitoring IPDET © 2012 Results-based monitoring (what we call “monitoring”) is a continuous process of
- 20. Results-Based Evaluation IPDET © 2012 Results-based evaluation is an assessment of a planned, ongoing, or completed
- 21. Difference between Results-Based Monitoring and Results-Based Evaluation IPDET © 2012 Monitoring: tracks movement of indicators towards
- 22. Brief Introduction to Theory of Change IPDET © 2012 Theory of change is a representation of
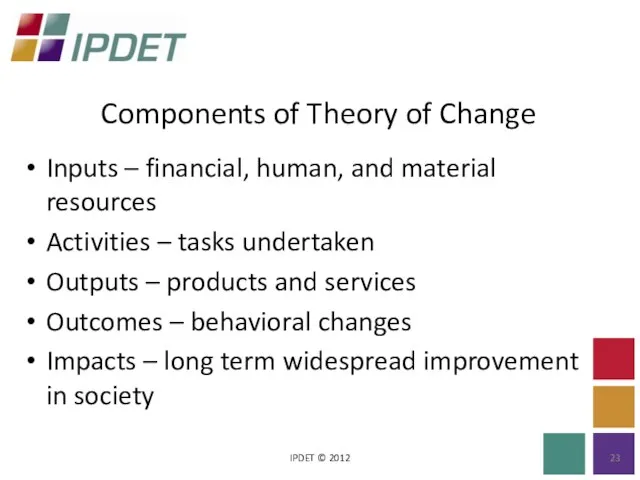
- 23. Components of Theory of Change IPDET © 2012 Inputs – financial, human, and material resources Activities
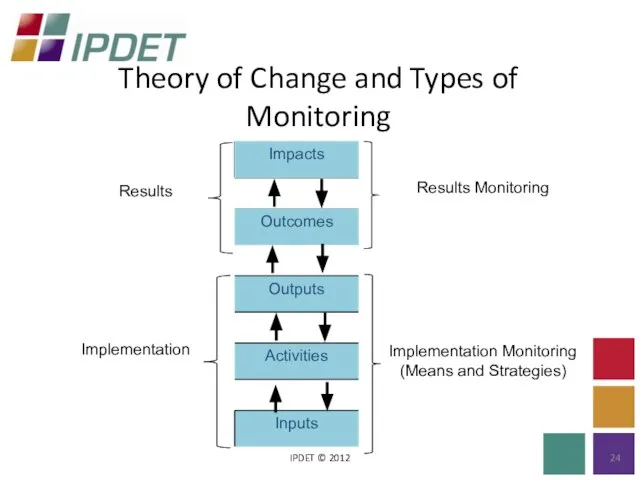
- 24. Theory of Change and Types of Monitoring IPDET © 2012
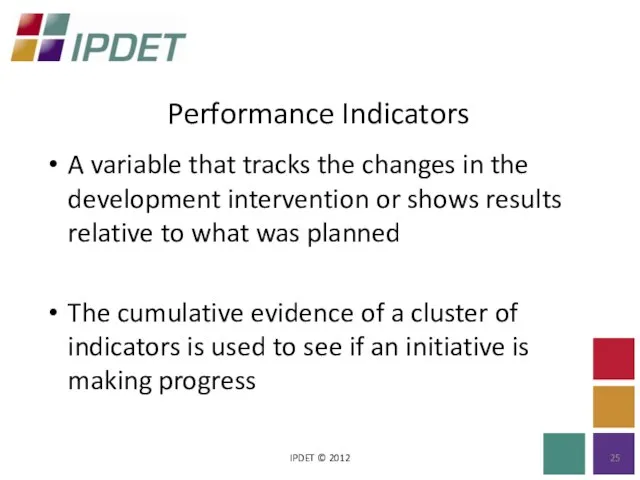
- 25. Performance Indicators IPDET © 2012 A variable that tracks the changes in the development intervention or
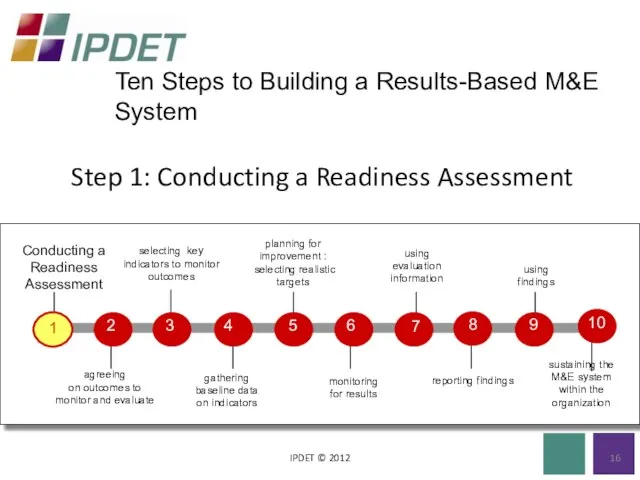
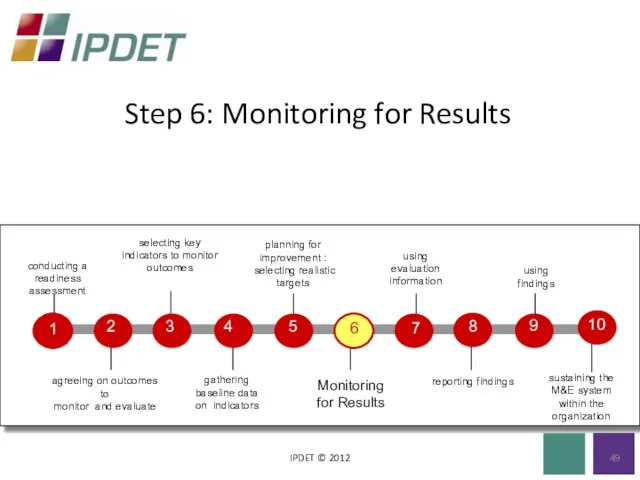
- 26. Step 1: Conducting a Readiness Assessment IPDET © 2012 16 Ten Steps to Building a Results-Based
- 27. What Is a Readiness Assessment? IPDET © 2012 A systematic approach to determine the capacity and
- 28. Incentives IPDET © 2012 Sort out the answers to these questions: What is driving the need
- 29. Barriers to M&E IPDET © 2012 Do any of the following present barriers to building an
- 30. Step 2: Agreeing on Outcomes to Monitor and Evaluate IPDET © 2012
- 31. Why an Emphasis on Outcomes? IPDET © 2012 Makes explicit the intended objectives of government action
- 32. Developing Outcomes for One Policy Area: Education IPDET © 2012
- 33. Outcomes: IPDET © 2012 Outcomes are usually not directly measured — only reported on Outcomes must
- 34. Step 3: Selecting Key Indicators to Monitor Outcomes IPDET © 2012
- 35. Results Indicator IPDET © 2012 A specific variable, that when tracked systematically over time, indicates progress
- 36. Indicator Development IPDET © 2012 “CREAM” Clear Relevant Economic Adequate Monitorable
- 37. Matrix for Building/Using Indicators IPDET © 2012
- 38. Developing Set of Outcome Indicators for One Policy Area: Education IPDET © 2012
- 39. Developing Indicators IPDET © 2012 Develop your own indicators to meet your needs Developing good indicators
- 40. Step 4: Gathering Baseline Data on Indicators IPDET © 2012
- 41. Baseline Data and Sources IPDET © 2012 Baseline data: Measurements to find out - where are
- 42. IPDET © 2012
- 43. Continuing Example, Developing Baseline Data for One Policy Area: Education IPDET © 2012
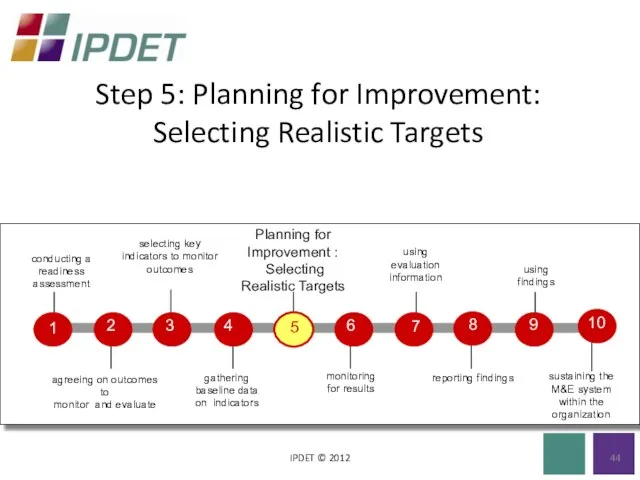
- 44. Step 5: Planning for Improvement: Selecting Realistic Targets IPDET © 2012
- 45. Targets: IPDET © 2012 The quantifiable levels of the indicators that a country or organization wants
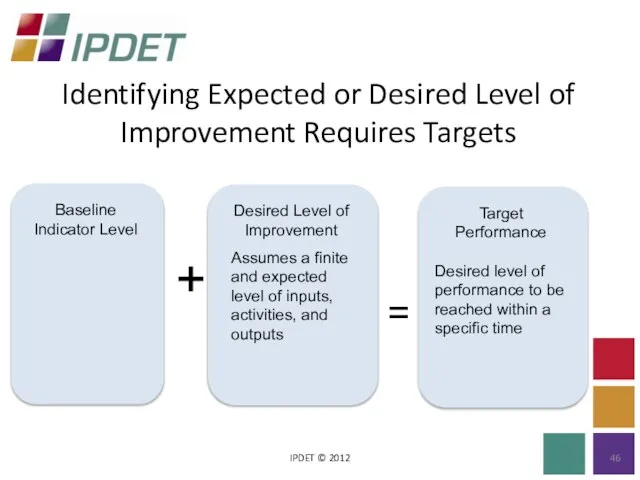
- 46. Identifying Expected or Desired Level of Improvement Requires Targets IPDET © 2012 + =
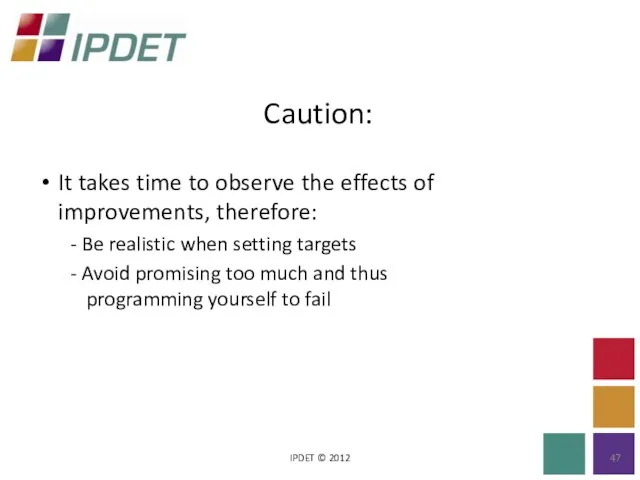
- 47. Caution: IPDET © 2012 It takes time to observe the effects of improvements, therefore: - Be
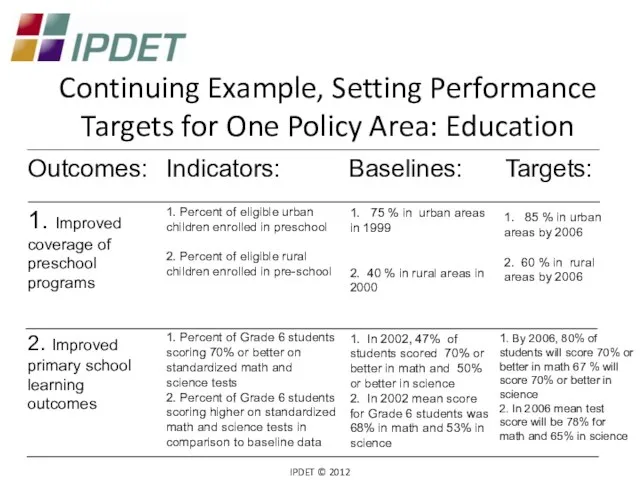
- 48. Continuing Example, Setting Performance Targets for One Policy Area: Education IPDET © 2012
- 49. Step 6: Monitoring for Results IPDET © 2012
- 50. Key Types of Monitoring IPDET © 2012
- 51. Implementation Monitoring Links to Results Monitoring IPDET © 2012
- 52. IPDET © 2012
- 53. Successful Monitoring Systems IPDET © 2012 To be successful, every monitoring system needs the following: ownership
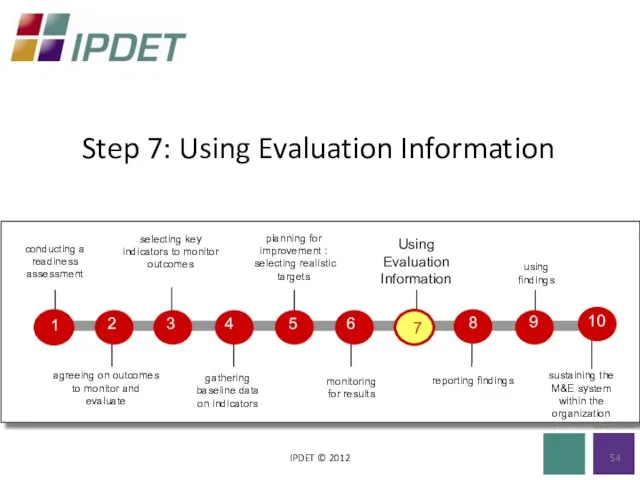
- 54. Step 7: Using Evaluation Information IPDET © 2012
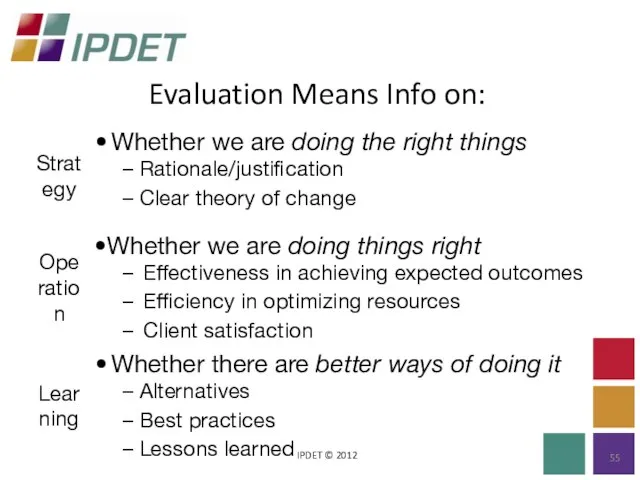
- 55. Evaluation Means Info on: IPDET © 2012
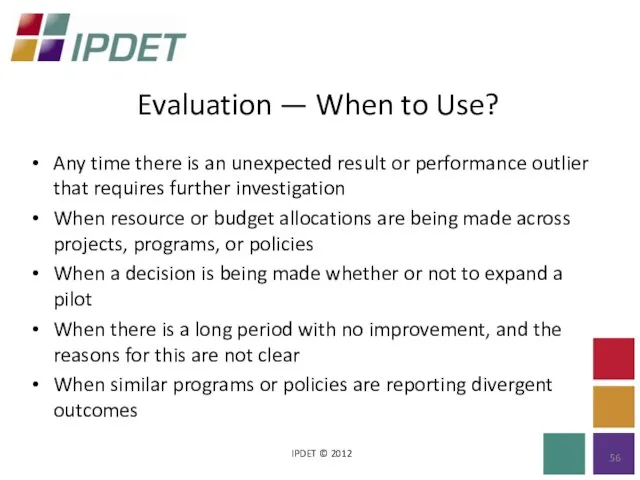
- 56. Evaluation — When to Use? IPDET © 2012 Any time there is an unexpected result or
- 57. Step 8: Reporting Findings IPDET © 2012
- 58. Reporting Findings IPDET © 2012 Provides information on status of projects, programs, and policies Yields clues
- 59. When Analyzing and Presenting Data: IPDET © 2012 Compare indicator data with the baseline and targets,
- 60. When Analyzing and Presenting Data: (cont.) IPDET © 2012 Protect the messenger: people who deliver bad
- 61. Step 9: Using Findings IPDET © 201
- 62. Ten Uses of Results Findings IPDET © 2012 Responds to elected officials’ and the public’s demands
- 63. Ten Uses of Results Findings (cont.) IPDET © 2012 Monitors the project or program performance against
- 64. Step 10: Sustaining the M&E System within the Organization IPDET © 2012
- 65. Critical Components Crucial to Sustaining IPDET © 2012 Demand Clear roles and responsibilities Trustworthy and credible
- 66. Concluding Comments IPDET © 2012 The demand for capacity building never ends! The only way an
- 67. Concluding Comments (cont.) IPDET © 2012 Begin with pilot efforts to demonstrate effective results-based monitoring and
- 68. Approaches to Evaluation
- 69. What is the evaluation approach? The systematic application of social research procedures for assessing the conceptualization,
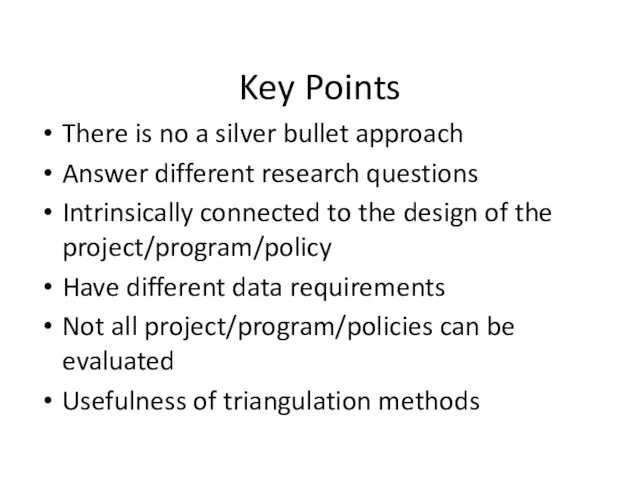
- 70. Key Points There is no a silver bullet approach Answer different research questions Intrinsically connected to
- 71. Four Main Evaluation Approaches Impact Evaluation Outcome-Based Evaluation Monitoring/Process Evaluation Participatory Evaluation
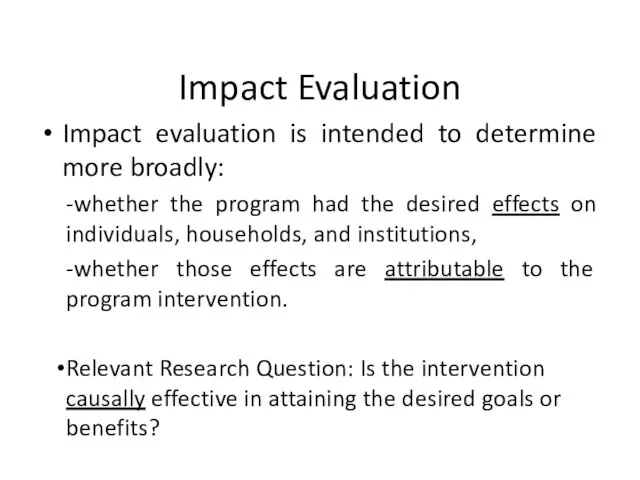
- 72. Impact Evaluation Impact evaluation is intended to determine more broadly: -whether the program had the desired
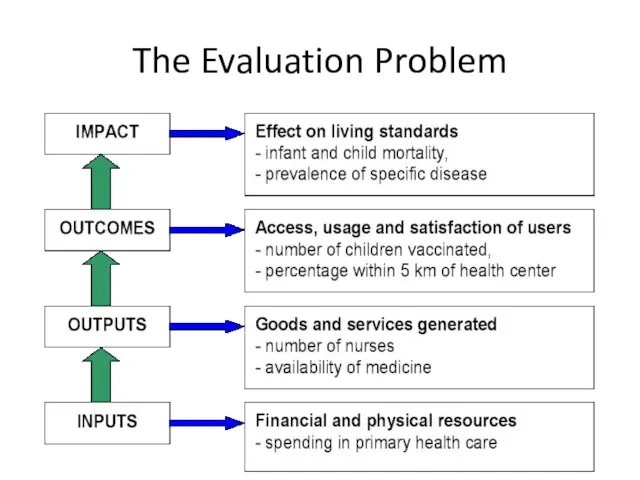
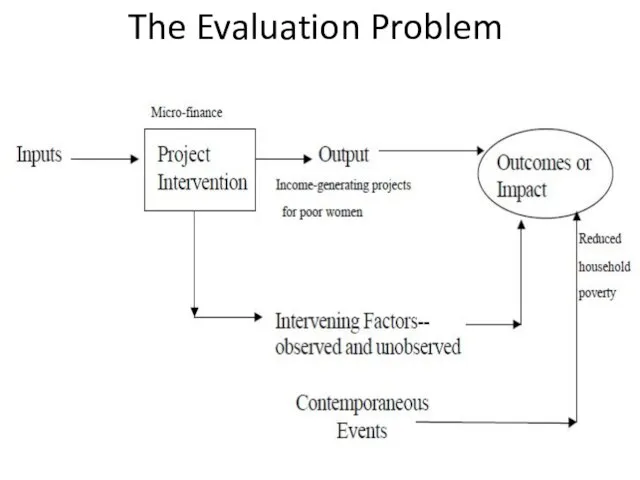
- 73. The Evaluation Problem
- 74. The Evaluation Problem
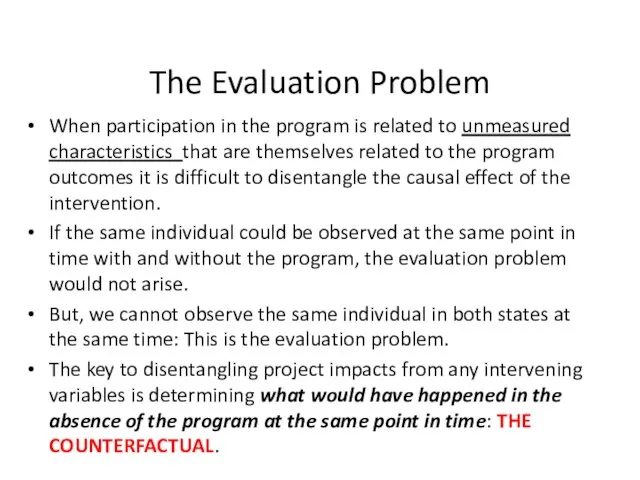
- 75. The Evaluation Problem When participation in the program is related to unmeasured characteristics that are themselves
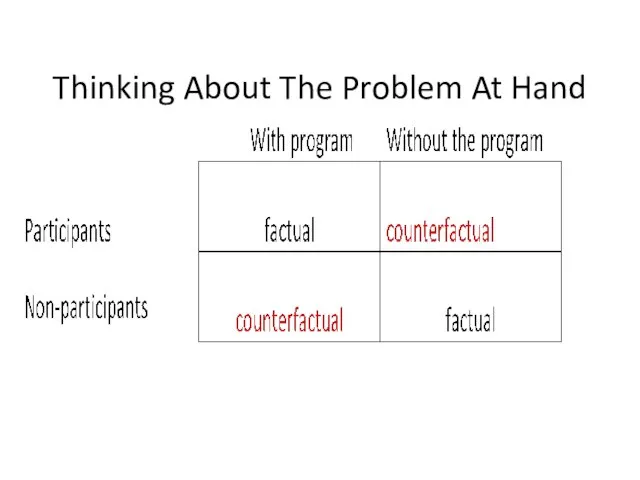
- 76. Thinking About The Problem At Hand
- 77. Defining Counterfactuals Determining the counterfactual is at the core of impact evaluation Use control or comparison
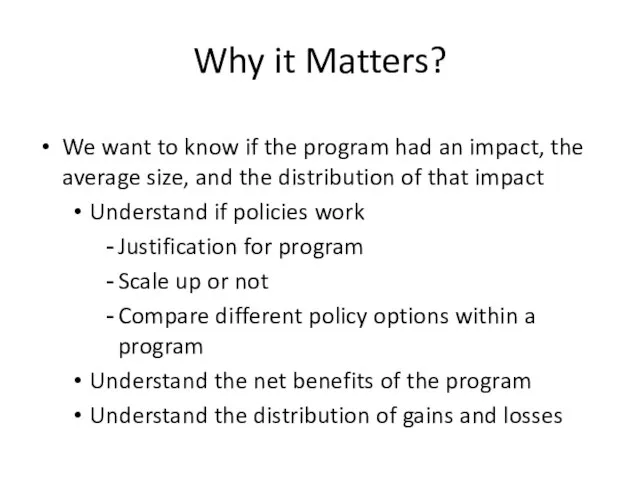
- 78. Why it Matters? We want to know if the program had an impact, the average size,
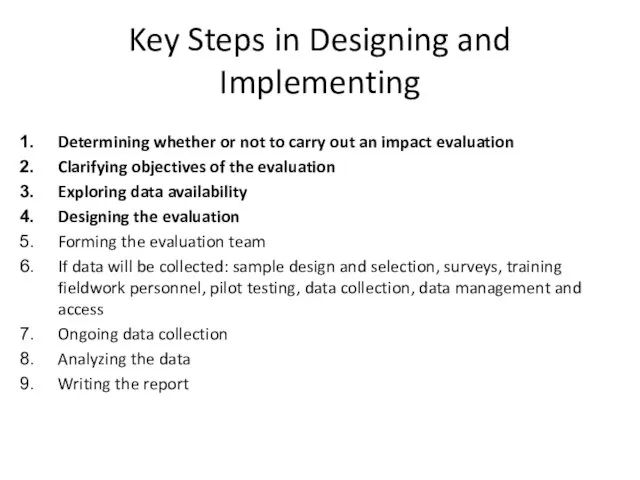
- 79. Key Steps in Designing and Implementing Determining whether or not to carry out an impact evaluation
- 80. Determining Whether Or Not To Carry Out An Impact Evaluation Cost and benefits should be assessed
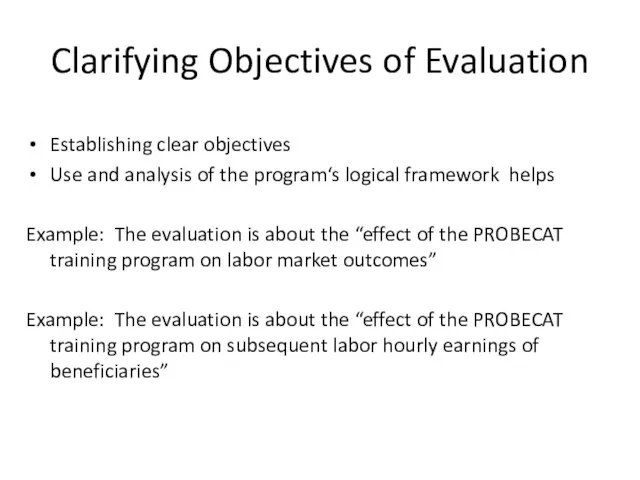
- 81. Clarifying Objectives of Evaluation Establishing clear objectives Use and analysis of the program‘s logical framework helps
- 82. Data Availability Know the institutions of the program well. Collect information on the relevant “stylized facts”
- 83. Designing The Evaluation Know the institutions of the program well. Defined the evaluation question(s) (unit of
- 84. Impact Evaluation Example: PROGRESA PROGRESA is the principal antipoverty strategy of the Mexican government Large program
- 85. PROGRESA’S Goals Long-run poverty alleviation - Investment in human capital - Education - Health - Nutrition
- 86. Features & Institutions Conditional cash transfers given to mothers (why?) Simultaneous and targeted intervention in 3
- 87. Overall Program Benefits Beneficiary households receive on average 200 pesos per month -22% increase in the
- 88. Evaluation Framework
- 89. Evaluation Framework This is a three-step process: Identification of marginalized localities using marginality index (geographic targeting)
- 90. Evaluation Framework Program randomized at the locality level Sample of 506 localities -186 control (no PROGRESA)
- 91. PROGRESA Evaluation Surveys/Data BEFORE initiation of program October/November 97: Household census used for selecting program beneficiaries
- 92. Evaluation Research Questions: Education Component Are more children attending school because of PROGRESA? Does PROGRESA have
- 93. Evaluation Results: Education Positive effect on school attendance of boys and girls in primary and secondary
- 94. Evaluation Research Questions: Health Does PROGRESA increase visits to public health clinics? Does PROGRESA have an
- 95. Evaluation Results: Health Significant increase in visit rates -Nutrition monitoring visits -Immunization rates -Prenatal care in
- 96. Evaluation Research Questions: Nutrition Does PROGRESA impact child growth? Does PROGRESA impact household consumption and food
- 97. Evaluation Results: Nutrition Significant effect in increasing child growth (1cm higher growth) Significant effect in reducing
- 98. (2) Outcome-Based Evaluation
- 99. Basic Definitions Outcome-based evaluation is a systematic way to assess the extent to which a program
- 100. Why It Matters? Contribute to program effectiveness Provide a logical framework for program development Generate information
- 101. But Unlike Impact Evaluation It does not prove cause and effect, only suggest a cause and
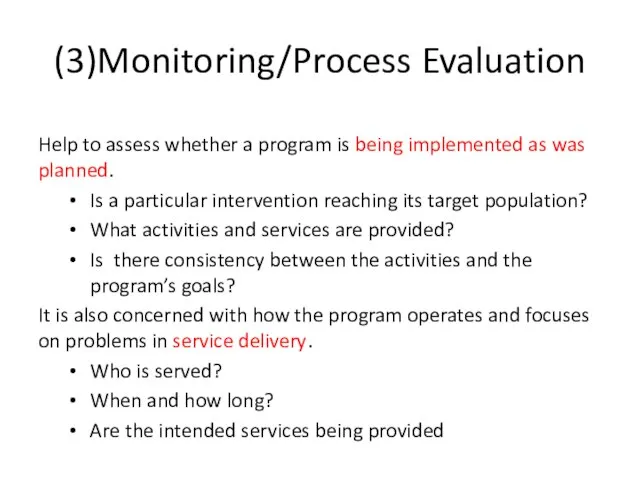
- 102. (3)Monitoring/Process Evaluation Help to assess whether a program is being implemented as was planned. Is a
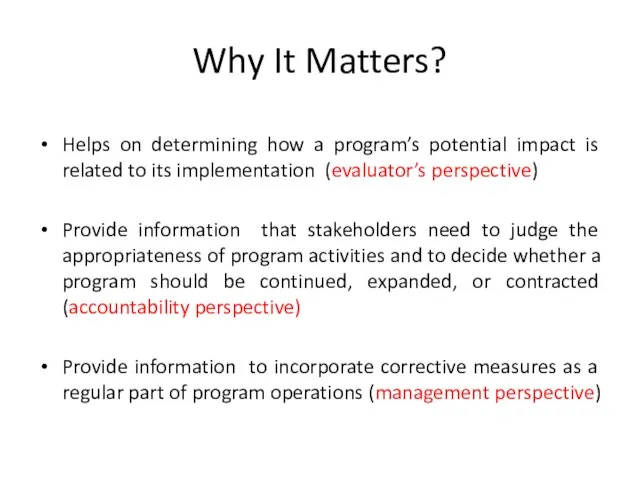
- 103. Why It Matters? Helps on determining how a program’s potential impact is related to its implementation
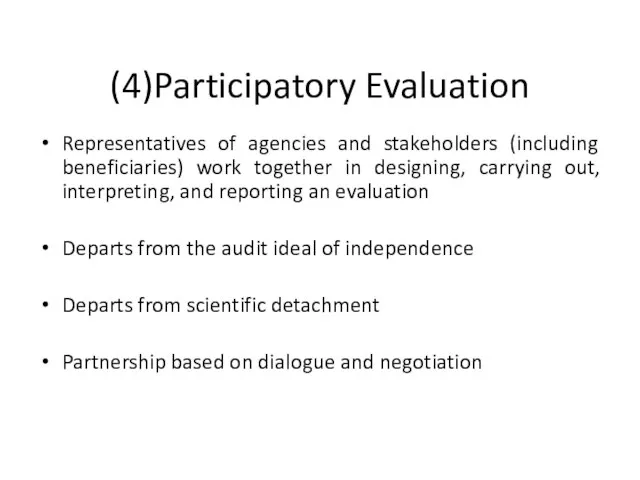
- 104. (4)Participatory Evaluation Representatives of agencies and stakeholders (including beneficiaries) work together in designing, carrying out, interpreting,
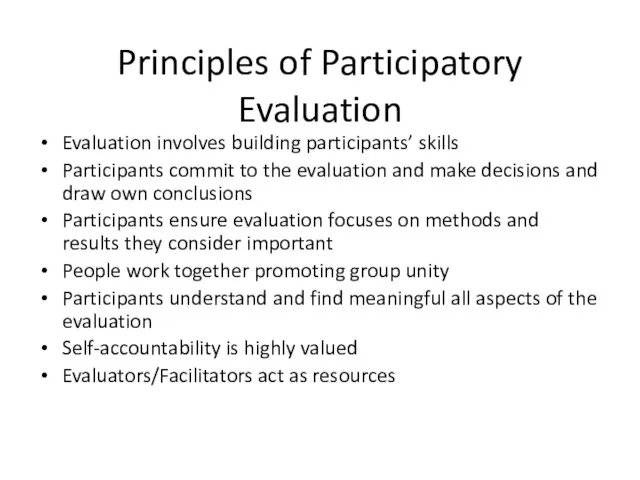
- 105. Principles of Participatory Evaluation Evaluation involves building participants’ skills Participants commit to the evaluation and make
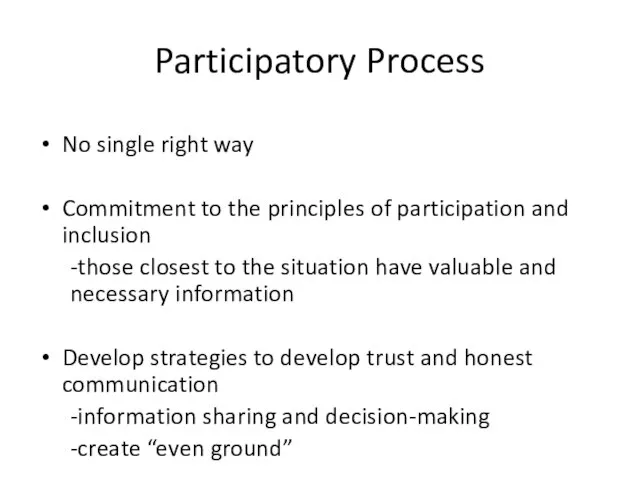
- 106. Participatory Process No single right way Commitment to the principles of participation and inclusion -those closest
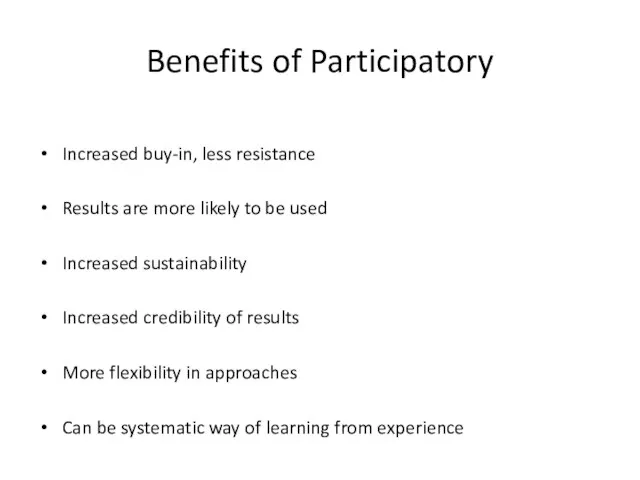
- 107. Benefits of Participatory Increased buy-in, less resistance Results are more likely to be used Increased sustainability
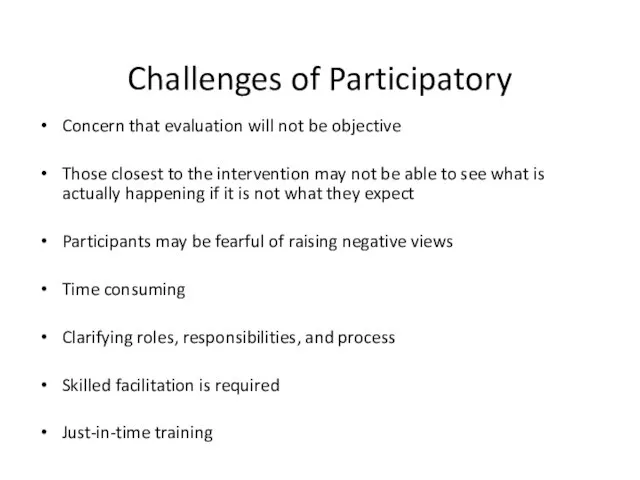
- 108. Challenges of Participatory Concern that evaluation will not be objective Those closest to the intervention may
- 110. Скачать презентацию
Слайд 2Outline
Introduction
Overview of Evaluation in Developed and Developing Countries
Results-Based Monitoring and
Outline
Introduction
Overview of Evaluation in Developed and Developing Countries
Results-Based Monitoring and
Слайд 3Introduction:
Importance of evaluation
There are growing pressures in developing countries to improve
Introduction:
Importance of evaluation
There are growing pressures in developing countries to improve
Слайд 4The Power of Measuring Results
If you do not measure results, you cannot
The Power of Measuring Results
If you do not measure results, you cannot
Слайд 5Overview of Evaluation in Developed and Developing Countries
Слайд 6Evaluation in Developed Countries
Most of the 32 OECD countries have mature M&E
Evaluation in Developed Countries
Most of the 32 OECD countries have mature M&E
Слайд 7A Strong Evaluation Culture Exists when:
Evaluation takes place in many policy domains
Supply
A Strong Evaluation Culture Exists when:
Evaluation takes place in many policy domains
Supply
Слайд 8A Strong Evaluation Culture Exists when: (cont.)
Institutional arrangements exist in government for
A Strong Evaluation Culture Exists when: (cont.)
Institutional arrangements exist in government for
Слайд 9A Strong Evaluation Culture Exists when: (cont.)
7. An element of pluralism exists within
A Strong Evaluation Culture Exists when: (cont.)
7. An element of pluralism exists within
Слайд 10Approaches
Whole-of-Government
Enclave
Mixed
Approaches
Whole-of-Government
Enclave
Mixed
Слайд 11Whole-of-Government Approach
Adopted in some early M&E pioneer countries
Broad-based, comprehensive M&E at all
Whole-of-Government Approach
Adopted in some early M&E pioneer countries
Broad-based, comprehensive M&E at all

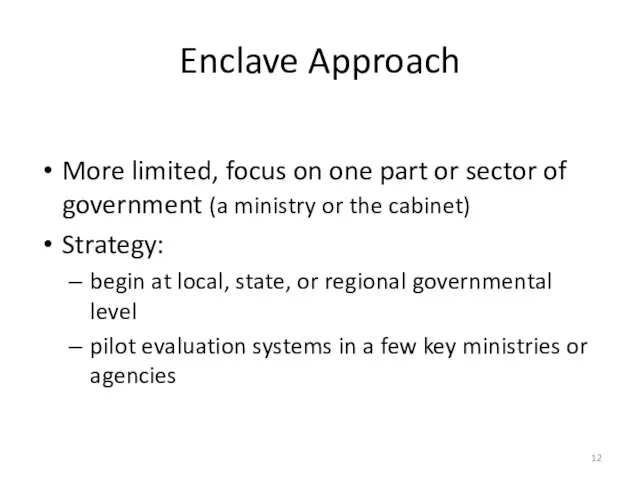
Слайд 12Enclave Approach
More limited, focus on one part or sector of government (a
Enclave Approach
More limited, focus on one part or sector of government (a
Слайд 13Mixed Approach
Blended whole-of-government and enclave approaches
Some areas have a comprehensive approach; others
Mixed Approach
Blended whole-of-government and enclave approaches
Some areas have a comprehensive approach; others
Слайд 14Evaluation in Developing Countries
Face similar and different challenges
Weak political will slows progress
Difficulties
Evaluation in Developing Countries
Face similar and different challenges
Weak political will slows progress
Difficulties
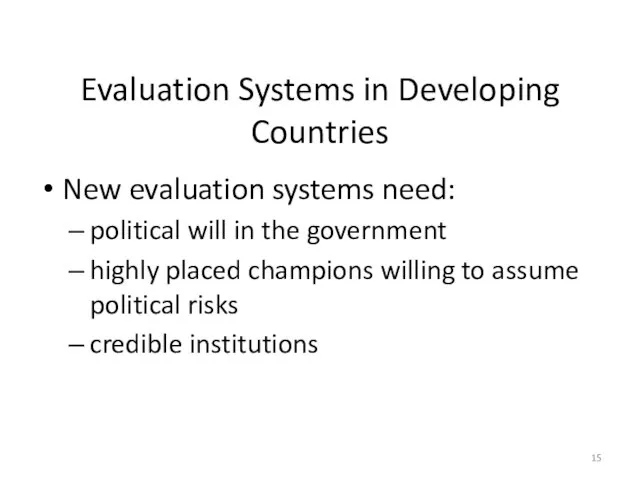
Слайд 15Evaluation Systems in Developing Countries
New evaluation systems need:
political will in the government
highly
Evaluation Systems in Developing Countries
New evaluation systems need:
political will in the government
highly
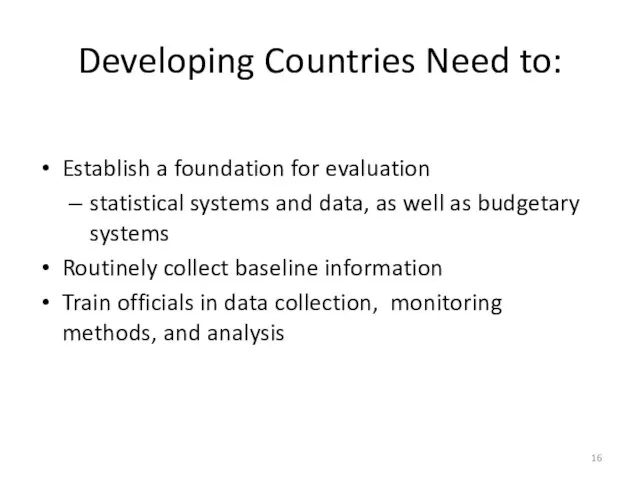
Слайд 16Developing Countries Need to:
Establish a foundation for evaluation
statistical systems and data, as
Developing Countries Need to:
Establish a foundation for evaluation
statistical systems and data, as
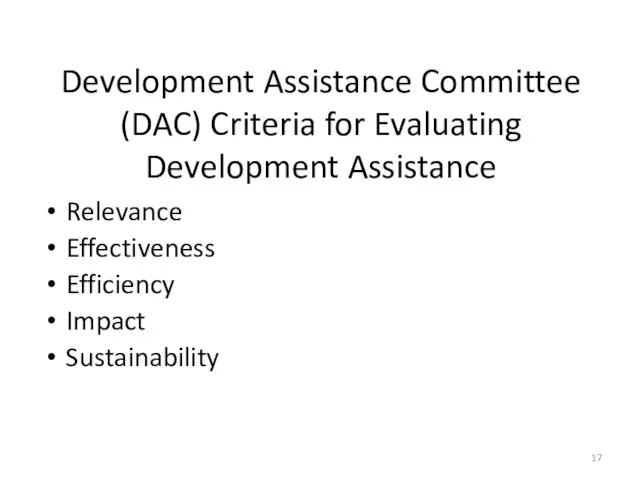
Слайд 17Development Assistance Committee (DAC) Criteria for Evaluating Development Assistance
Relevance
Effectiveness
Efficiency
Impact
Sustainability
Development Assistance Committee (DAC) Criteria for Evaluating Development Assistance
Relevance
Effectiveness
Efficiency
Impact
Sustainability
Слайд 18Results-Based Monitoring and Evaluation
Слайд 19Results-Based Monitoring
IPDET © 2012
Results-based monitoring (what we call “monitoring”) is a continuous
Results-Based Monitoring
IPDET © 2012
Results-based monitoring (what we call “monitoring”) is a continuous
Слайд 20Results-Based Evaluation
IPDET © 2012
Results-based evaluation is an assessment of a planned, ongoing,
Results-Based Evaluation
IPDET © 2012
Results-based evaluation is an assessment of a planned, ongoing,
Слайд 21Difference between Results-Based Monitoring and Results-Based Evaluation
IPDET © 2012
Monitoring: tracks movement of
Difference between Results-Based Monitoring and Results-Based Evaluation
IPDET © 2012
Monitoring: tracks movement of
Слайд 22Brief Introduction to Theory of Change
IPDET © 2012
Theory of change is a
Brief Introduction to Theory of Change
IPDET © 2012
Theory of change is a
Слайд 23Components of Theory of Change
IPDET © 2012
Inputs – financial, human, and material
Components of Theory of Change
IPDET © 2012
Inputs – financial, human, and material
Слайд 24Theory of Change and Types of Monitoring
IPDET © 2012
Theory of Change and Types of Monitoring
IPDET © 2012
Слайд 25Performance Indicators
IPDET © 2012
A variable that tracks the changes in the development
Performance Indicators
IPDET © 2012
A variable that tracks the changes in the development
Слайд 26Step 1: Conducting a Readiness Assessment
IPDET © 2012
16
Ten Steps to Building a
Step 1: Conducting a Readiness Assessment
IPDET © 2012
16
Ten Steps to Building a
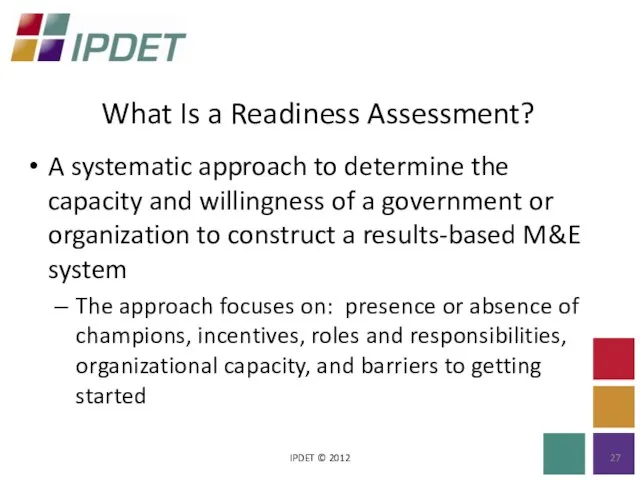
Слайд 27What Is a Readiness Assessment?
IPDET © 2012
A systematic approach to determine the
What Is a Readiness Assessment?
IPDET © 2012
A systematic approach to determine the
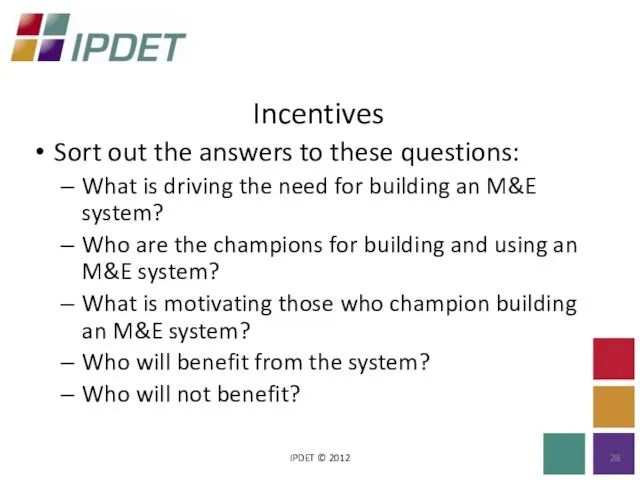
Слайд 28Incentives
IPDET © 2012
Sort out the answers to these questions:
What is driving the
Incentives
IPDET © 2012
Sort out the answers to these questions:
What is driving the
Слайд 29Barriers to M&E
IPDET © 2012
Do any of the following present barriers to
Barriers to M&E
IPDET © 2012
Do any of the following present barriers to

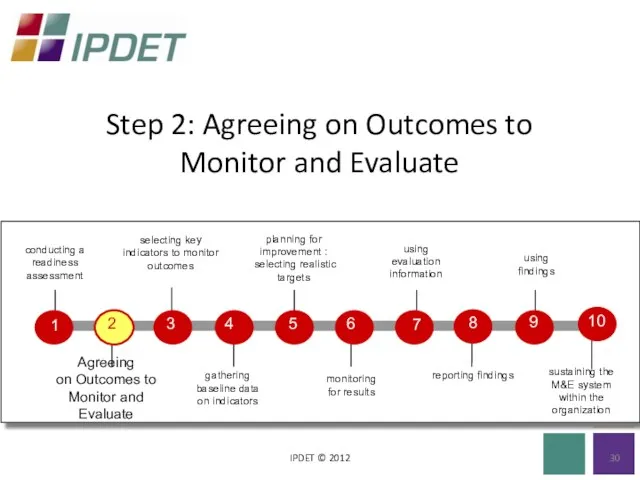
Слайд 30Step 2: Agreeing on Outcomes to Monitor and Evaluate
IPDET © 2012
Step 2: Agreeing on Outcomes to Monitor and Evaluate
IPDET © 2012
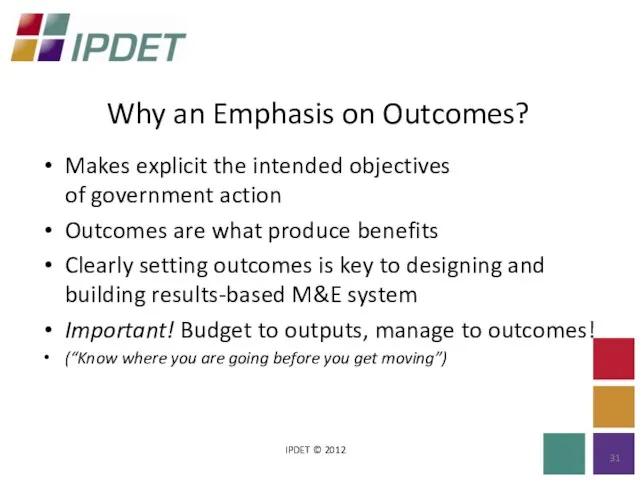
Слайд 31Why an Emphasis on Outcomes?
IPDET © 2012
Makes explicit the intended objectives
of
Why an Emphasis on Outcomes?
IPDET © 2012
Makes explicit the intended objectives of
Слайд 32Developing Outcomes for One Policy Area: Education
IPDET © 2012
Developing Outcomes for One Policy Area: Education
IPDET © 2012
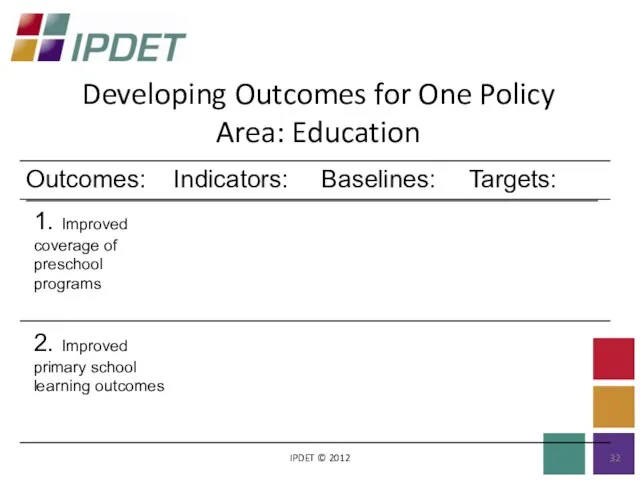
Слайд 33Outcomes:
IPDET © 2012
Outcomes are usually not directly measured — only reported on
Outcomes
Outcomes:
IPDET © 2012
Outcomes are usually not directly measured — only reported on
Outcomes
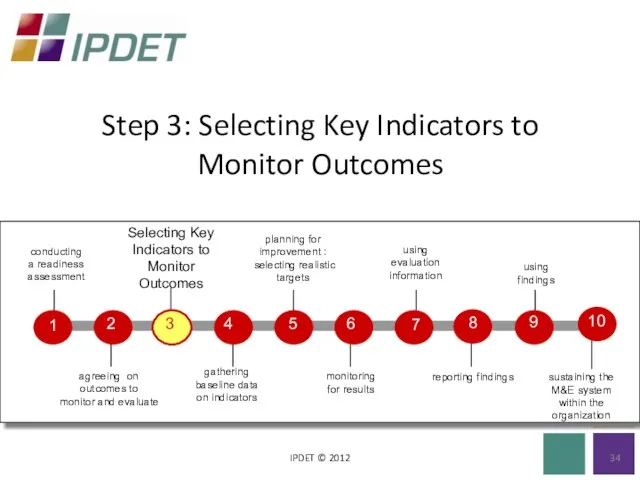
Слайд 34Step 3: Selecting Key Indicators to Monitor Outcomes
IPDET © 2012
Step 3: Selecting Key Indicators to Monitor Outcomes
IPDET © 2012
Слайд 35Results Indicator
IPDET © 2012
A specific variable, that when tracked systematically over time,
Results Indicator
IPDET © 2012
A specific variable, that when tracked systematically over time,
Слайд 36Indicator Development
IPDET © 2012
“CREAM”
Clear
Relevant
Economic
Adequate
Monitorable
Indicator Development
IPDET © 2012
“CREAM”
Clear
Relevant
Economic
Adequate
Monitorable
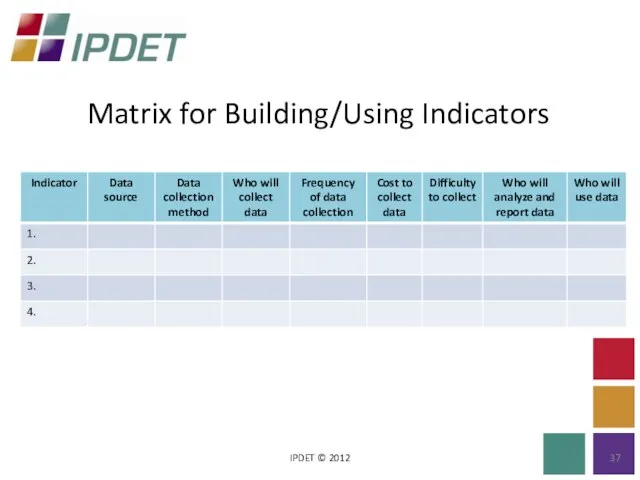
Слайд 37Matrix for Building/Using Indicators
IPDET © 2012
Matrix for Building/Using Indicators
IPDET © 2012
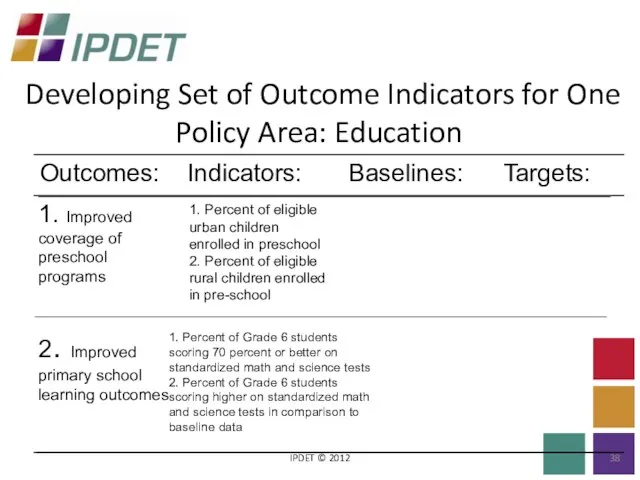
Слайд 38Developing Set of Outcome Indicators for One Policy Area: Education
IPDET © 2012
Developing Set of Outcome Indicators for One Policy Area: Education
IPDET © 2012
Слайд 39Developing Indicators
IPDET © 2012
Develop your own indicators to meet your needs
Developing good
Developing Indicators
IPDET © 2012
Develop your own indicators to meet your needs
Developing good
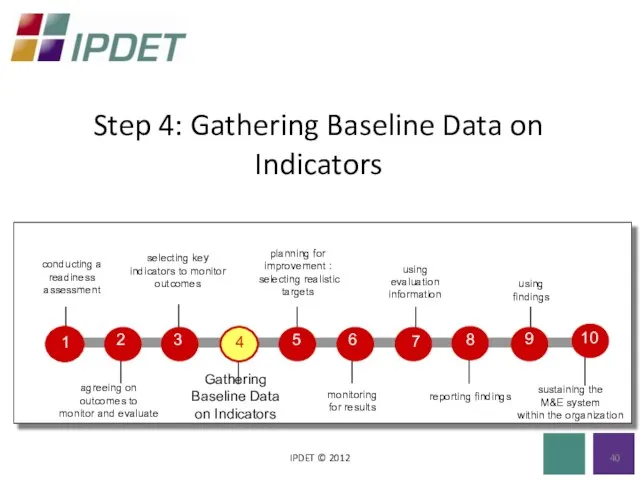
Слайд 40Step 4: Gathering Baseline Data on Indicators
IPDET © 2012
Step 4: Gathering Baseline Data on Indicators
IPDET © 2012
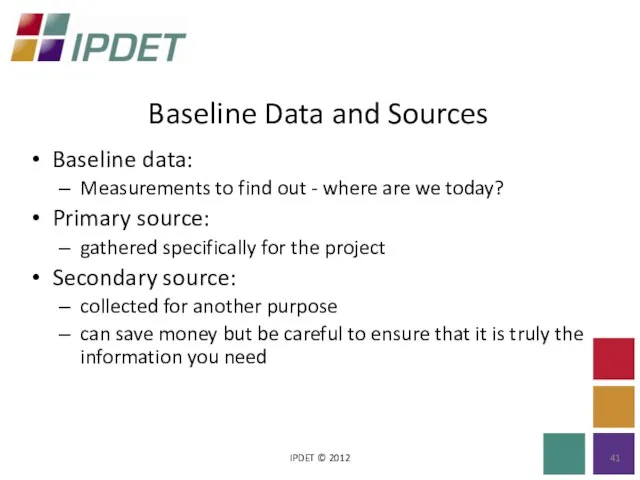
Слайд 41Baseline Data and Sources
IPDET © 2012
Baseline data:
Measurements to find out - where
Baseline Data and Sources
IPDET © 2012
Baseline data:
Measurements to find out - where
Слайд 42IPDET © 2012
IPDET © 2012
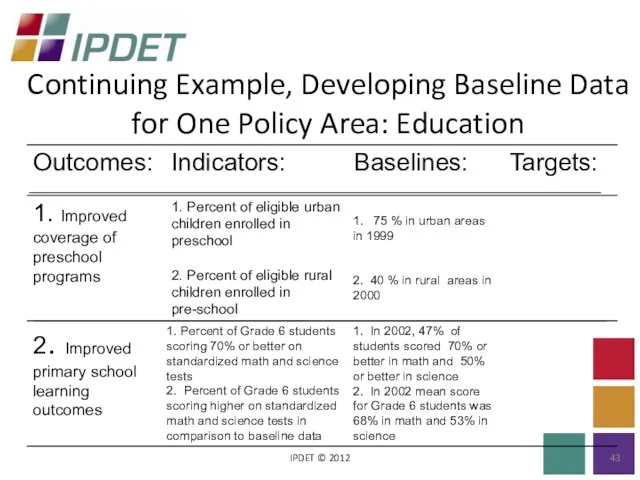
Слайд 43Continuing Example, Developing Baseline Data for One Policy Area: Education
IPDET © 2012
Continuing Example, Developing Baseline Data for One Policy Area: Education
IPDET © 2012
Слайд 44Step 5: Planning for Improvement: Selecting Realistic Targets
IPDET © 2012
Step 5: Planning for Improvement: Selecting Realistic Targets
IPDET © 2012
Слайд 45Targets:
IPDET © 2012
The quantifiable levels of the indicators that a country or
Targets:
IPDET © 2012
The quantifiable levels of the indicators that a country or

Слайд 46Identifying Expected or Desired Level of Improvement Requires Targets
IPDET © 2012
+
=
Identifying Expected or Desired Level of Improvement Requires Targets
IPDET © 2012
+
=
Слайд 47Caution:
IPDET © 2012
It takes time to observe the effects of improvements, therefore:
-
Caution:
IPDET © 2012
It takes time to observe the effects of improvements, therefore:
-
Слайд 48Continuing Example, Setting Performance Targets for One Policy Area: Education
IPDET © 2012
Continuing Example, Setting Performance Targets for One Policy Area: Education
IPDET © 2012
Слайд 49Step 6: Monitoring for Results
IPDET © 2012
Step 6: Monitoring for Results
IPDET © 2012
Слайд 50Key Types of Monitoring
IPDET © 2012
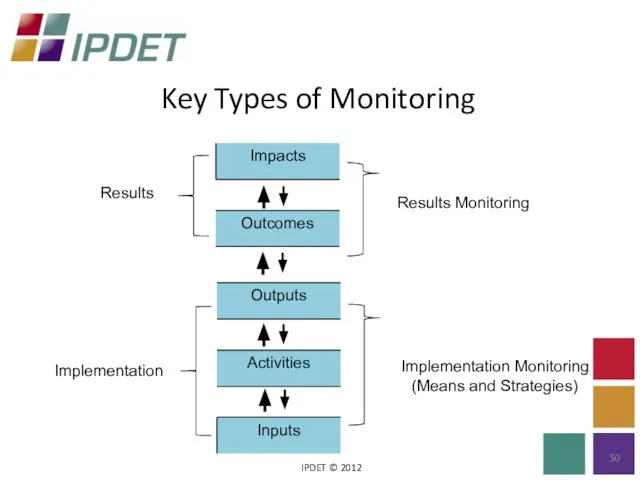
Key Types of Monitoring
IPDET © 2012
Слайд 51Implementation Monitoring Links to Results Monitoring
IPDET © 2012
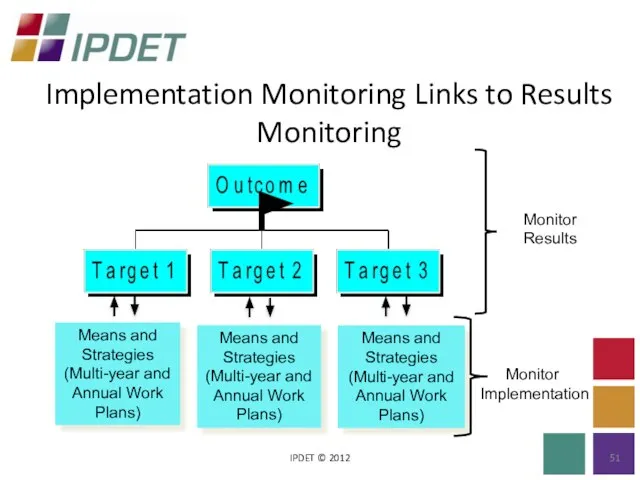
Implementation Monitoring Links to Results Monitoring
IPDET © 2012
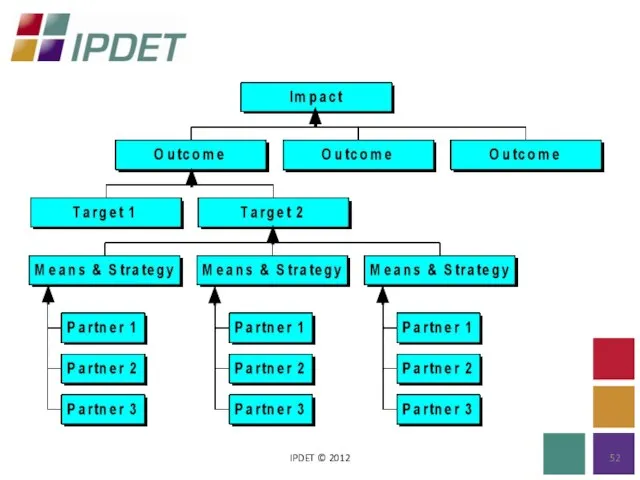
Слайд 52IPDET © 2012
IPDET © 2012
Слайд 53Successful Monitoring Systems
IPDET © 2012
To be successful, every monitoring system needs the
Successful Monitoring Systems
IPDET © 2012
To be successful, every monitoring system needs the
Слайд 54Step 7: Using Evaluation Information
IPDET © 2012
Step 7: Using Evaluation Information
IPDET © 2012
Слайд 55Evaluation Means Info on:
IPDET © 2012
Evaluation Means Info on:
IPDET © 2012
Слайд 56Evaluation — When to Use?
IPDET © 2012
Any time there is an unexpected
Evaluation — When to Use?
IPDET © 2012
Any time there is an unexpected
Слайд 57Step 8: Reporting Findings
IPDET © 2012
Step 8: Reporting Findings
IPDET © 2012
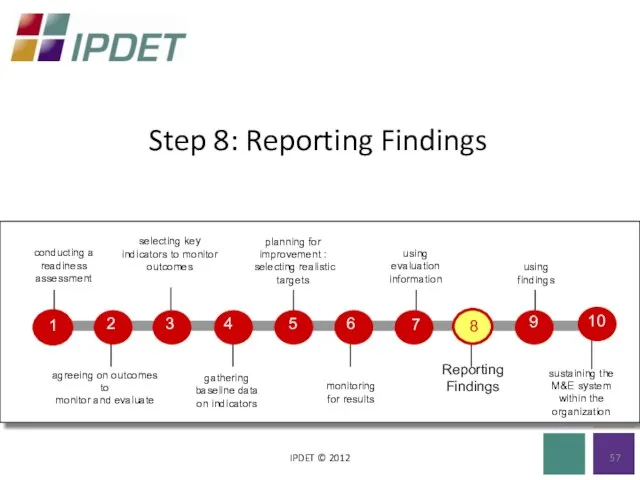
Слайд 58Reporting Findings
IPDET © 2012
Provides information on status of projects, programs, and policies
Yields
Reporting Findings
IPDET © 2012
Provides information on status of projects, programs, and policies
Yields
Слайд 59When Analyzing and Presenting Data:
IPDET © 2012
Compare indicator data with the baseline
When Analyzing and Presenting Data:
IPDET © 2012
Compare indicator data with the baseline
Слайд 60When Analyzing and Presenting Data: (cont.)
IPDET © 2012
Protect the messenger: people who
When Analyzing and Presenting Data: (cont.)
IPDET © 2012
Protect the messenger: people who
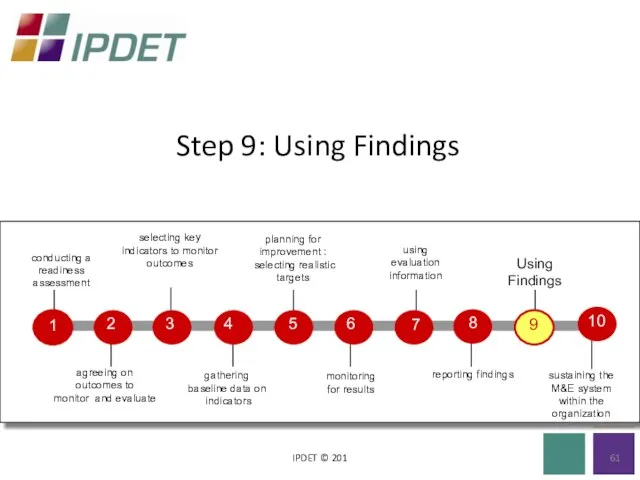
Слайд 61Step 9: Using Findings
IPDET © 201
Step 9: Using Findings
IPDET © 201
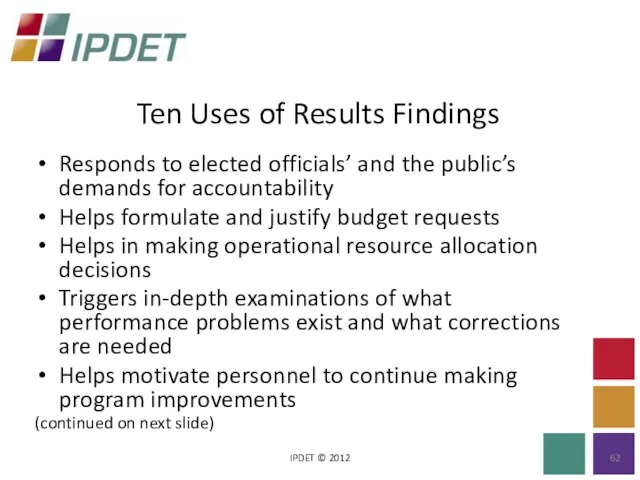
Слайд 62Ten Uses of Results Findings
IPDET © 2012
Responds to elected officials’ and the
Ten Uses of Results Findings
IPDET © 2012
Responds to elected officials’ and the
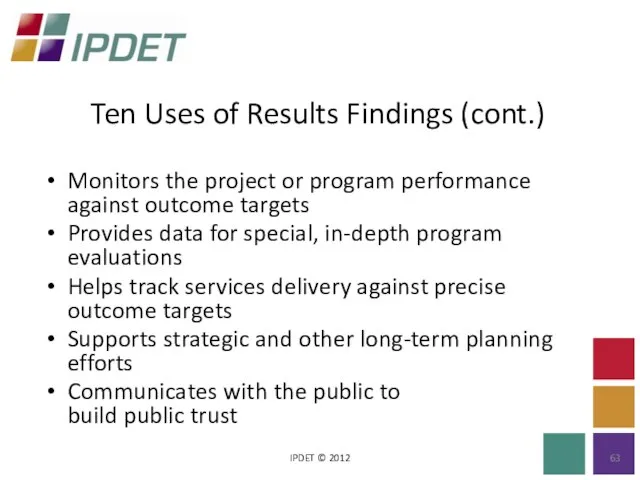
Слайд 63Ten Uses of Results Findings (cont.)
IPDET © 2012
Monitors the project or program
Ten Uses of Results Findings (cont.)
IPDET © 2012
Monitors the project or program
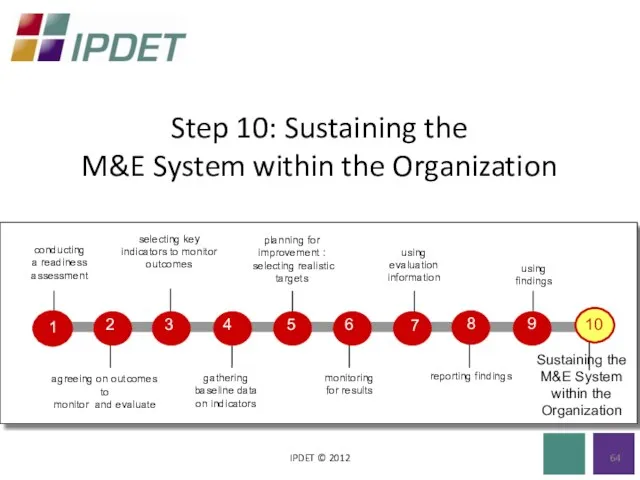
Слайд 64Step 10: Sustaining the
M&E System within the Organization
IPDET © 2012
Step 10: Sustaining the
M&E System within the Organization
IPDET © 2012
Слайд 65Critical Components Crucial to Sustaining
IPDET © 2012
Demand
Clear roles and responsibilities
Trustworthy and credible
Critical Components Crucial to Sustaining
IPDET © 2012
Demand
Clear roles and responsibilities
Trustworthy and credible
Слайд 66Concluding Comments
IPDET © 2012
The demand for capacity building never ends! The only
Concluding Comments
IPDET © 2012
The demand for capacity building never ends! The only

Слайд 67Concluding Comments (cont.)
IPDET © 2012
Begin with pilot efforts to demonstrate effective results-based
Concluding Comments (cont.)
IPDET © 2012
Begin with pilot efforts to demonstrate effective results-based
Слайд 68Approaches to Evaluation
Слайд 69What is the evaluation approach?
The systematic application of social research procedures for
What is the evaluation approach?
The systematic application of social research procedures for
Слайд 70Key Points
There is no a silver bullet approach
Answer different research questions
Intrinsically connected
Key Points
There is no a silver bullet approach
Answer different research questions
Intrinsically connected
Слайд 71Four Main Evaluation Approaches
Impact Evaluation
Outcome-Based Evaluation
Monitoring/Process Evaluation
Participatory Evaluation
Four Main Evaluation Approaches
Impact Evaluation
Outcome-Based Evaluation
Monitoring/Process Evaluation
Participatory Evaluation
Слайд 72Impact Evaluation
Impact evaluation is intended to determine more broadly:
-whether the program had
Impact Evaluation
Impact evaluation is intended to determine more broadly:
-whether the program had
Слайд 73The Evaluation Problem
The Evaluation Problem
Слайд 74The Evaluation Problem
The Evaluation Problem
Слайд 75The Evaluation Problem
When participation in the program is related to unmeasured characteristics
The Evaluation Problem
When participation in the program is related to unmeasured characteristics
Слайд 76Thinking About The Problem At Hand
Thinking About The Problem At Hand
Слайд 77Defining Counterfactuals
Determining the counterfactual is at the core of impact evaluation
Use
Defining Counterfactuals
Determining the counterfactual is at the core of impact evaluation
Use
Слайд 78Why it Matters?
We want to know if the program had an impact,
Why it Matters?
We want to know if the program had an impact,
Слайд 79Key Steps in Designing and Implementing
Determining whether or not to carry
Key Steps in Designing and Implementing
Determining whether or not to carry
Слайд 80Determining Whether Or Not To Carry Out An Impact Evaluation
Cost and benefits
Determining Whether Or Not To Carry Out An Impact Evaluation
Cost and benefits
Слайд 81Clarifying Objectives of Evaluation
Establishing clear objectives
Use and analysis of the program‘s logical
Clarifying Objectives of Evaluation
Establishing clear objectives
Use and analysis of the program‘s logical
Слайд 82Data Availability
Know the institutions of the program well.
Collect information on the
Data Availability
Know the institutions of the program well.
Collect information on the
Слайд 83Designing The Evaluation
Know the institutions of the program well.
Defined the evaluation
Designing The Evaluation
Know the institutions of the program well.
Defined the evaluation
Слайд 84Impact Evaluation Example: PROGRESA
PROGRESA is the principal antipoverty strategy of the Mexican
Impact Evaluation Example: PROGRESA
PROGRESA is the principal antipoverty strategy of the Mexican
Слайд 85PROGRESA’S Goals
Long-run poverty alleviation
- Investment in human capital
- Education
- Health
- Nutrition
Short-run
PROGRESA’S Goals
Long-run poverty alleviation
- Investment in human capital
- Education
- Health
- Nutrition
Short-run
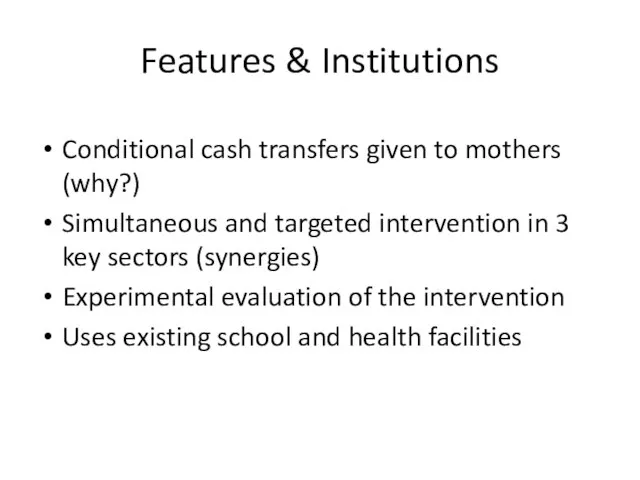
Слайд 86Features & Institutions
Conditional cash transfers given to mothers (why?)
Simultaneous and targeted intervention
Features & Institutions
Conditional cash transfers given to mothers (why?)
Simultaneous and targeted intervention
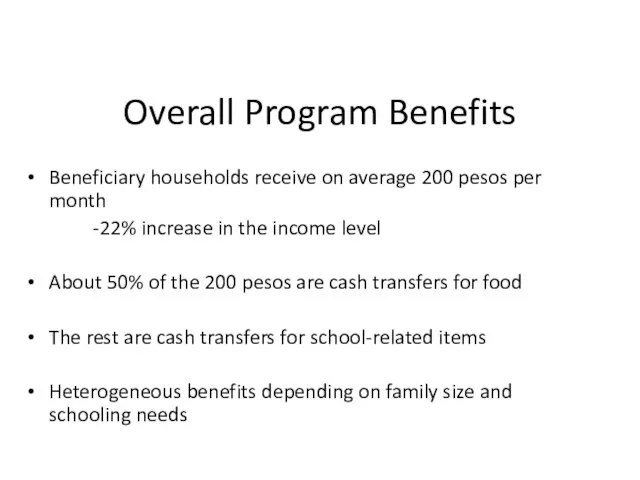
Слайд 87Overall Program Benefits
Beneficiary households receive on average 200 pesos per month
-22%
Overall Program Benefits
Beneficiary households receive on average 200 pesos per month
-22%
Слайд 88Evaluation Framework
Evaluation Framework
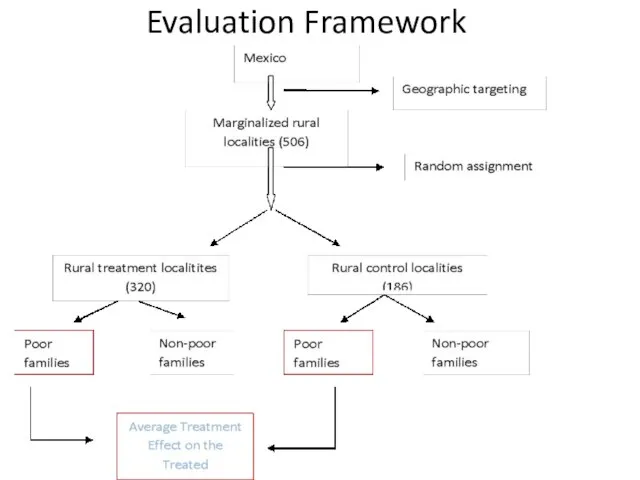
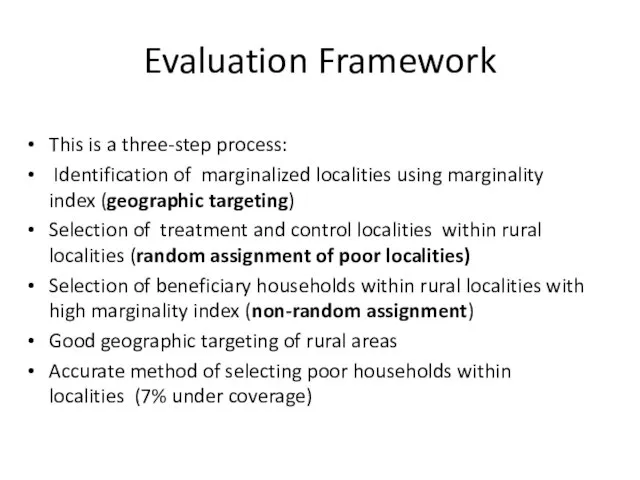
Слайд 89Evaluation Framework
This is a three-step process:
Identification of marginalized localities using marginality
Evaluation Framework
This is a three-step process:
Identification of marginalized localities using marginality
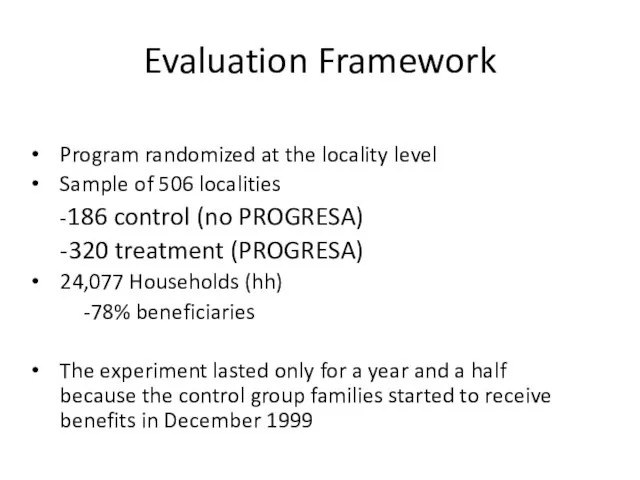
Слайд 90Evaluation Framework
Program randomized at the locality level
Sample of 506 localities
-186 control (no
Evaluation Framework
Program randomized at the locality level
Sample of 506 localities
-186 control (no
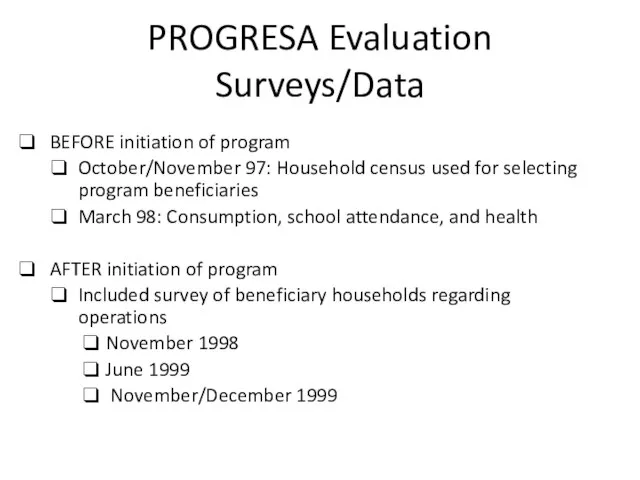
Слайд 91PROGRESA Evaluation Surveys/Data
BEFORE initiation of program
October/November 97: Household census used for selecting
PROGRESA Evaluation Surveys/Data
BEFORE initiation of program
October/November 97: Household census used for selecting
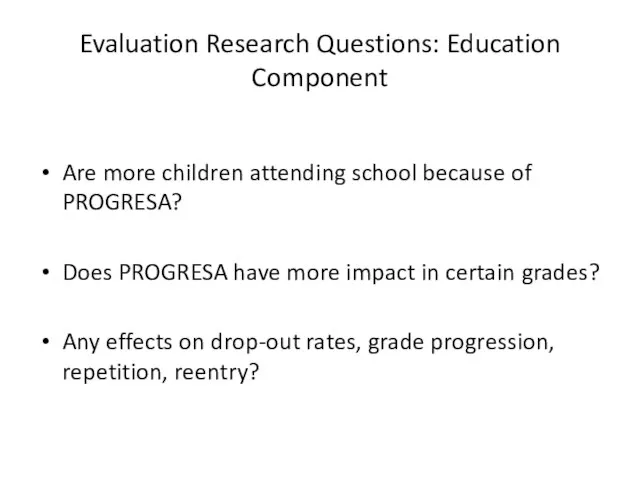
Слайд 92Evaluation Research Questions: Education Component
Are more children attending school because of PROGRESA?
Does
Evaluation Research Questions: Education Component
Are more children attending school because of PROGRESA?
Does
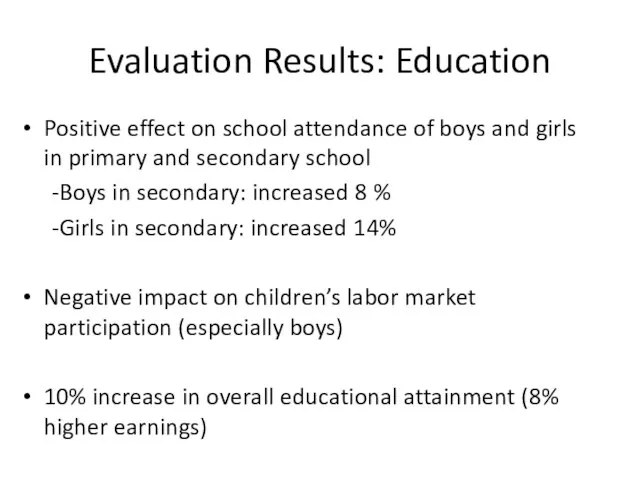
Слайд 93Evaluation Results: Education
Positive effect on school attendance of boys and girls in
Evaluation Results: Education
Positive effect on school attendance of boys and girls in
Слайд 94Evaluation Research Questions: Health
Does PROGRESA increase visits to public health clinics?
Does PROGRESA
Evaluation Research Questions: Health
Does PROGRESA increase visits to public health clinics?
Does PROGRESA
Слайд 95Evaluation Results: Health
Significant increase in visit rates
-Nutrition monitoring visits
-Immunization rates
-Prenatal care in
Evaluation Results: Health
Significant increase in visit rates
-Nutrition monitoring visits
-Immunization rates
-Prenatal care in
Слайд 96Evaluation Research Questions: Nutrition
Does PROGRESA impact child growth?
Does PROGRESA impact household consumption
Evaluation Research Questions: Nutrition
Does PROGRESA impact child growth?
Does PROGRESA impact household consumption
Слайд 97Evaluation Results: Nutrition
Significant effect in increasing child growth (1cm higher growth)
Significant
Evaluation Results: Nutrition
Significant effect in increasing child growth (1cm higher growth)
Significant
Слайд 98(2) Outcome-Based Evaluation
(2) Outcome-Based Evaluation
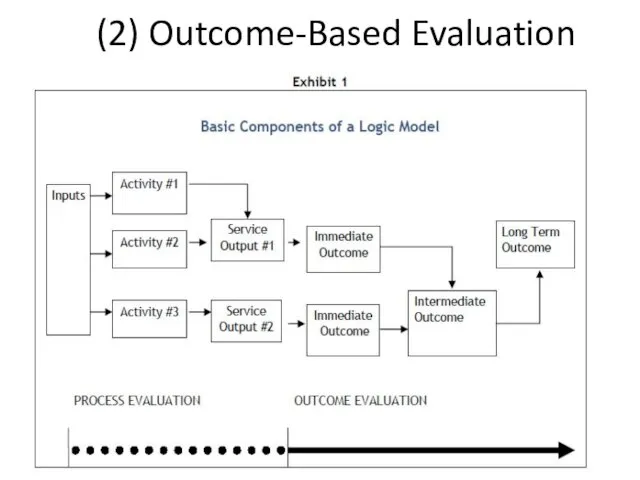
Слайд 99Basic Definitions
Outcome-based evaluation is a systematic way to assess the extent to
Basic Definitions
Outcome-based evaluation is a systematic way to assess the extent to
Слайд 100Why It Matters?
Contribute to program effectiveness
Provide a logical framework for program development
Generate
Why It Matters?
Contribute to program effectiveness
Provide a logical framework for program development
Generate
Слайд 101But Unlike Impact Evaluation
It does not prove cause and effect, only suggest
But Unlike Impact Evaluation
It does not prove cause and effect, only suggest
Слайд 102(3)Monitoring/Process Evaluation
Help to assess whether a program is being implemented as was
(3)Monitoring/Process Evaluation
Help to assess whether a program is being implemented as was
Слайд 103Why It Matters?
Helps on determining how a program’s potential impact is related
Why It Matters?
Helps on determining how a program’s potential impact is related
Слайд 104(4)Participatory Evaluation
Representatives of agencies and stakeholders (including beneficiaries) work together in designing,
(4)Participatory Evaluation
Representatives of agencies and stakeholders (including beneficiaries) work together in designing,
Слайд 105Principles of Participatory Evaluation
Evaluation involves building participants’ skills
Participants commit to the evaluation
Principles of Participatory Evaluation
Evaluation involves building participants’ skills
Participants commit to the evaluation
Слайд 106Participatory Process
No single right way
Commitment to the principles of participation and inclusion
-those
Participatory Process
No single right way
Commitment to the principles of participation and inclusion
-those
Слайд 107Benefits of Participatory
Increased buy-in, less resistance
Results are more likely to be used
Increased
Benefits of Participatory
Increased buy-in, less resistance
Results are more likely to be used
Increased
Слайд 108Challenges of Participatory
Concern that evaluation will not be objective
Those closest to the
Challenges of Participatory
Concern that evaluation will not be objective
Those closest to the
 Презентация на тему Вода. Четыре стихии
  Ярославская церковь Победа Христа
 Угадайка
 Нормативная база ГМО
 Мегадума. Игра
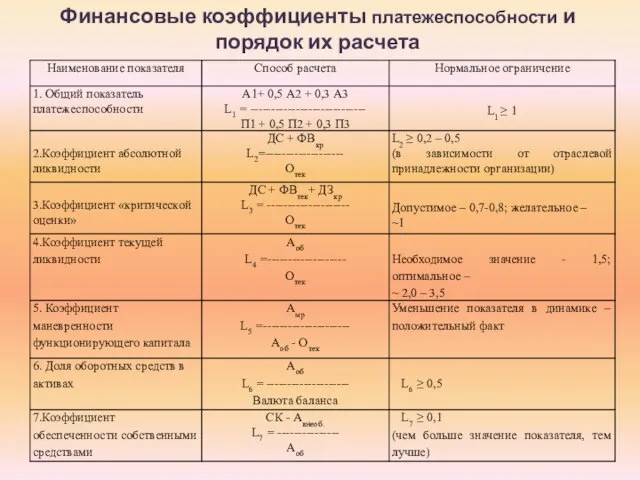 Финансовые коэффициенты платежеспособности и порядок их расчета
 Large-Scale Evidence Generation and Evaluation across a Network of Databases (LEGEND) project
 Притча о сеятеле и разных видах почвы
 Русские народные сказки
 Дидактические и методические принципы развития слухового восприятия
 Русский язык как учебный предмет в средней школе
 Требования к судьям
 ТЕМА 3
 Лидер на рынке комплексных решений проблем предприятия
 Биография Пирогова Николая Ивановича
 Рельеф и полезные ископаемые Южной Америки
 Композиция
 Рисуем кошку
 Социальная безопасность молодежи
 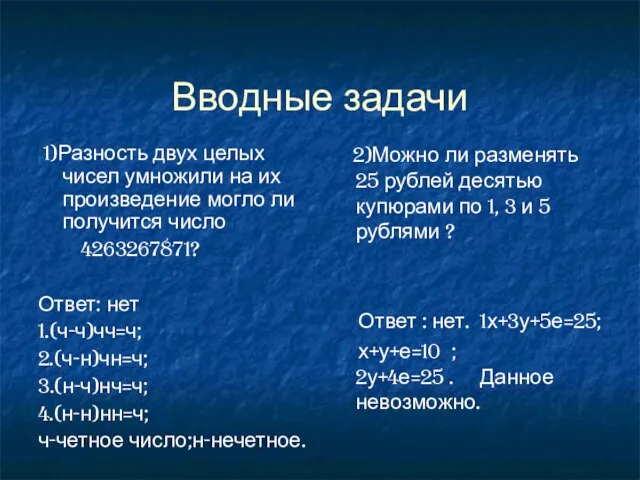 Вводные задачи
 Правовые основы здравоохранения Социальное и медицинское страхование
 Инвестиционная платформа компании CURRENCY GLOBAL
 Создание конструкции и дизайна упаковки для хлопьев
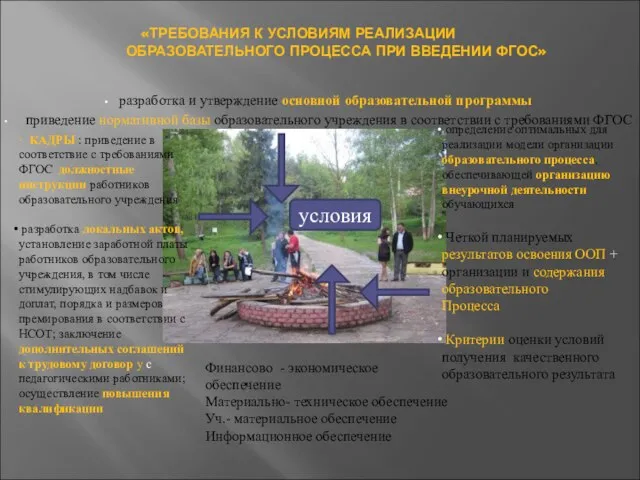 «Требования к условиям реализации образовательного процесса при введении ФГОС»
 Ядерное оружие. Борьба ученых за устранение ядерной угрозы
 История создания международной системы гуманитарного реагирования при ЧС мирного и военного времени
 Детали кроя
 Тема урока: Математические основы физики.