- Poverty

Содержание
- 2. SOCIETY AT A GLANCE 2011: OECD SOCIAL INDICATORS. OECD 2011 Gini Coefficient – measure of income
- 3. SOCIETY AT A GLANCE 2011: OECD SOCIAL INDICATORS. OECD 2011
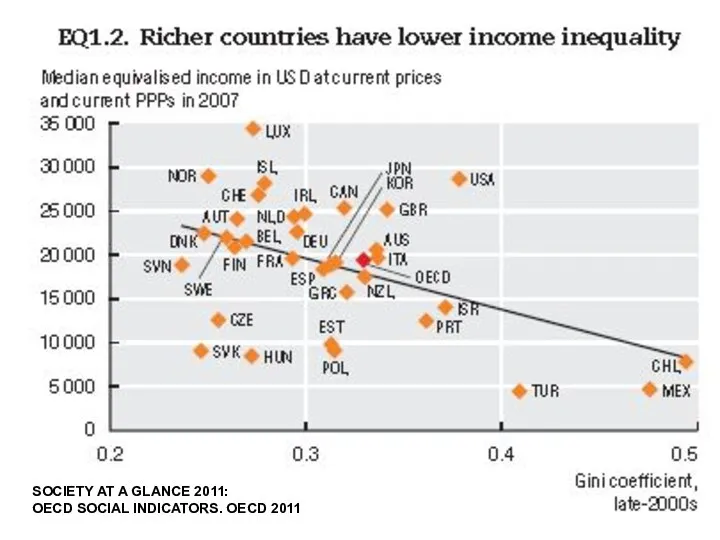
- 4. SOCIETY AT A GLANCE 2011: OECD SOCIAL INDICATORS. OECD 2011
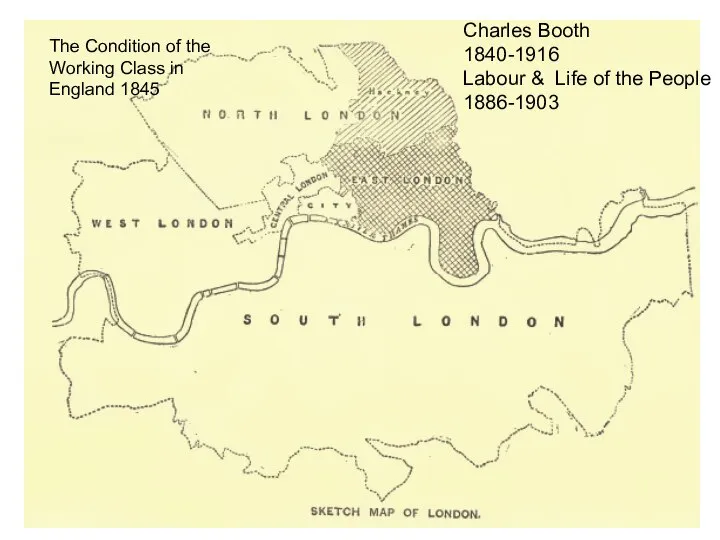
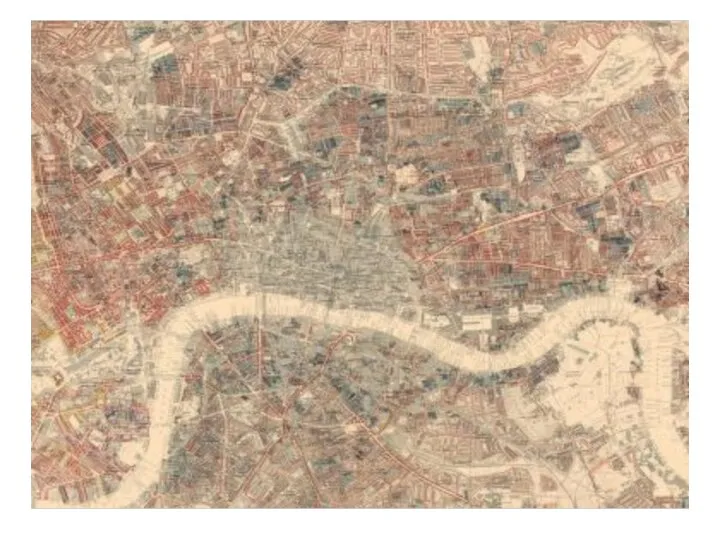
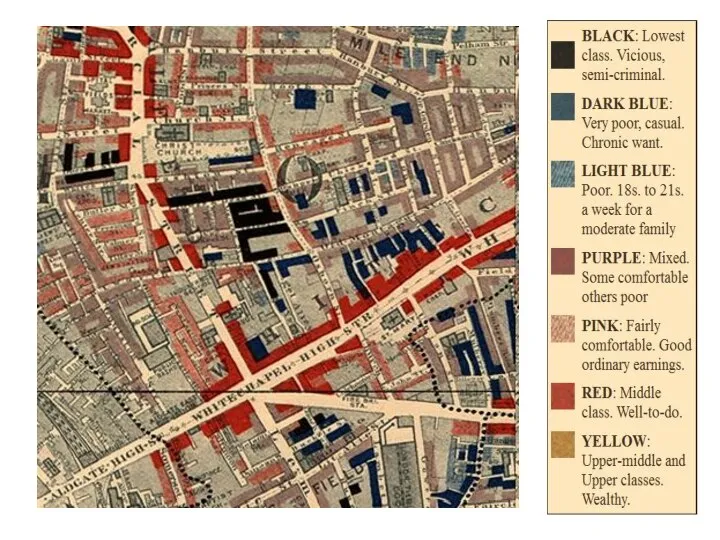
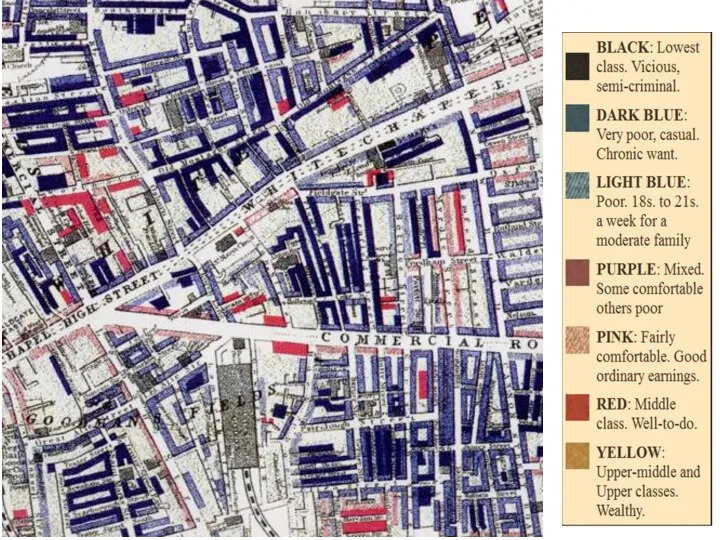
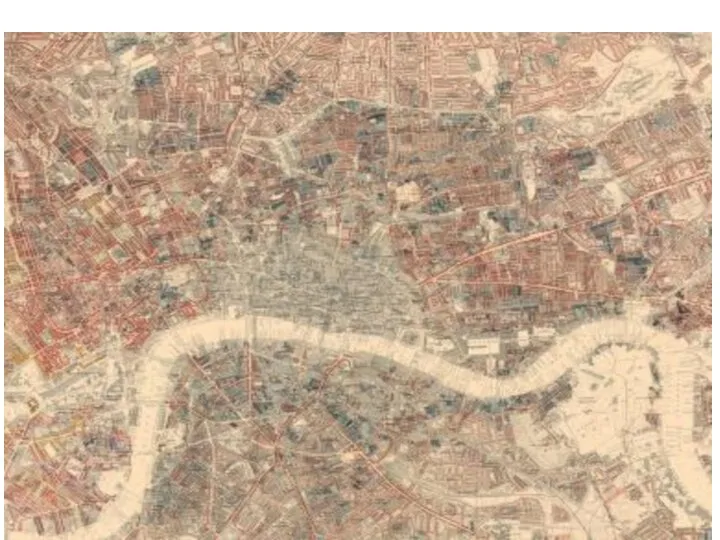
- 5. Charles Booth 1840-1916 Labour & Life of the People 1886-1903 The Condition of the Working Class
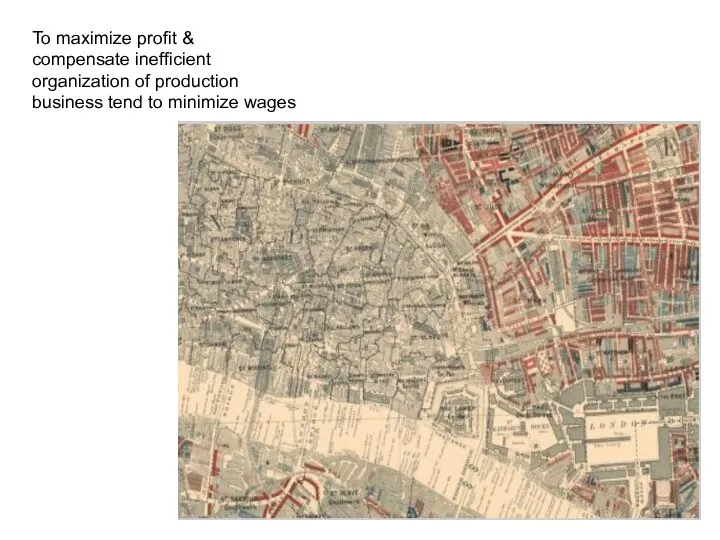
- 7. To maximize profit & compensate inefficient organization of production business tend to minimize wages
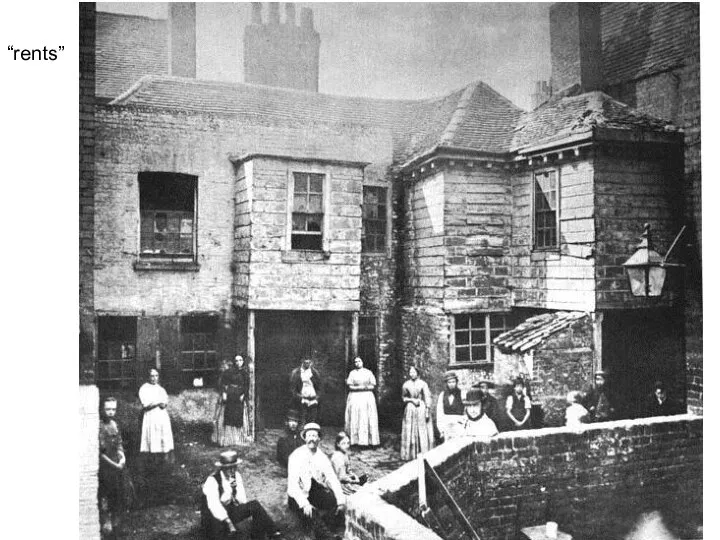
- 9. “rents”
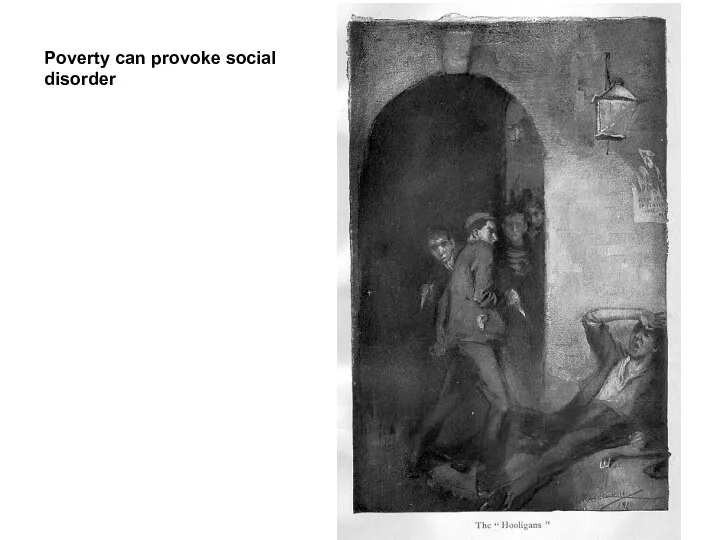
- 10. Poverty can provoke social disorder
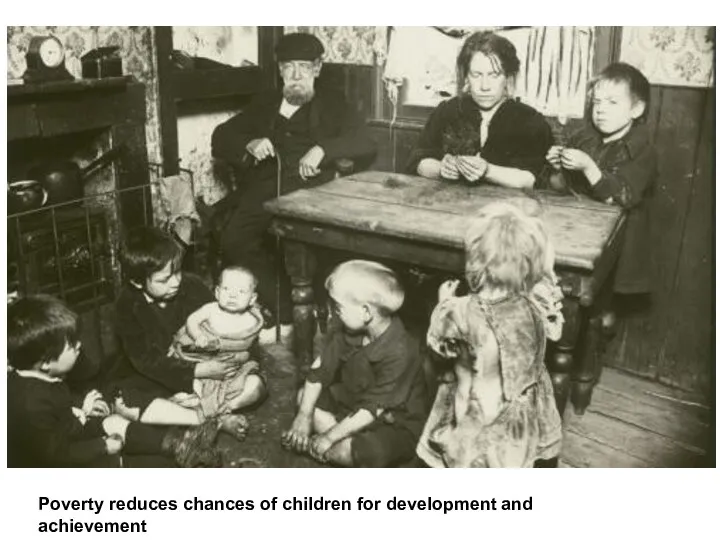
- 11. Poverty reduces chances of children for development and achievement
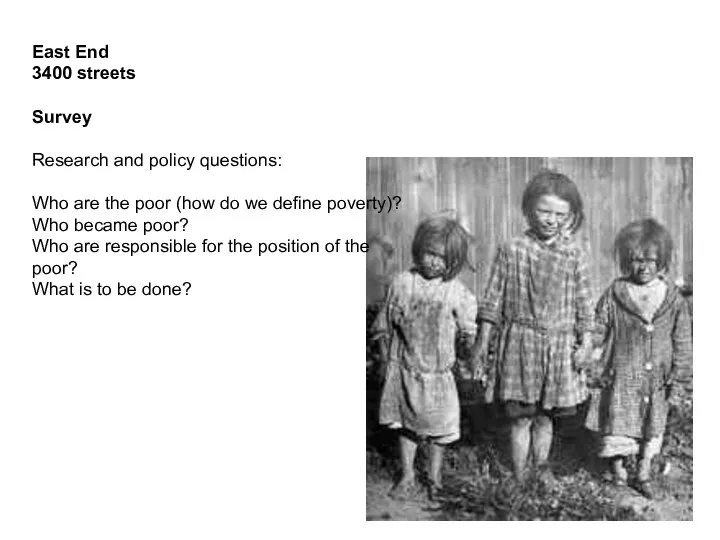
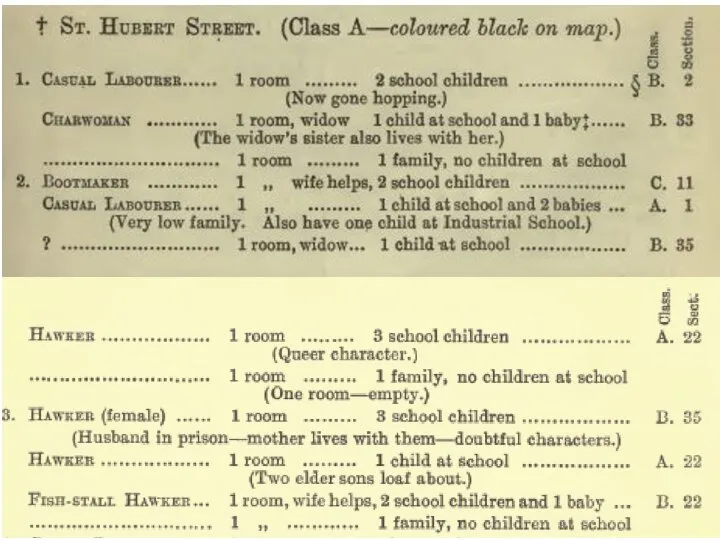
- 12. East End 3400 streets Survey Research and policy questions: Who are the poor (how do we
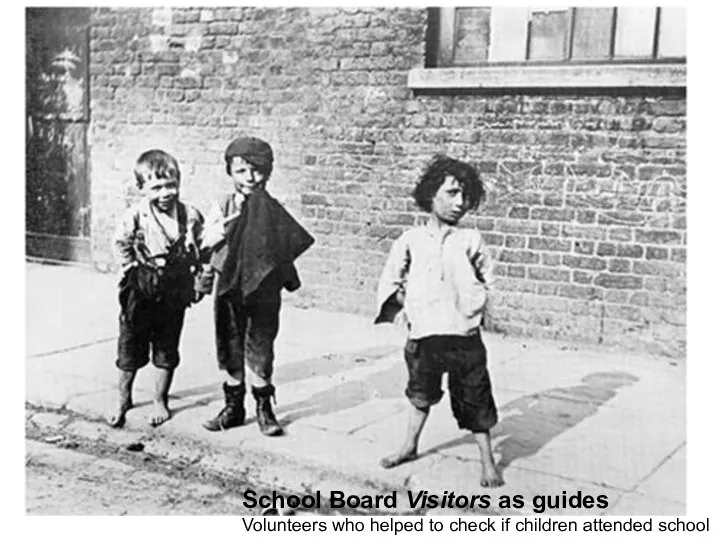
- 13. School Board Visitors as guides Volunteers who helped to check if children attended school
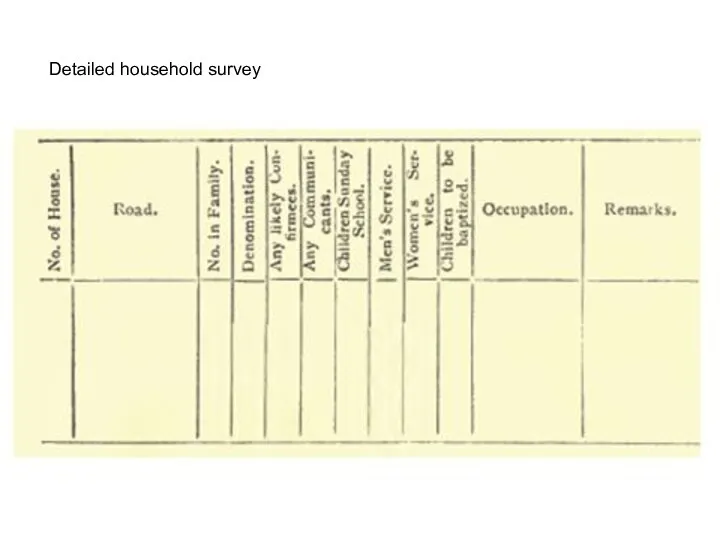
- 14. Detailed household survey
- 16. А:
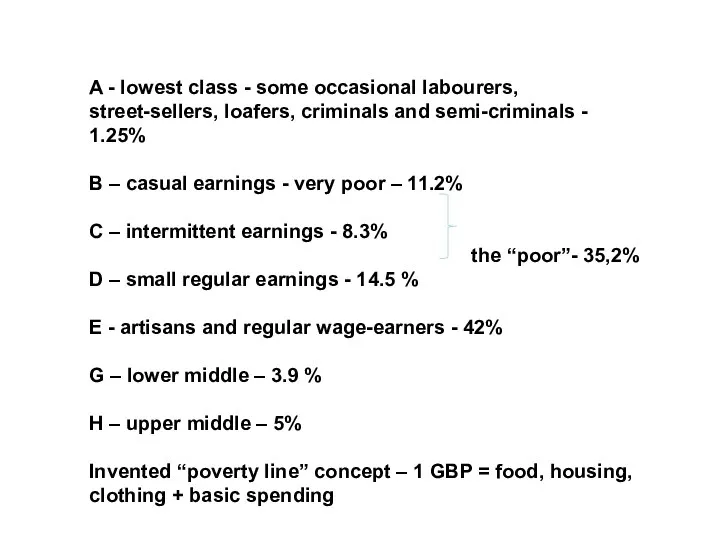
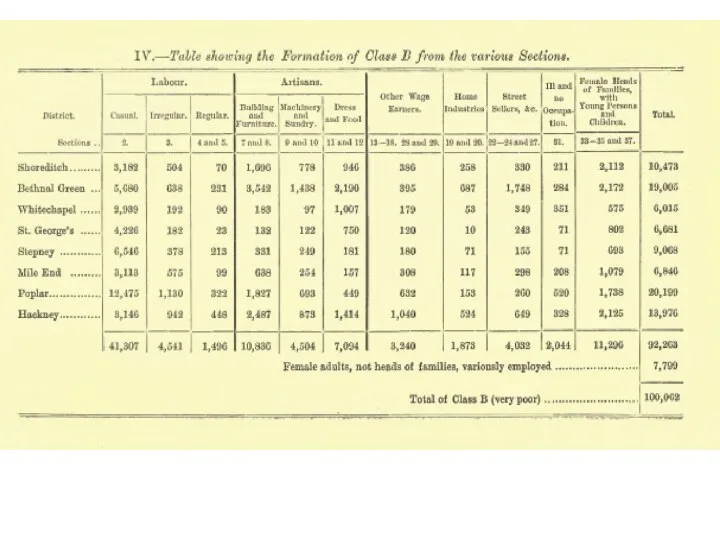
- 18. A - lowest class - some occasional labourers, street-sellers, loafers, criminals and semi-criminals - 1.25% B
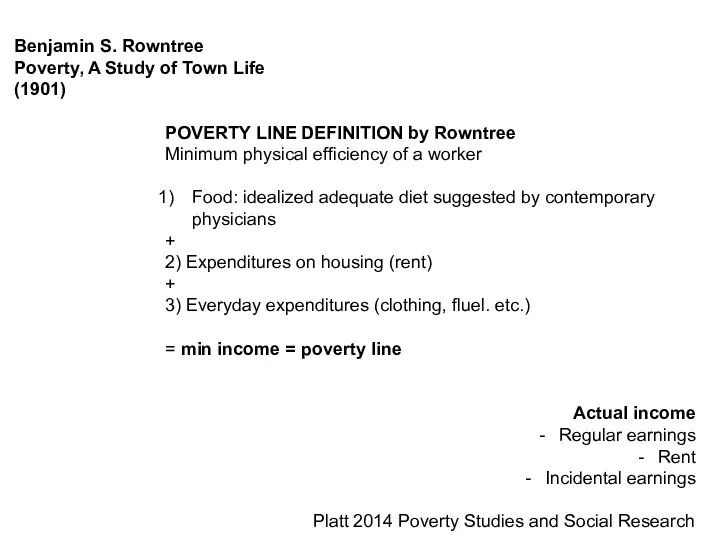
- 23. Benjamin S. Rowntree Poverty, A Study of Town Life (1901) POVERTY LINE DEFINITION by Rowntree Minimum
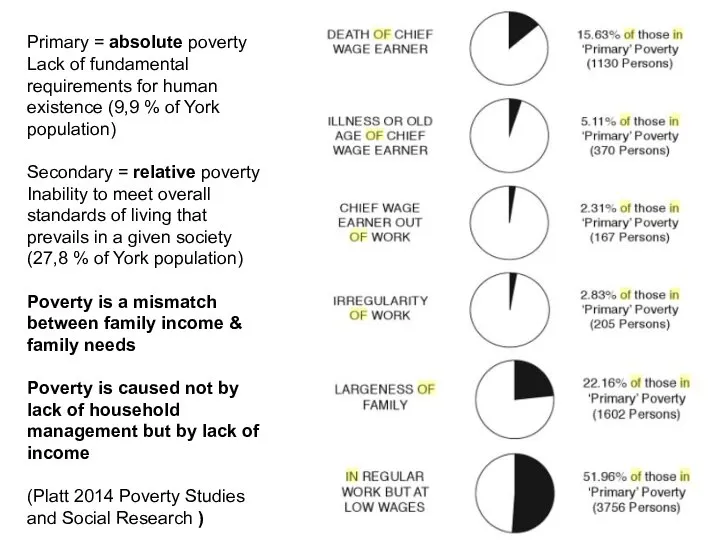
- 24. Primary = absolute poverty Lack of fundamental requirements for human existence (9,9 % of York population)
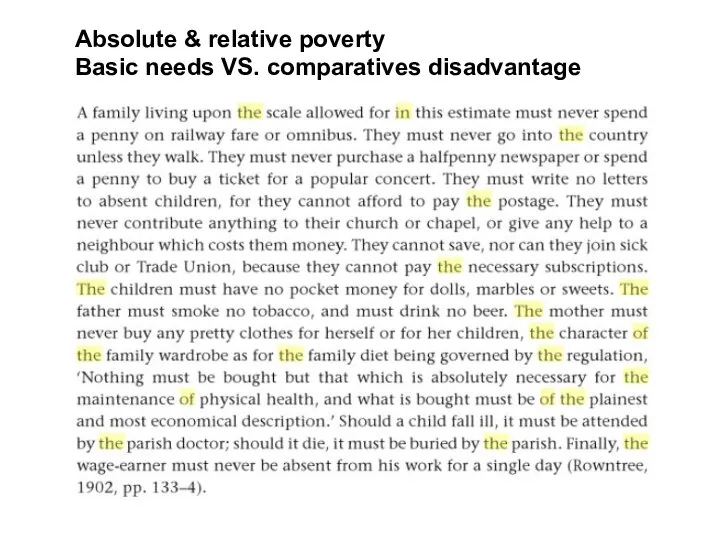
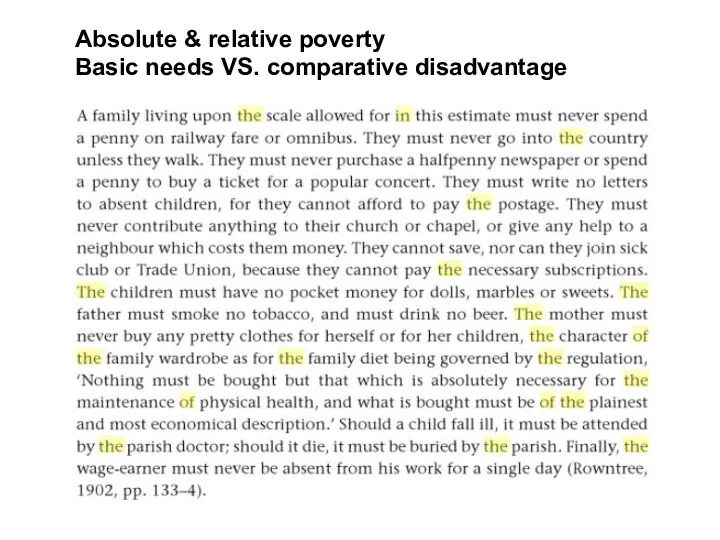
- 25. Absolute & relative poverty Basic needs VS. comparatives disadvantage
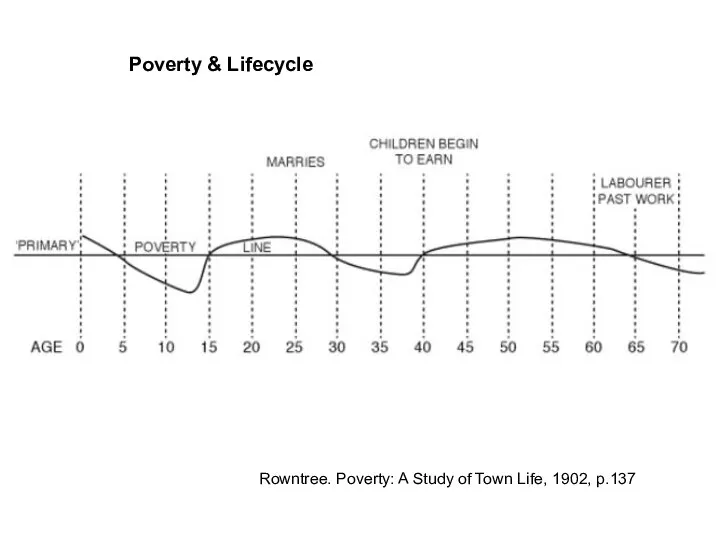
- 26. Rowntree. Poverty: A Study of Town Life, 1902, p.137 Poverty & Lifecycle
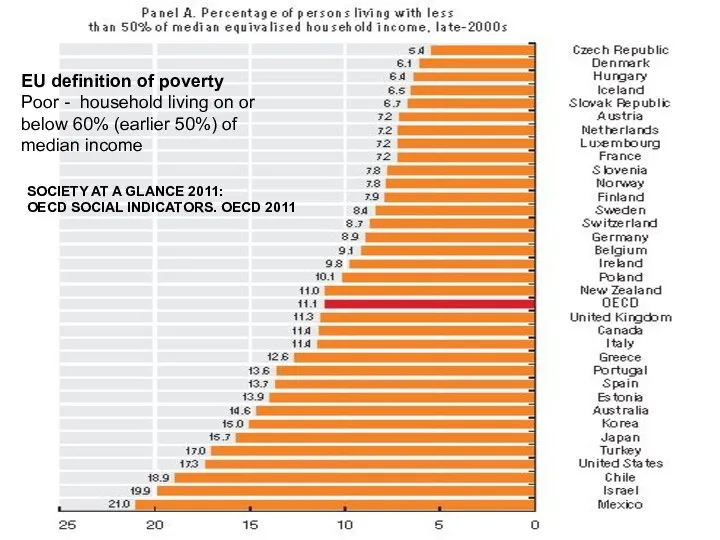
- 27. SOCIETY AT A GLANCE 2011: OECD SOCIAL INDICATORS. OECD 2011 EU definition of poverty Poor -
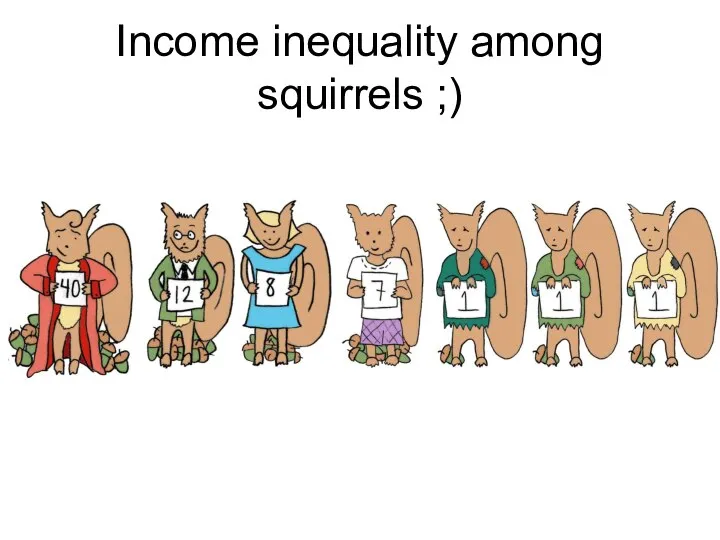
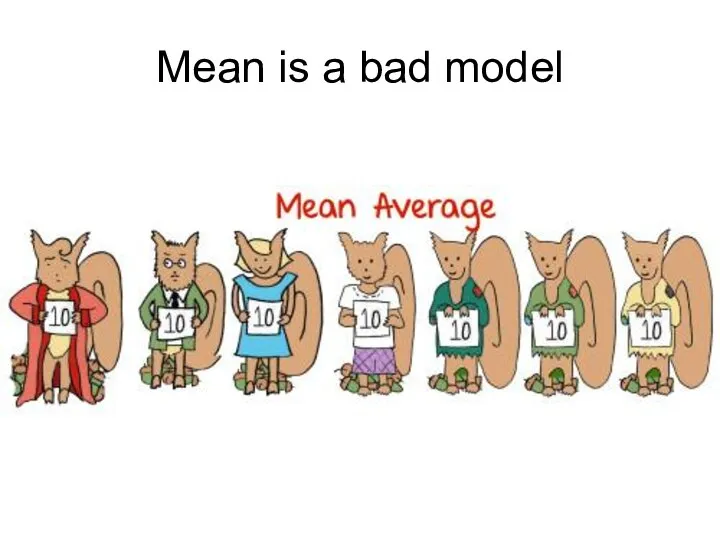
- 29. Income inequality among squirrels ;)
- 30. Mean is a bad model
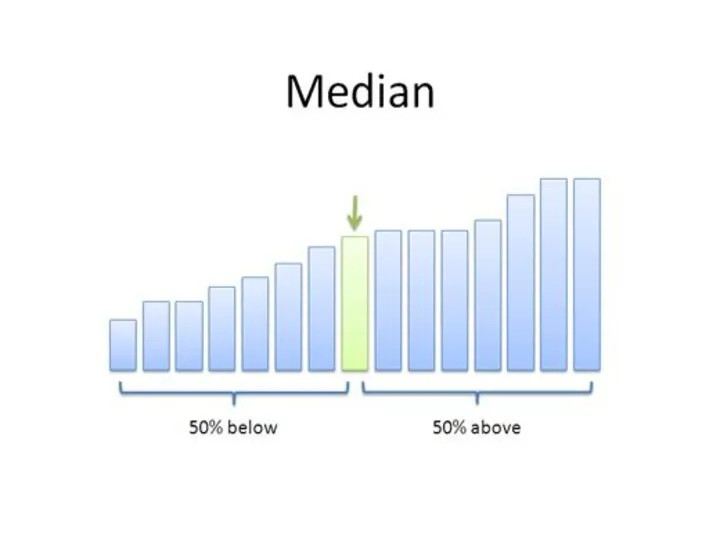
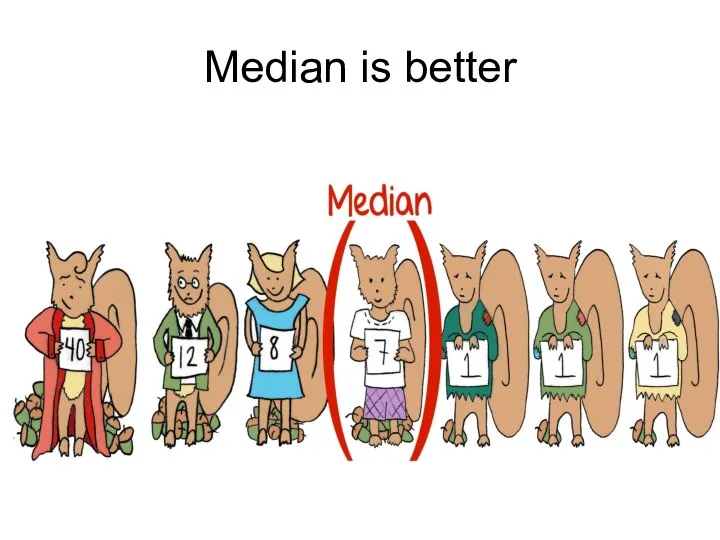
- 31. Median is better
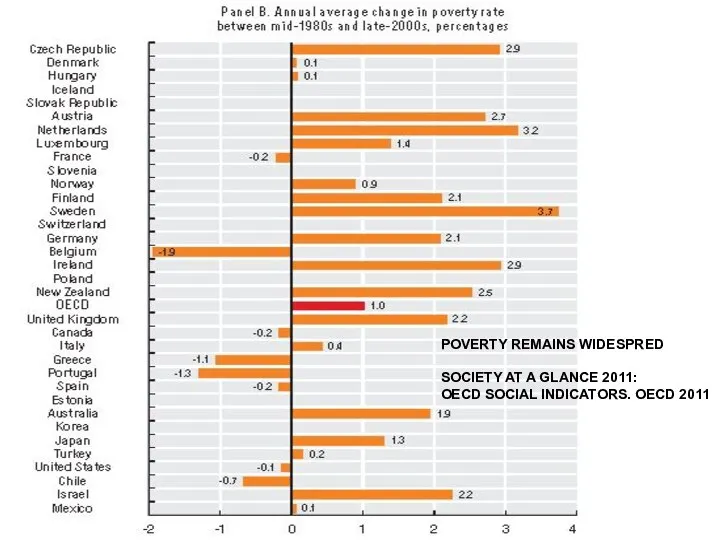
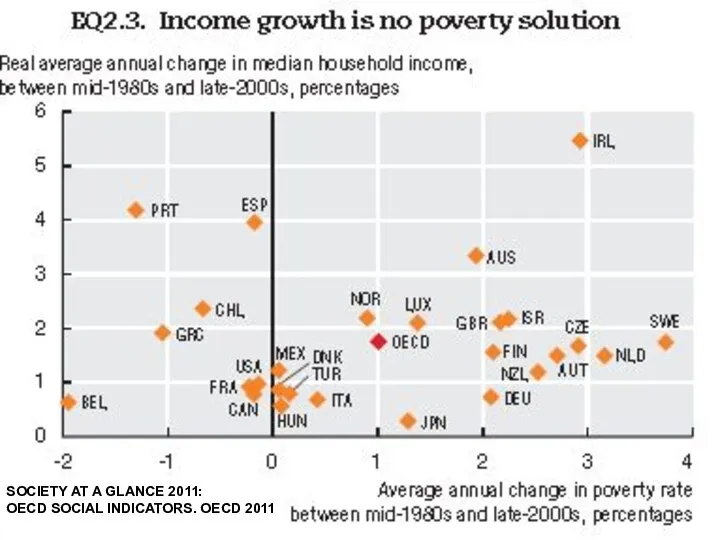
- 32. POVERTY REMAINS WIDESPRED SOCIETY AT A GLANCE 2011: OECD SOCIAL INDICATORS. OECD 2011
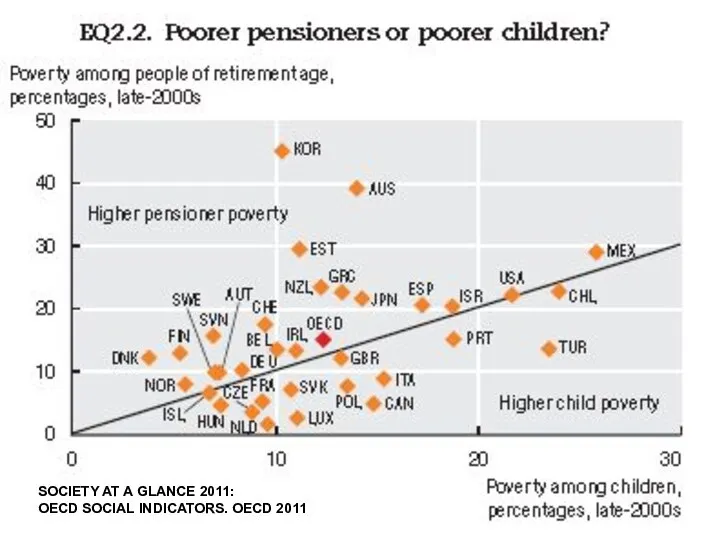
- 33. SOCIETY AT A GLANCE 2011: OECD SOCIAL INDICATORS. OECD 2011
- 34. SOCIETY AT A GLANCE 2011: OECD SOCIAL INDICATORS. OECD 2011
- 35. Absolute & relative poverty Basic needs VS. comparative disadvantage
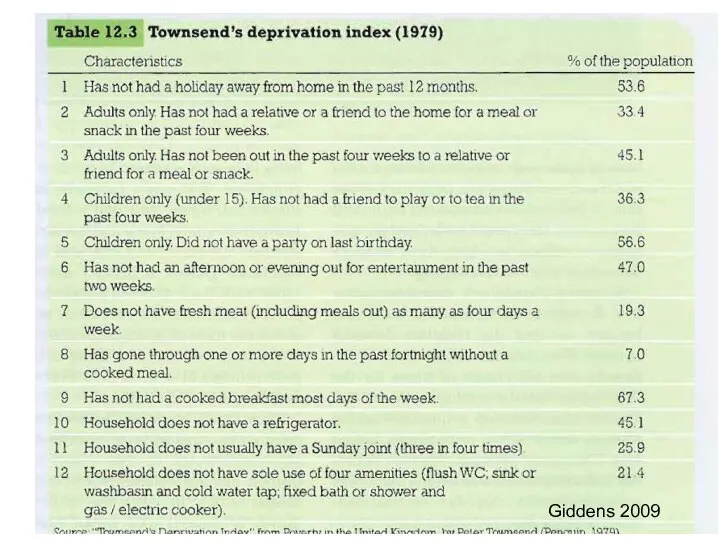
- 36. Giddens 2009
- 38. Скачать презентацию
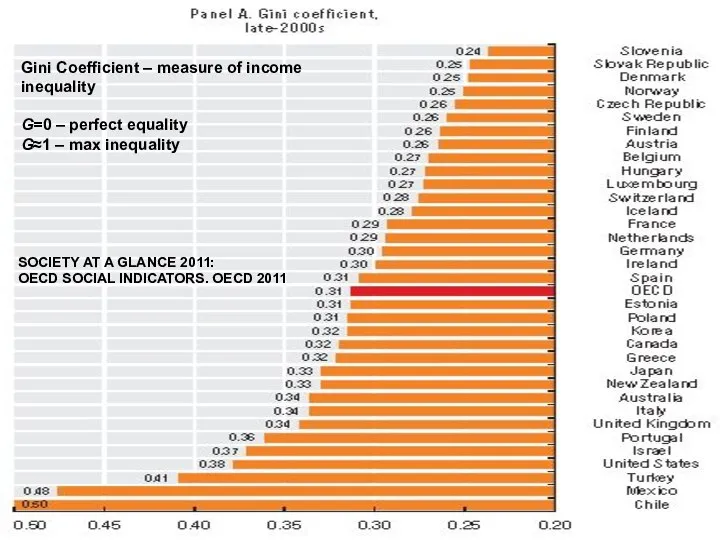
Слайд 3SOCIETY AT A GLANCE 2011:
OECD SOCIAL INDICATORS. OECD 2011
SOCIETY AT A GLANCE 2011:
OECD SOCIAL INDICATORS. OECD 2011
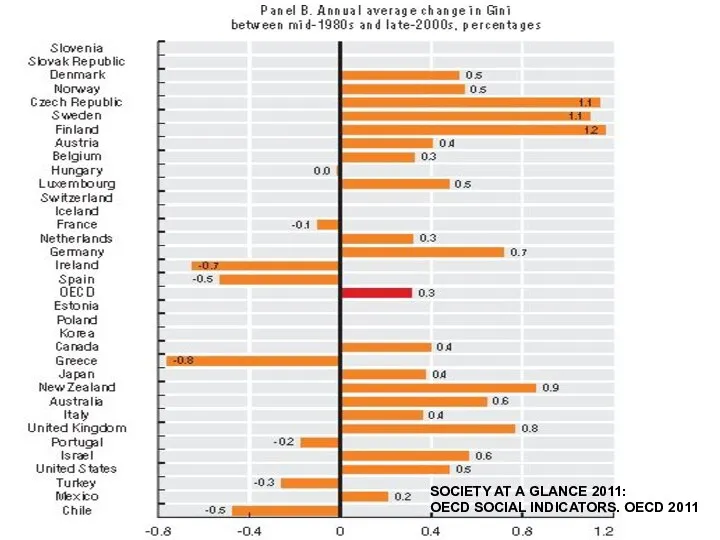
Слайд 4SOCIETY AT A GLANCE 2011:
OECD SOCIAL INDICATORS. OECD 2011
SOCIETY AT A GLANCE 2011:
OECD SOCIAL INDICATORS. OECD 2011
Слайд 5Charles Booth
1840-1916
Labour & Life of the People
1886-1903
The Condition of the Working Class
Charles Booth
1840-1916
Labour & Life of the People
1886-1903
The Condition of the Working Class
Слайд 7To maximize profit &
compensate inefficient organization of production business tend to minimize
To maximize profit &
compensate inefficient organization of production business tend to minimize
Слайд 9“rents”
“rents”
Слайд 10Poverty can provoke social disorder
Poverty can provoke social disorder
Слайд 11Poverty reduces chances of children for development and achievement
Poverty reduces chances of children for development and achievement
Слайд 12East End
3400 streets
Survey
Research and policy questions:
Who are the poor (how do we
East End
3400 streets
Survey
Research and policy questions:
Who are the poor (how do we
Слайд 13School Board Visitors as guides
Volunteers who helped to check if children attended
School Board Visitors as guides
Volunteers who helped to check if children attended
Слайд 14Detailed household survey
Detailed household survey
Слайд 16А:
А:
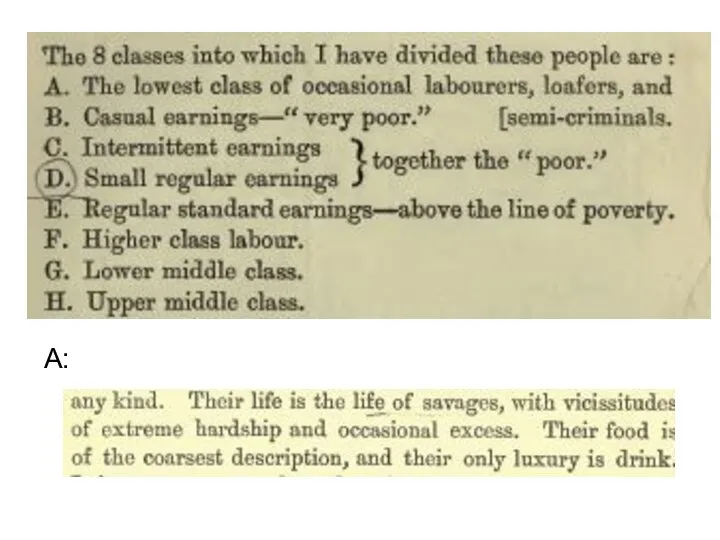
Слайд 18A - lowest class - some occasional labourers, street-sellers, loafers, criminals and
A - lowest class - some occasional labourers, street-sellers, loafers, criminals and
Слайд 23Benjamin S. Rowntree
Poverty, A Study of Town Life (1901)
POVERTY LINE DEFINITION by
Benjamin S. Rowntree
Poverty, A Study of Town Life (1901)
POVERTY LINE DEFINITION by
Слайд 24Primary = absolute poverty
Lack of fundamental requirements for human existence (9,9 %
Primary = absolute poverty
Lack of fundamental requirements for human existence (9,9 %
Слайд 25Absolute & relative poverty
Basic needs VS. comparatives disadvantage
Absolute & relative poverty
Basic needs VS. comparatives disadvantage
Слайд 26Rowntree. Poverty: A Study of Town Life, 1902, p.137
Poverty & Lifecycle
Rowntree. Poverty: A Study of Town Life, 1902, p.137
Poverty & Lifecycle
Слайд 27SOCIETY AT A GLANCE 2011:
OECD SOCIAL INDICATORS. OECD 2011
EU definition of
SOCIETY AT A GLANCE 2011:
OECD SOCIAL INDICATORS. OECD 2011
EU definition of
Слайд 29Income inequality among squirrels ;)
Income inequality among squirrels ;)
Слайд 30Mean is a bad model
Mean is a bad model
Слайд 31Median is better
Median is better
Слайд 32POVERTY REMAINS WIDESPRED
SOCIETY AT A GLANCE 2011:
OECD SOCIAL INDICATORS. OECD
POVERTY REMAINS WIDESPRED
SOCIETY AT A GLANCE 2011:
OECD SOCIAL INDICATORS. OECD
Слайд 33SOCIETY AT A GLANCE 2011:
OECD SOCIAL INDICATORS. OECD 2011
SOCIETY AT A GLANCE 2011:
OECD SOCIAL INDICATORS. OECD 2011
Слайд 34SOCIETY AT A GLANCE 2011:
OECD SOCIAL INDICATORS. OECD 2011
SOCIETY AT A GLANCE 2011:
OECD SOCIAL INDICATORS. OECD 2011
Слайд 35Absolute & relative poverty
Basic needs VS. comparative disadvantage
Absolute & relative poverty
Basic needs VS. comparative disadvantage
Слайд 36Giddens 2009
Giddens 2009
 Лукойл
 Английская буржуазная революция 1640 - 1660 годов
 Покровные ткани
 Анализ поведения затрат и взаимосвязи объема, себестоимости и прибыли
 Реализация личностно-ориентированного обучения в начальной школе
 Здоровая рекламная экосистема
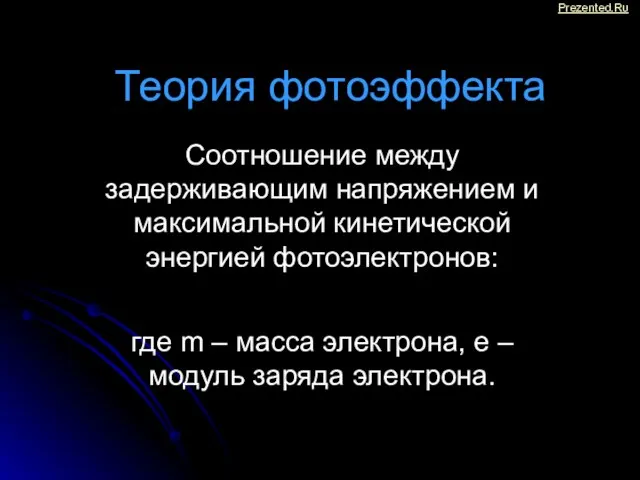 Презентация на тему Теория фотоэффекта
 Тинькофф. 4 день
 Показники ефективності роботи підприємства
 Проект "Елочка-красавица"
 Отпуск
 Решение квадратных уравнений
 Разработка мобильной энергосберегающей конструкции для производства жидких комплексных удобрений
 Академия ИТС по продажам сервисов 1С:ИТС. Работа с возражениями
 Швеция
 Организационное поведение
 Продажи дистрибьютеров
 Politische Situation in unruhige Weltgebiete
 фин грамотность
 Персонифицированное финансирование дополнительного образования детей
 Интеллектуальная собственность – история развития
 Tobacco use is the single largest cause
 Что за направление «ТЕПЛОЭНЕРГЕТИКА"?..
 Державин Гавриил Романович. Биография
 Ткани, цвет, орнамент В XVII в. производство тканей начинает приобретать промышленный характер. Возрастает их разнообразие по волокн
 Презентация на тему Сложение и вычитание чисел в пределах 10 000
  Семинар для педагогов по теме: «Психологическое здоровье школьников»
 Проект Жас оркен 2016