- Probability-2

Содержание
- 2. Recap Why should we learn Probability? Formulating questions in terms of probability Building the probability model
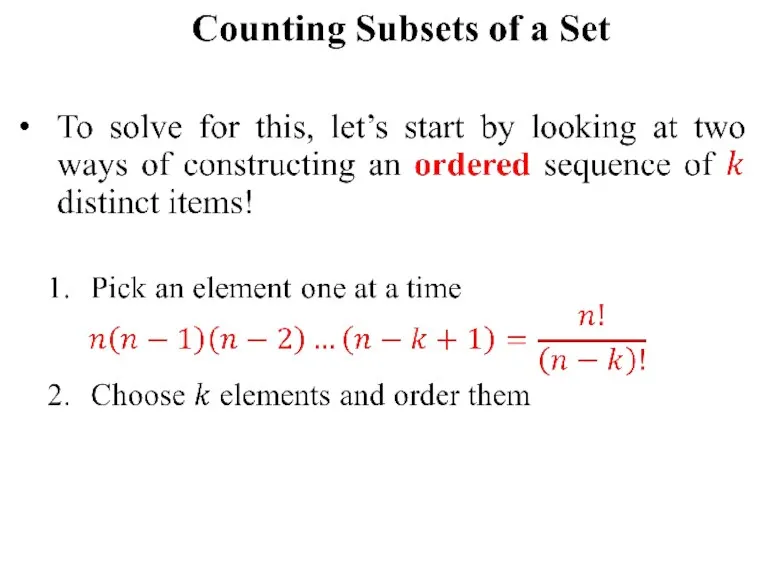
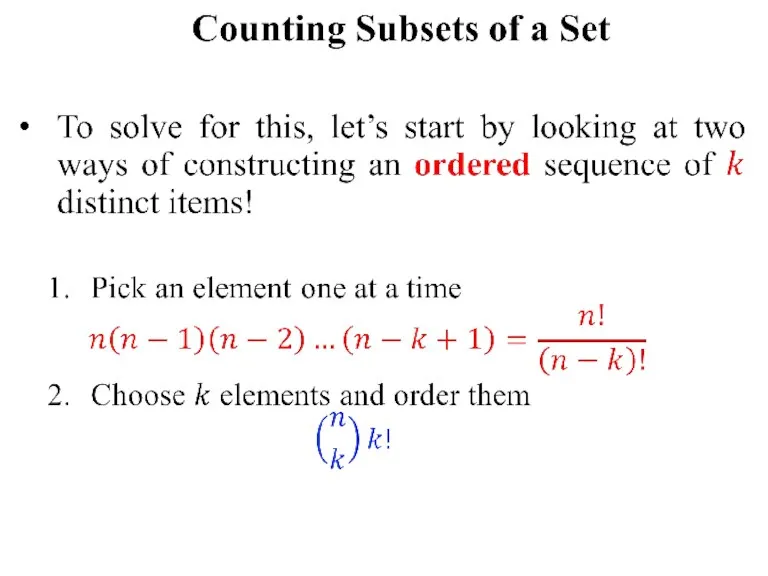
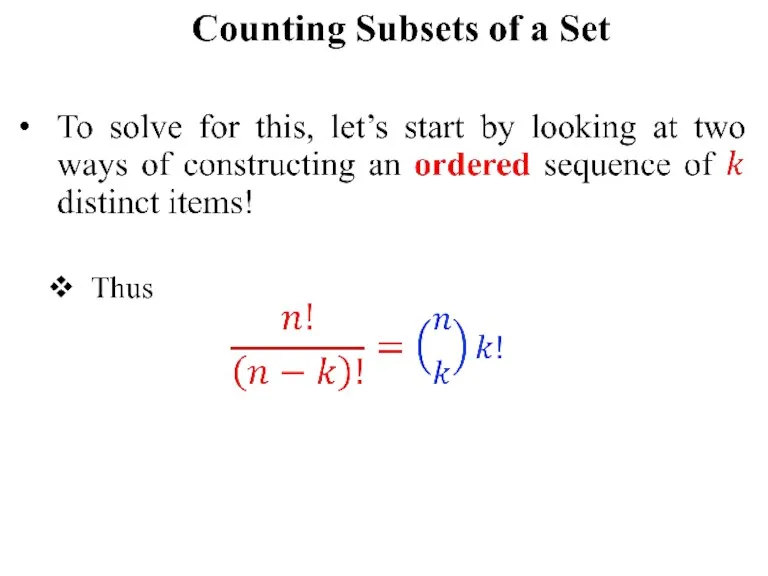
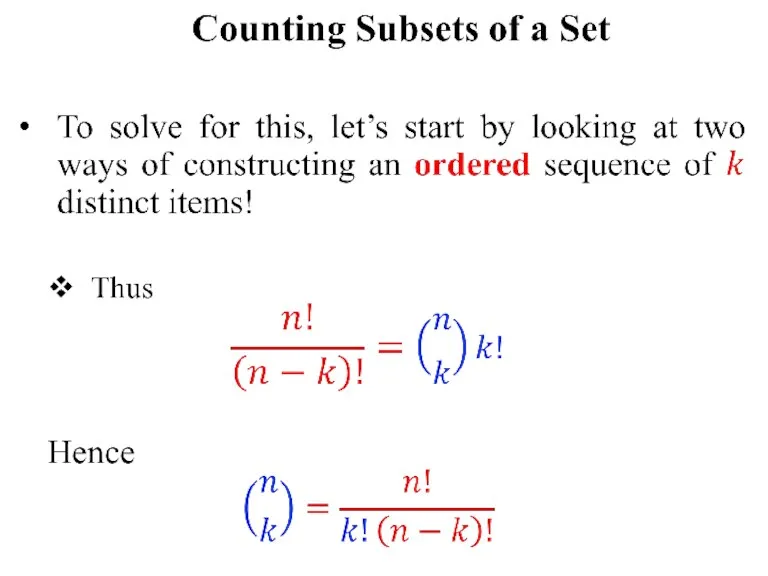
- 3. Today’s Objectives Counting subsets of a set Conditional Probability Independence Total Probability Theorem Baye’s theorem Random
- 5. Why Count Subsets of Set? Example: Suppose we select 5 cards at random from a deck
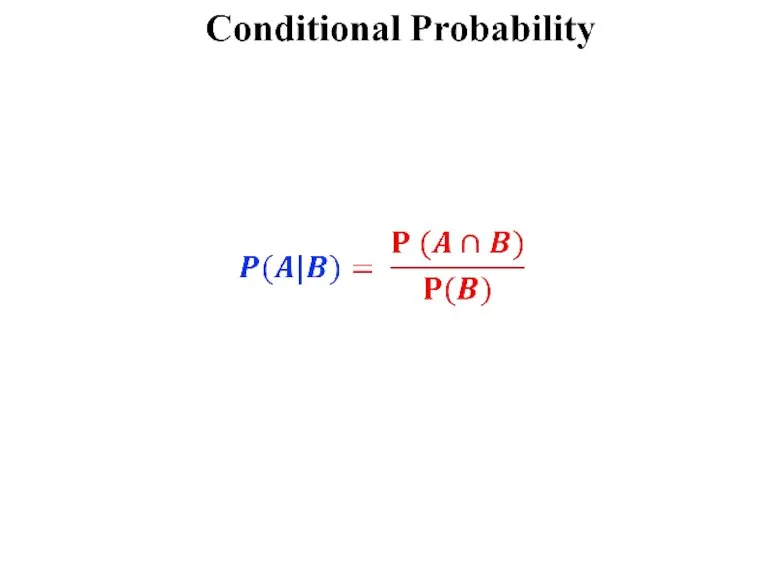
- 14. Conditional Probability An Interesting Kind of Probability Question “After this lecture, when I go to UI
- 15. Biryani ☺
- 16. Conditional Probability Of course, the vast majority of the food that the cafeteria prepares is NEITHER
- 17. Conditional Probability What is the probability that it will rain this afternoon, given that it is
- 18. Conditional Probability So, how to answer the “Food Court” question?
- 20. Why Do Tree Diagrams Work? We have solved multiple probability problems using tree diagrams Let’s think
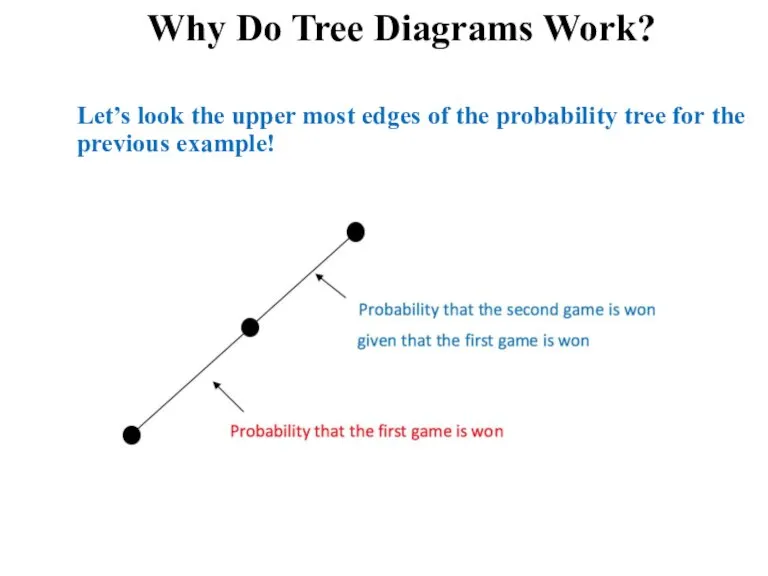
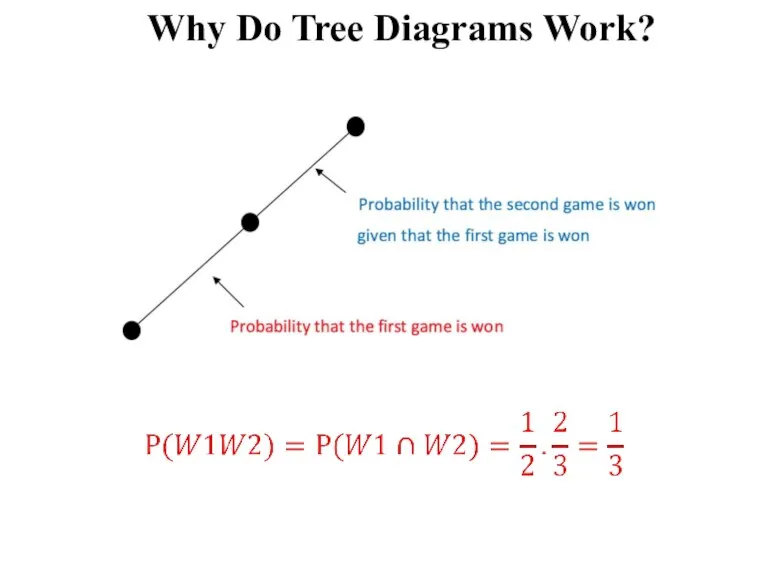
- 21. Why Do Tree Diagrams Work? Let’s look the upper most edges of the probability tree for
- 22. Why Do Tree Diagrams Work?
- 23. Why Do Tree Diagrams Work?
- 24. Why Do Tree Diagrams Work? “So the Product Rule is the formal justification for multiplying edge
- 31. What Independence Really Means? Are these events independent? A B
- 32. What Independence Really Means? Thus being dependent is completely different from being disjoint!
- 33. What Independence Really Means? Thus being dependent is completely different from being disjoint! Two events are
- 34. What Independence Really Means? Thus being dependent is completely different from being disjoint! Two events are
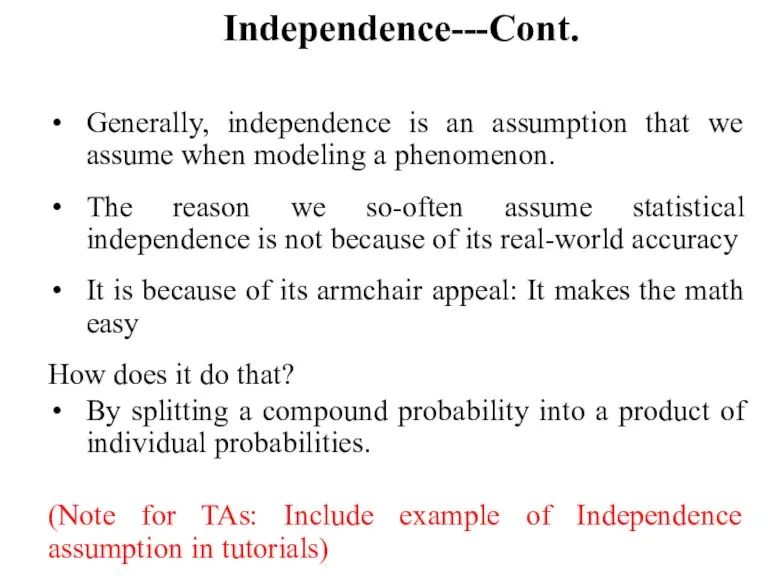
- 35. Independence---Cont. Generally, independence is an assumption that we assume when modeling a phenomenon. The reason we
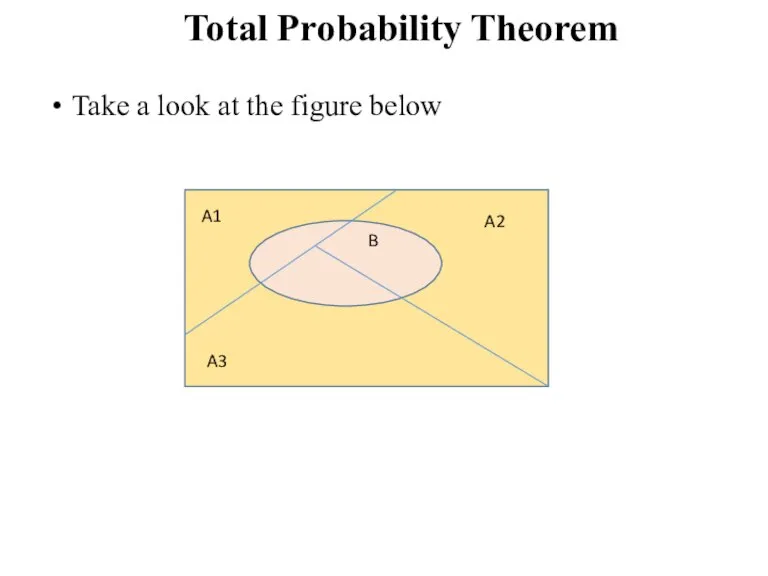
- 36. Total Probability Theorem Take a look at the figure below A1 A2 A3 B
- 37. Total Probability Theorem Take a look at the figure below A1 A2 A3 B
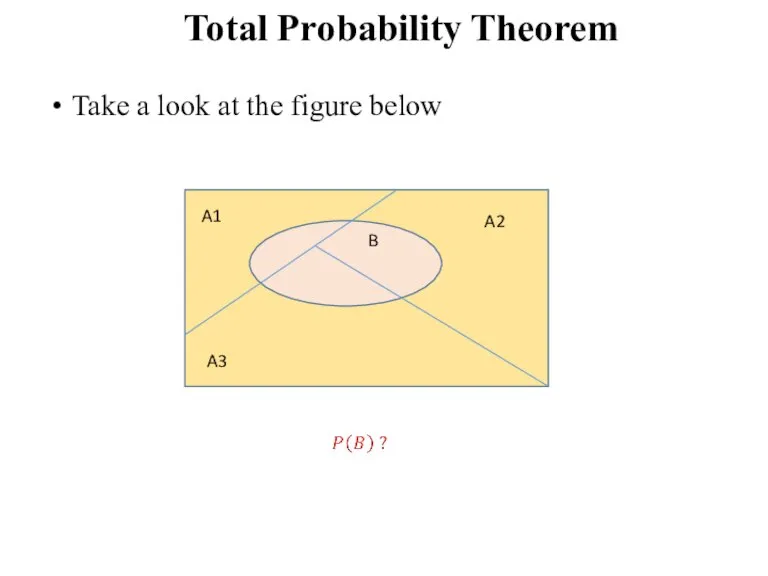
- 38. Total Probability Theorem Take a look at the figure below A1 A2 A3 B
- 39. Total Probability Theorem Take a look at the figure below A1 A2 A3 B
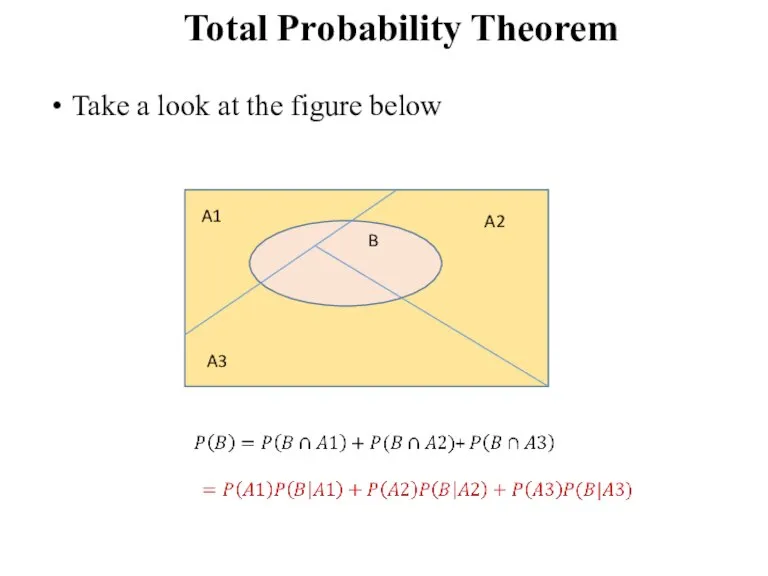
- 40. Total Probability Theorem Take a look at the figure below A1 A2 A3 B
- 41. Total Probability Theorem Where do we use it? Baye’s Theorem!
- 42. Medical Testing Problem Let’s assume a “not-so-perfect” test for a medical condition called BO suffered by
- 43. Probability Tree A: The test came positive B: The person has BO BO is suffered by
- 45. Conditional Probability Tree---Cont. Surprising, Right! So if the test comes out positive, the person has only
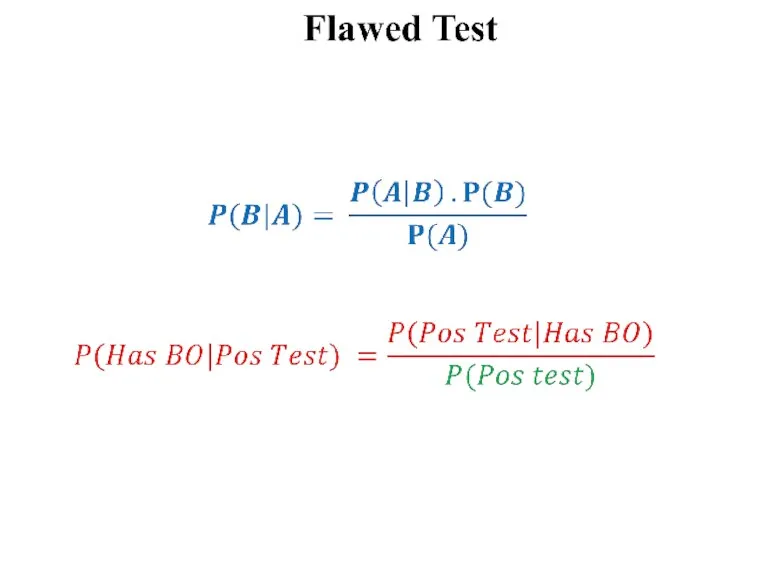
- 48. Bayes Theorem---Cont. A Posteriori Probabilities For example: The probability that it was cloudy this morning, given
- 54. Random Variables So far, we focused on probabilities of events. For example, The probability that someone
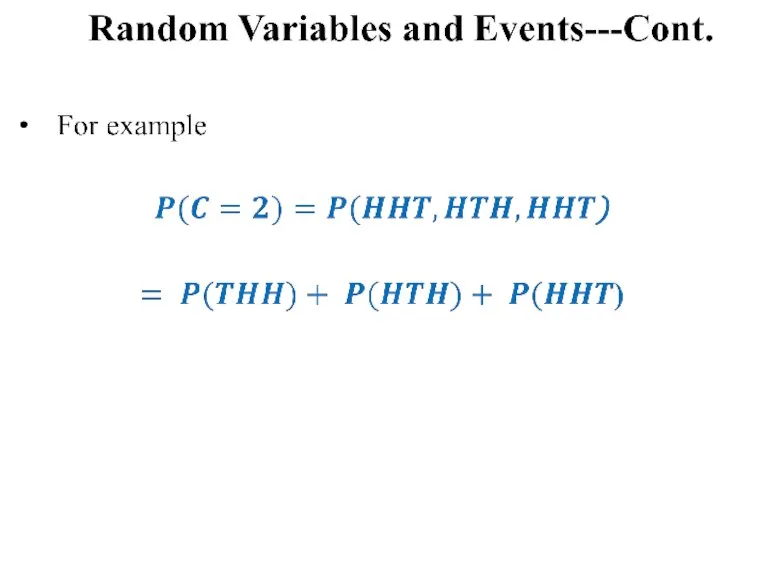
- 55. Random Variables But most often, we are interested in knowing more than this. For example, How
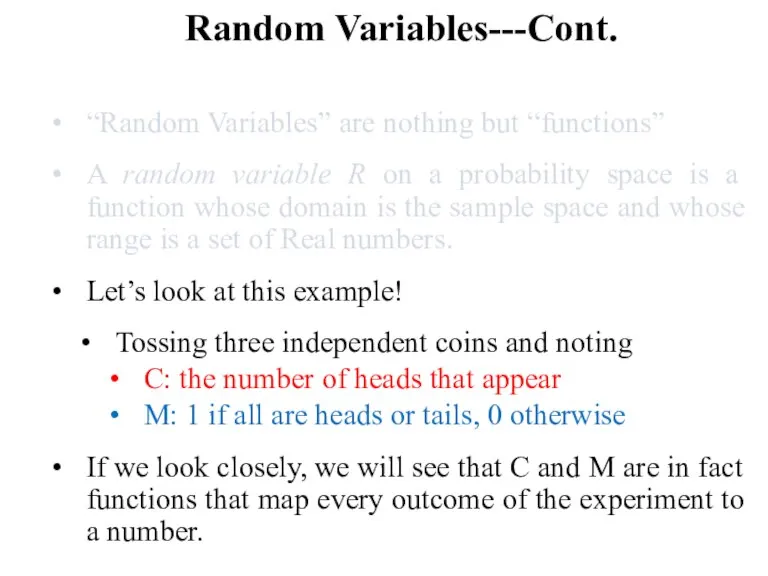
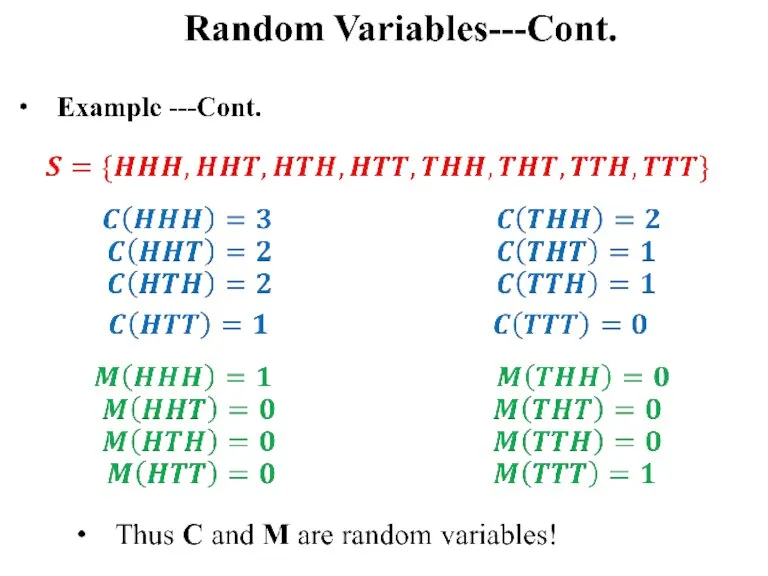
- 56. Random Variables---Cont. “Random Variables” are nothing but “functions” A random variable R on a probability space
- 57. Random Variables---Cont. “Random Variables” are nothing but “functions” A random variable R on a probability space
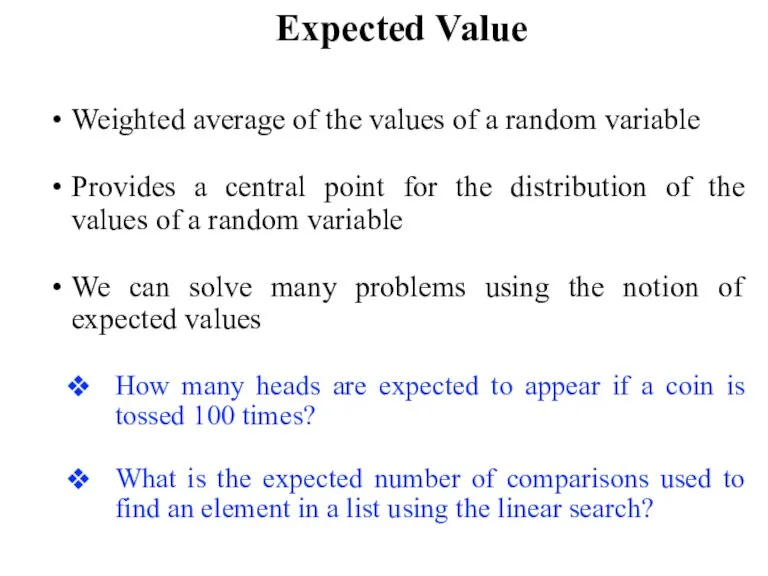
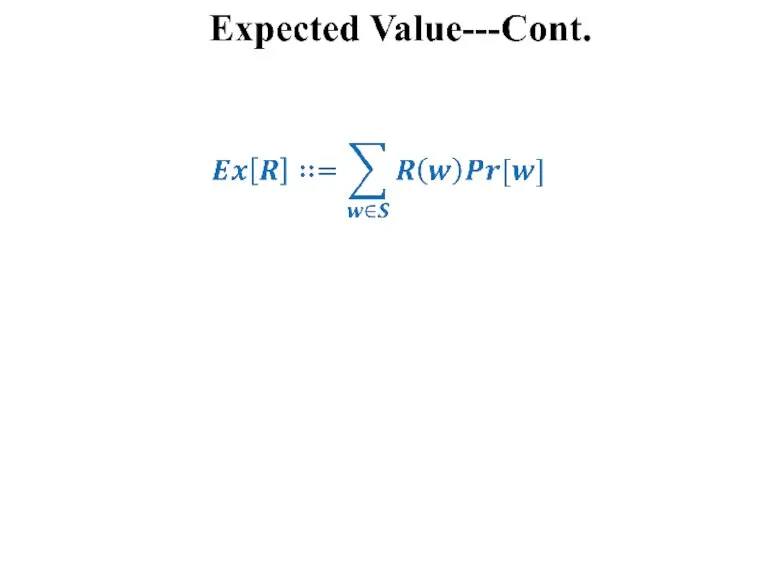
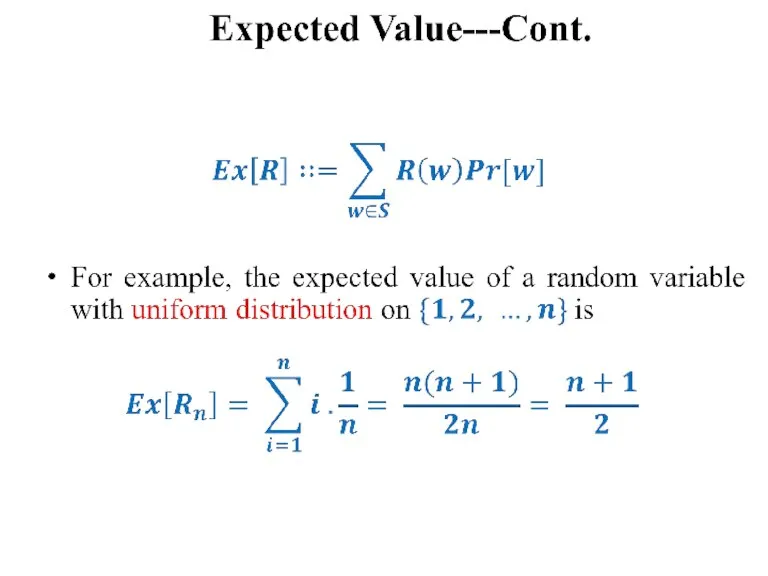
- 63. Expected Value Weighted average of the values of a random variable Provides a central point for
- 66. Variance Consider the following two gambling games: Game A: You win $2 with probability 2/3 and
- 67. Variance Let’s compute the expected return for both games:
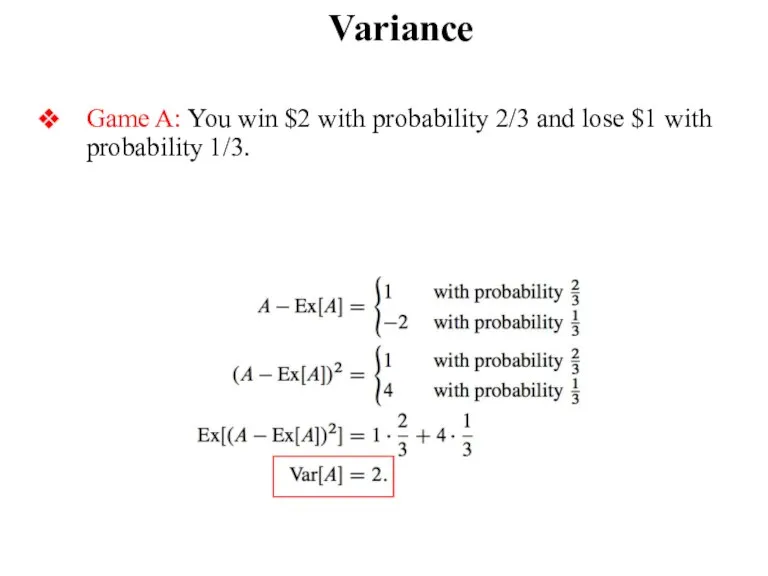
- 71. Variance Game A: You win $2 with probability 2/3 and lose $1 with probability 1/3.
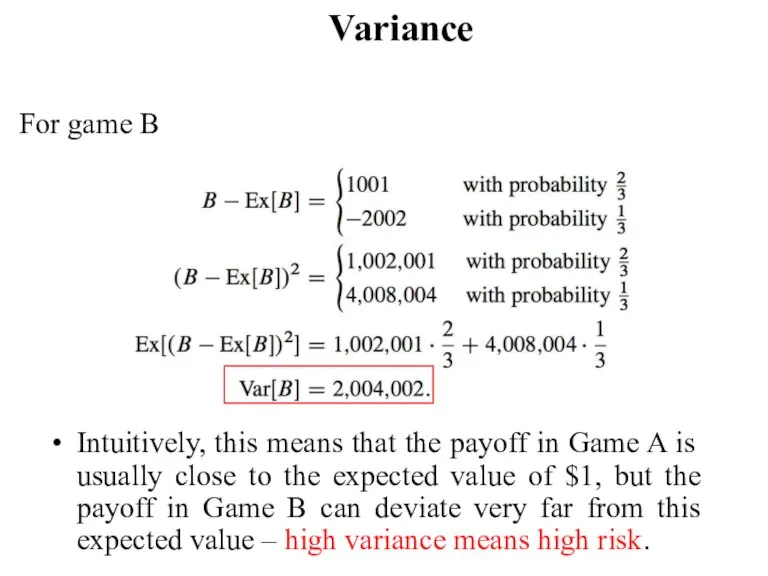
- 72. Variance For game B Intuitively, this means that the payoff in Game A is usually close
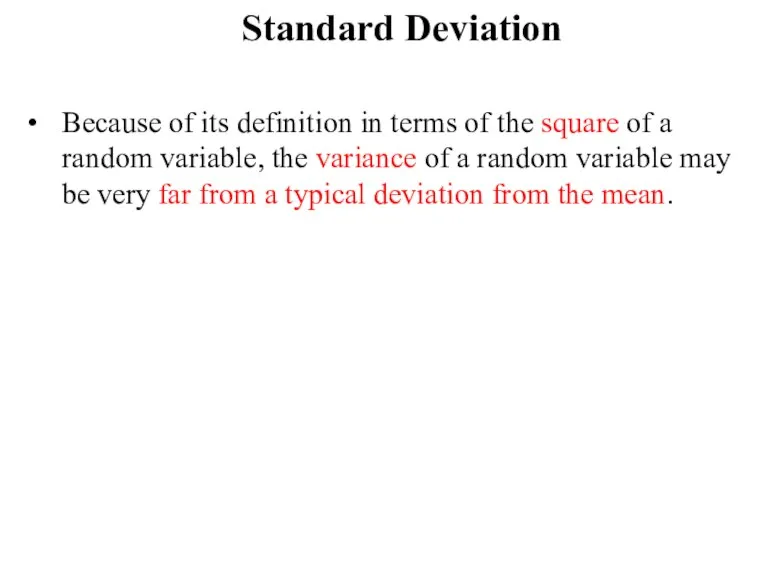
- 73. Standard Deviation Because of its definition in terms of the square of a random variable, the
- 74. Standard Deviation For example, in Game B above, the deviation from the mean is 1001 in
- 76. Скачать презентацию
Слайд 2Recap
Why should we learn Probability?
Formulating questions in terms of probability
Building the
Recap
Why should we learn Probability?
Formulating questions in terms of probability
Building the
Слайд 3Today’s Objectives
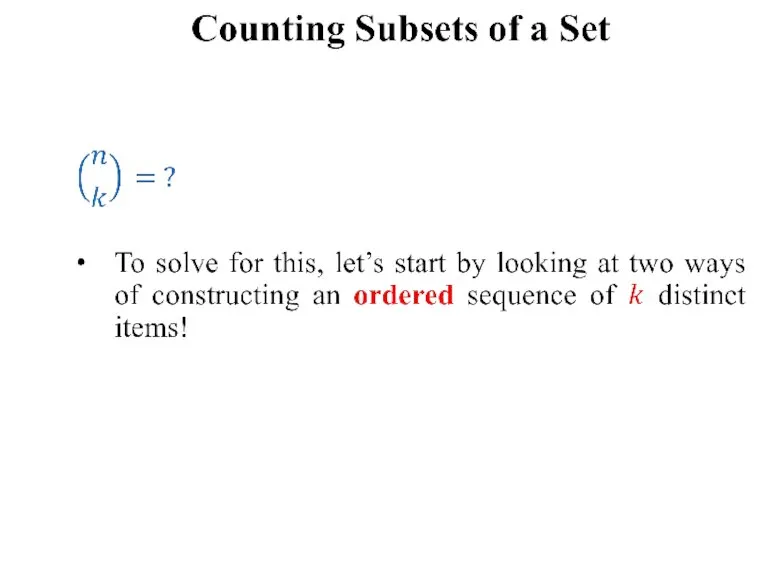
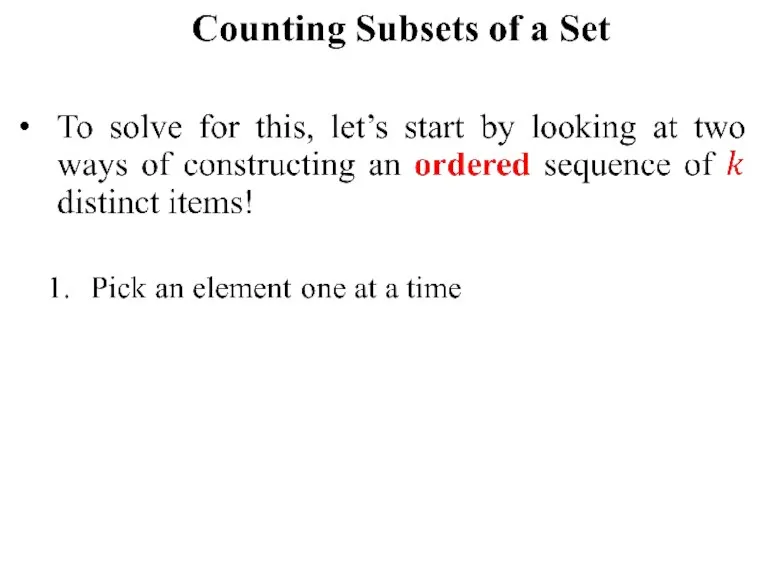
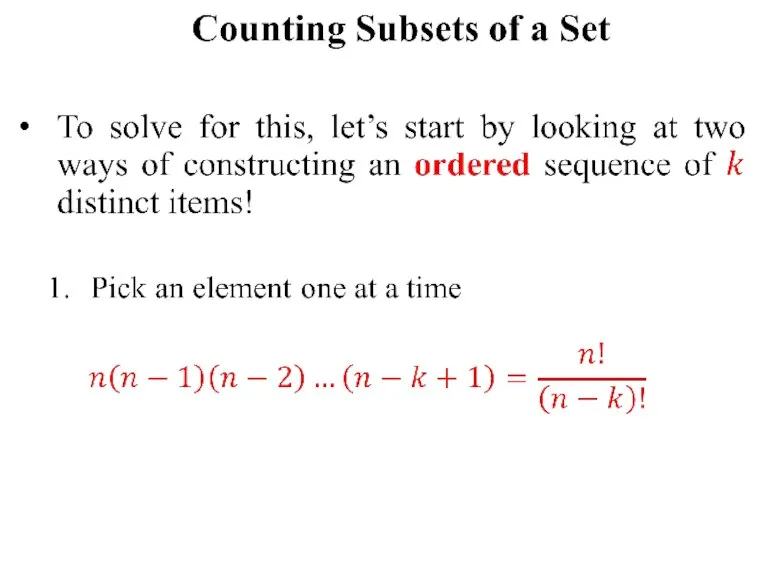
Counting subsets of a set
Conditional Probability
Independence
Total Probability Theorem
Baye’s theorem
Random variables
Today’s Objectives
Counting subsets of a set
Conditional Probability
Independence
Total Probability Theorem
Baye’s theorem
Random variables
Слайд 5Why Count Subsets of Set?
Example:
Suppose we select 5 cards at random
Why Count Subsets of Set?
Example:
Suppose we select 5 cards at random
Слайд 14Conditional Probability
An Interesting Kind of Probability Question
“After this lecture, when I
Conditional Probability
An Interesting Kind of Probability Question
“After this lecture, when I
Слайд 15Biryani ☺
Biryani ☺

Слайд 16Conditional Probability
Of course, the vast majority of the food that the
Conditional Probability
Of course, the vast majority of the food that the
Слайд 17Conditional Probability
What is the probability that it will rain this afternoon,
Conditional Probability
What is the probability that it will rain this afternoon,
Слайд 18Conditional Probability
So, how to answer the “Food Court” question?
Conditional Probability
So, how to answer the “Food Court” question?
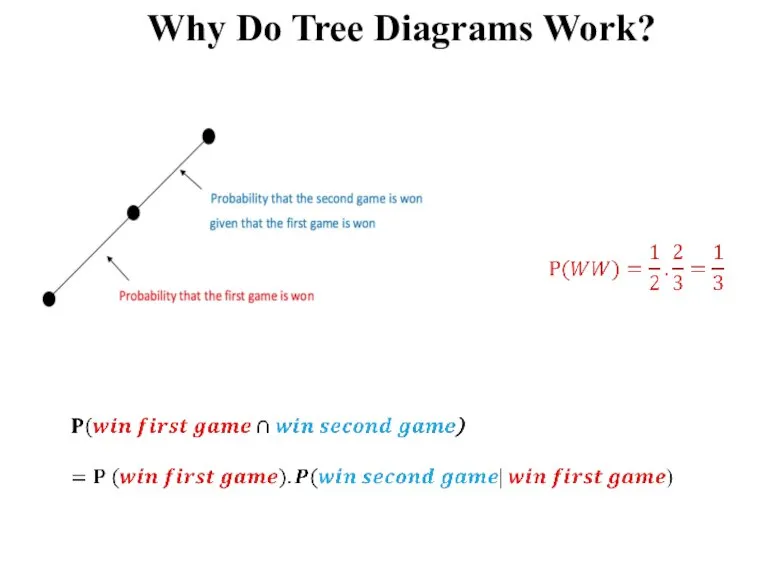
Слайд 20Why Do Tree Diagrams Work?
We have solved multiple probability problems using tree
Why Do Tree Diagrams Work?
We have solved multiple probability problems using tree
Слайд 21Why Do Tree Diagrams Work?
Let’s look the upper most edges of the
Why Do Tree Diagrams Work?
Let’s look the upper most edges of the
Слайд 22Why Do Tree Diagrams Work?
Why Do Tree Diagrams Work?
Слайд 23Why Do Tree Diagrams Work?
Why Do Tree Diagrams Work?
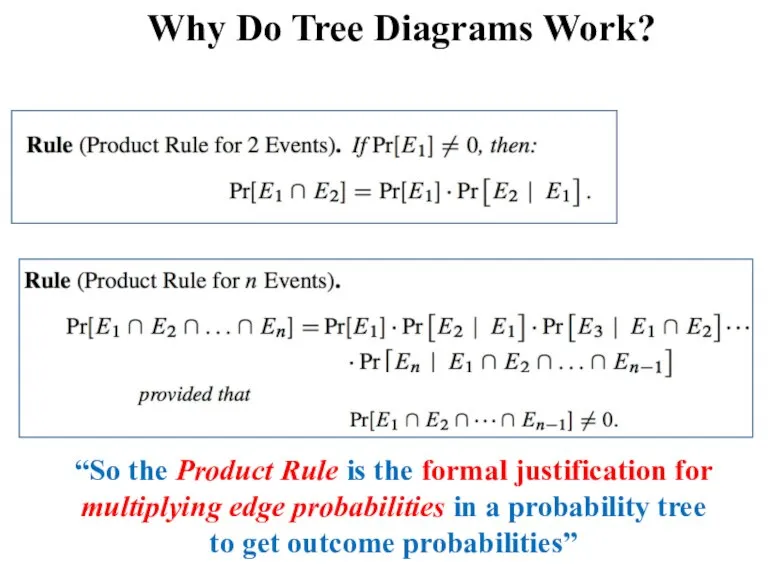
Слайд 24Why Do Tree Diagrams Work?
“So the Product Rule is the formal justification
Why Do Tree Diagrams Work?
“So the Product Rule is the formal justification
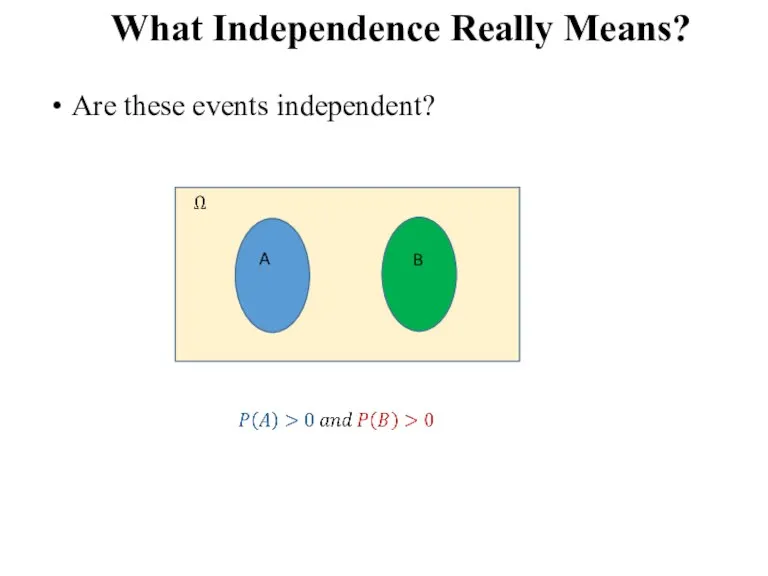
Слайд 31What Independence Really Means?
Are these events independent?
A
B
What Independence Really Means?
Are these events independent?
A
B
Слайд 32What Independence Really Means?
Thus being dependent is completely different from being disjoint!
What Independence Really Means?
Thus being dependent is completely different from being disjoint!
Слайд 33What Independence Really Means?
Thus being dependent is completely different from being disjoint!
Two
What Independence Really Means?
Thus being dependent is completely different from being disjoint!
Two
Слайд 34What Independence Really Means?
Thus being dependent is completely different from being disjoint!
Two
What Independence Really Means?
Thus being dependent is completely different from being disjoint!
Two
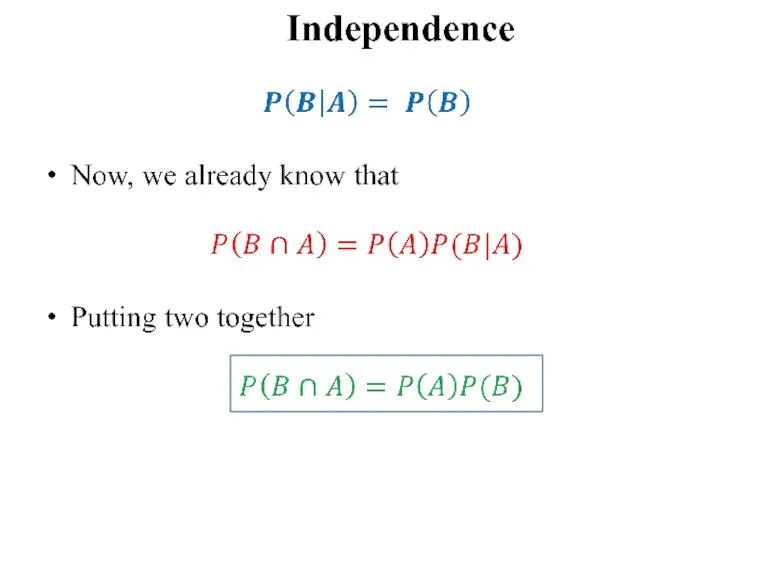
Слайд 35Independence---Cont.
Generally, independence is an assumption that we assume when modeling a
Independence---Cont.
Generally, independence is an assumption that we assume when modeling a
Слайд 36Total Probability Theorem
Take a look at the figure below
A1
A2
A3
B
Total Probability Theorem
Take a look at the figure below
A1
A2
A3
B
Слайд 37Total Probability Theorem
Take a look at the figure below
A1
A2
A3
B
Total Probability Theorem
Take a look at the figure below
A1
A2
A3
B
Слайд 38Total Probability Theorem
Take a look at the figure below
A1
A2
A3
B
Total Probability Theorem
Take a look at the figure below
A1
A2
A3
B

Слайд 39Total Probability Theorem
Take a look at the figure below
A1
A2
A3
B
Total Probability Theorem
Take a look at the figure below
A1
A2
A3
B
Слайд 40Total Probability Theorem
Take a look at the figure below
A1
A2
A3
B
Total Probability Theorem
Take a look at the figure below
A1
A2
A3
B

Слайд 41Total Probability Theorem
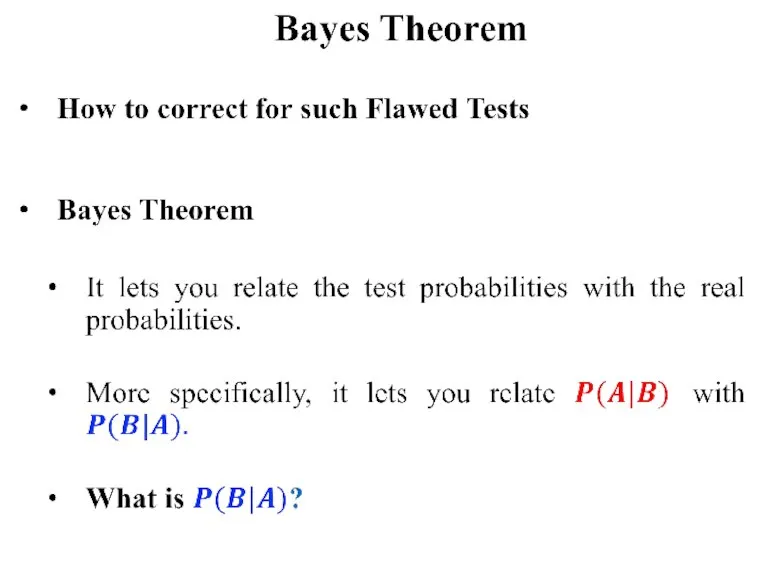
Where do we use it?
Baye’s Theorem!
Total Probability Theorem
Where do we use it?
Baye’s Theorem!
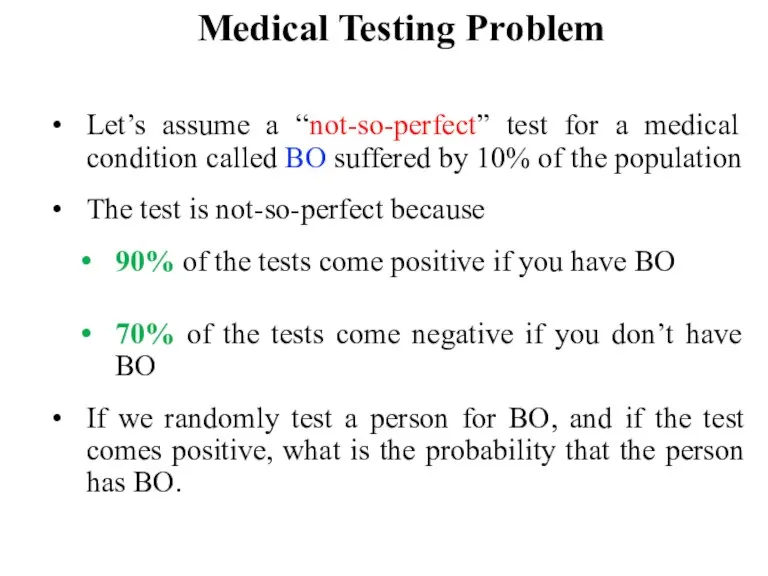
Слайд 42Medical Testing Problem
Let’s assume a “not-so-perfect” test for a medical condition called
Medical Testing Problem
Let’s assume a “not-so-perfect” test for a medical condition called
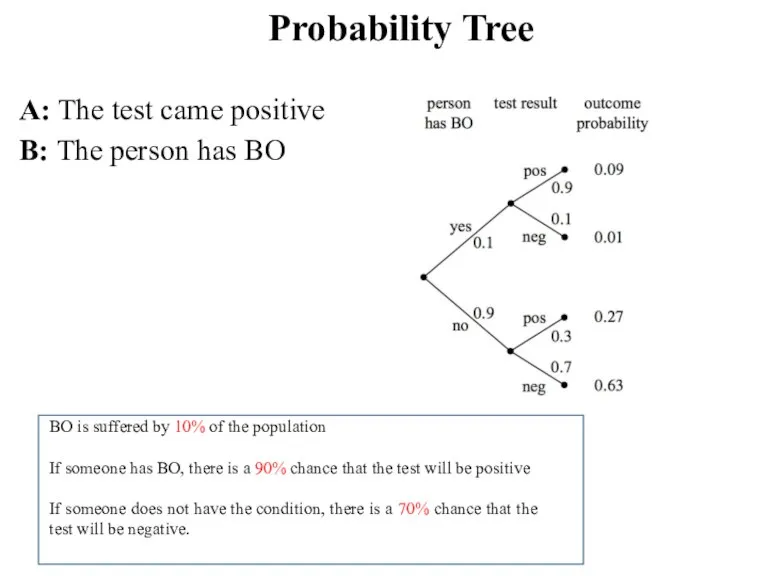
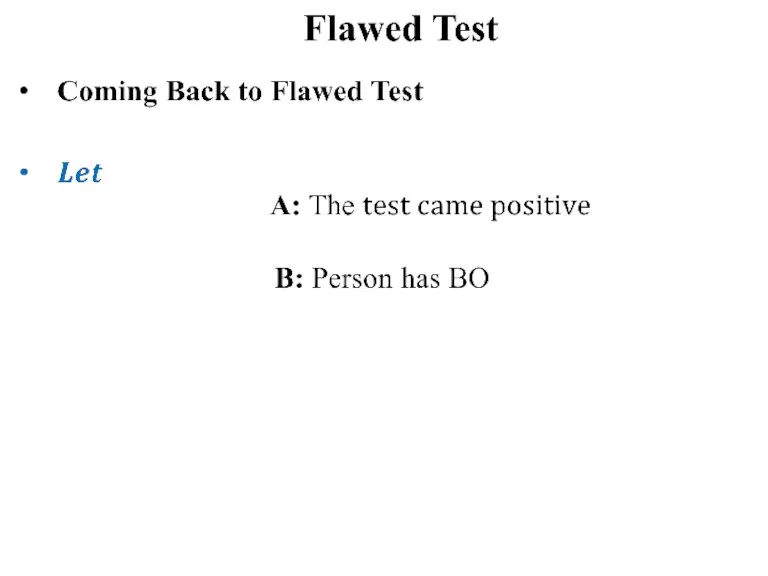
Слайд 43Probability Tree
A: The test came positive
B: The person has BO
BO is
Probability Tree
A: The test came positive
B: The person has BO
BO is
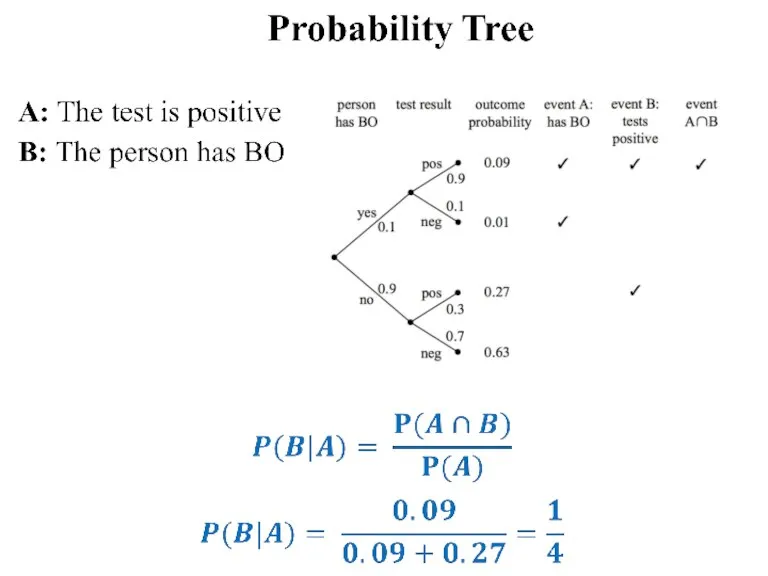
Слайд 45Conditional Probability Tree---Cont.
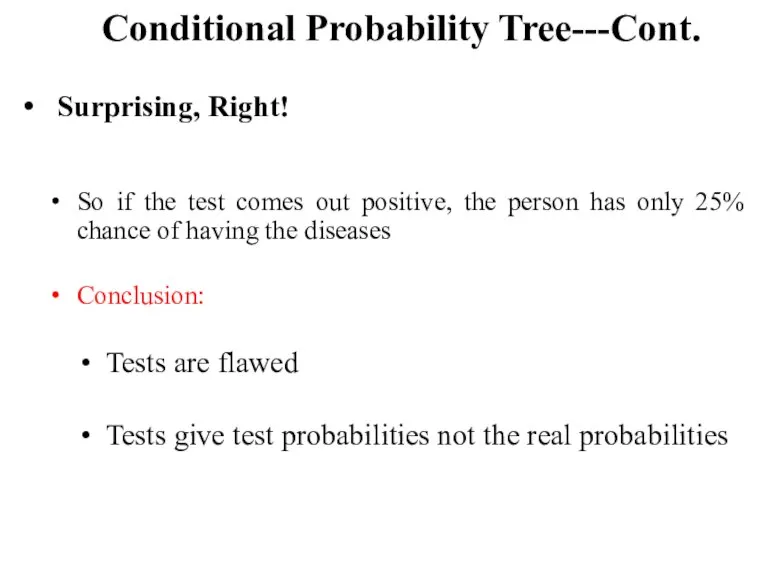
Surprising, Right!
So if the test comes out positive, the
Conditional Probability Tree---Cont.
Surprising, Right!
So if the test comes out positive, the
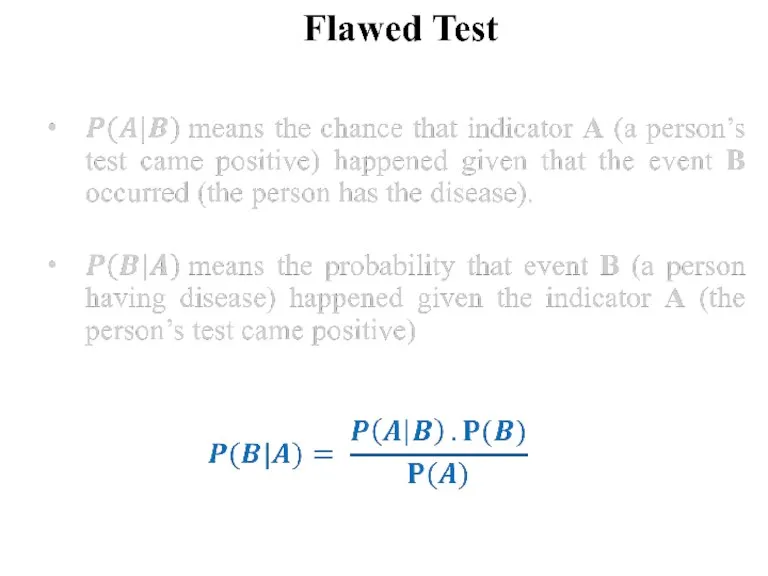
Слайд 48Bayes Theorem---Cont.
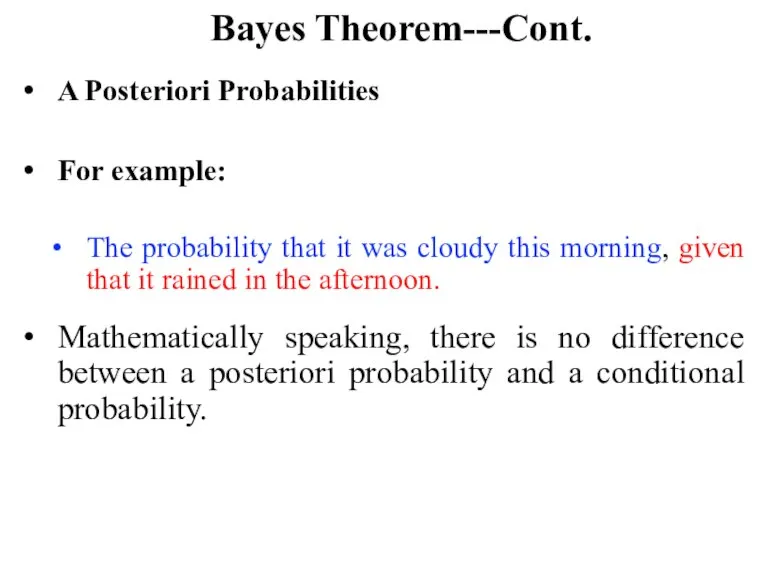
A Posteriori Probabilities
For example:
The probability that it was cloudy
Bayes Theorem---Cont.
A Posteriori Probabilities
For example:
The probability that it was cloudy
Слайд 54Random Variables
So far, we focused on probabilities of events.
For example,
The
Random Variables
So far, we focused on probabilities of events.
For example,
The
Слайд 55Random Variables
But most often, we are interested in knowing more than
Random Variables
But most often, we are interested in knowing more than
Слайд 56Random Variables---Cont.
“Random Variables” are nothing but “functions”
A random variable R on a
Random Variables---Cont.
“Random Variables” are nothing but “functions”
A random variable R on a
Слайд 57Random Variables---Cont.
“Random Variables” are nothing but “functions”
A random variable R on a
Random Variables---Cont.
“Random Variables” are nothing but “functions”
A random variable R on a

Слайд 63Expected Value
Weighted average of the values of a random variable
Provides a central
Expected Value
Weighted average of the values of a random variable
Provides a central
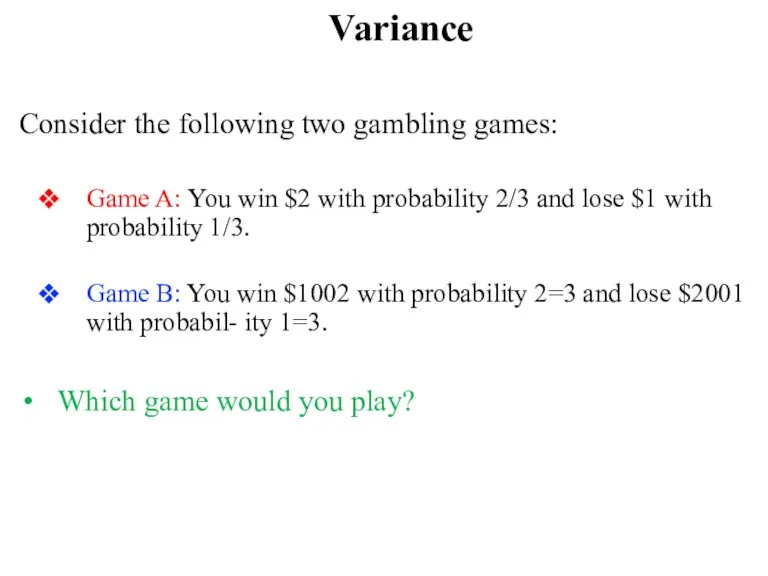
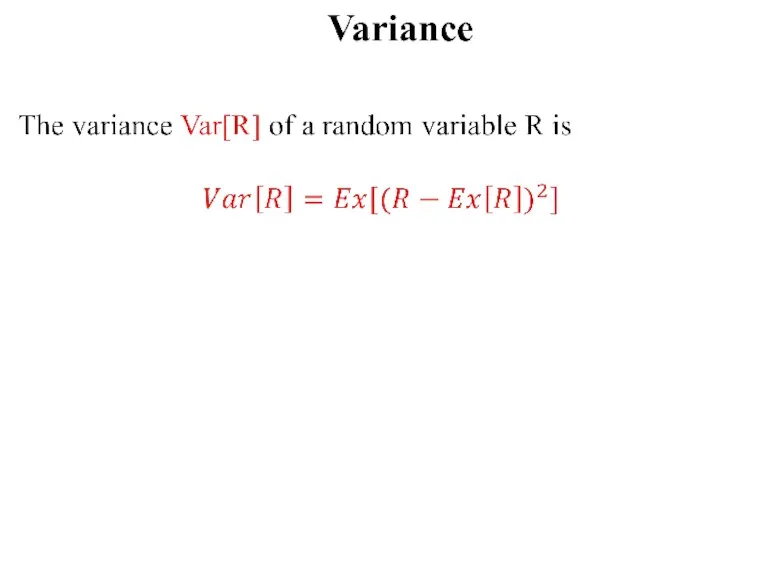
Слайд 66Variance
Consider the following two gambling games:
Game A: You win $2 with
Variance
Consider the following two gambling games:
Game A: You win $2 with
Слайд 67Variance
Let’s compute the expected return for both games:
Variance
Let’s compute the expected return for both games:
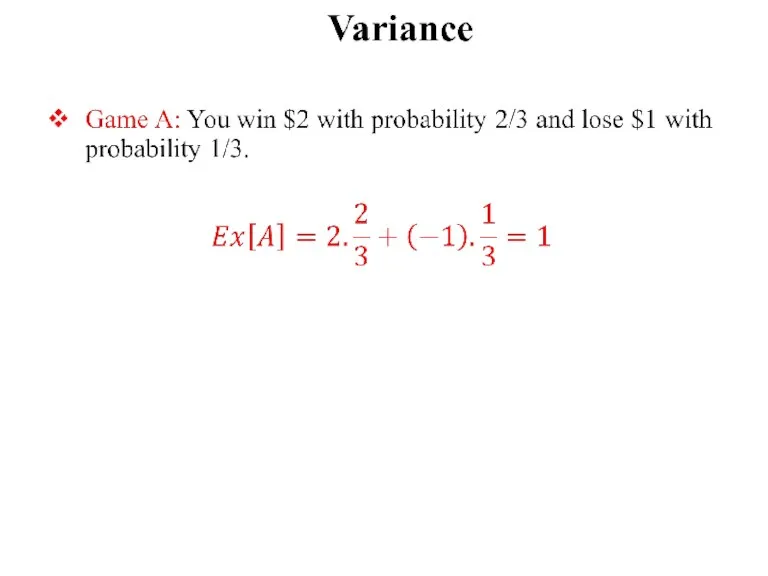
Слайд 71Variance
Game A: You win $2 with probability 2/3 and lose $1
Variance
Game A: You win $2 with probability 2/3 and lose $1
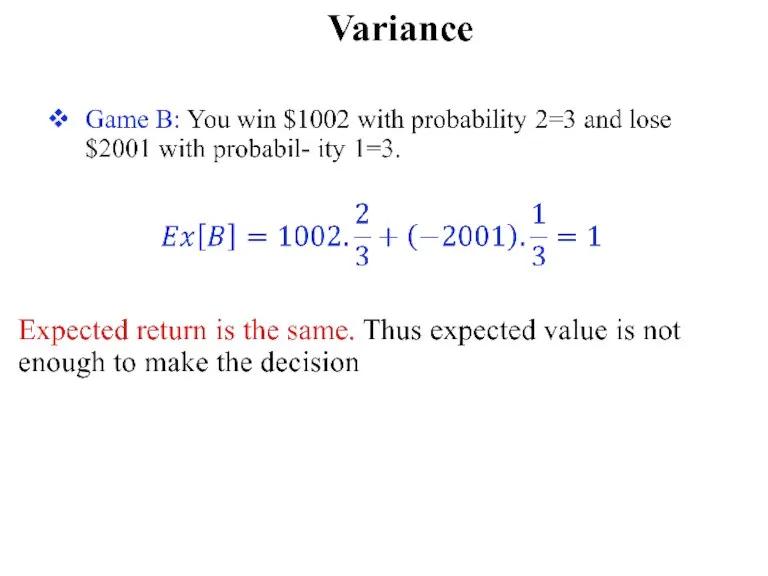
Слайд 72Variance
For game B
Intuitively, this means that the payoff in Game A
Variance
For game B
Intuitively, this means that the payoff in Game A
Слайд 73Standard Deviation
Because of its definition in terms of the square of
Standard Deviation
Because of its definition in terms of the square of
Слайд 74Standard Deviation
For example, in Game B above, the deviation from the
Standard Deviation
For example, in Game B above, the deviation from the

 See on taime organ See voib olla soodav voi mittesoodav See tekib uhel taime eluperioodil Selle abil taim voib paljuneda kogu maailmas
 Из чего состоит системный блок компьютера
 Обеспечение информационного взаимодействия программных средств декларанта – АПС «ЭПС» при декларировании товаров в электронной
 О вреде курения.
 Женский костюм Белгородского края
 Организация месячника военнопатриотической и оборонно-массовой работы в ОО
 ребусы РС 2022г
 ЮРИЙ ДОЛГОРУКИЙ Памятники Юрию Долгорукому в Москве.
 Аптраковский селский дом культуры
 Презентация на тему Движения земной коры
 Презентация 12 декабря
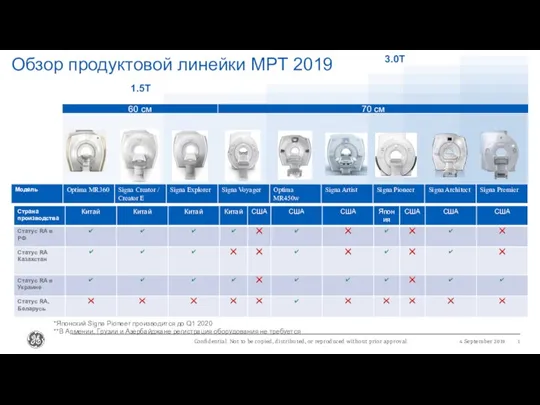 Обзор продуктовой линейки МРТ 2019
 Моль
Моль Декоративно-прикладное искусство Западной Европы XVII в. 5 класс
 horse
horse Многогранники в архитектуре
 Изучение административного устройства Ростовской области
 Виды соединений материалов. Резьбовые соединения
 Microsoft Dynamics Axapta
 Физиология выделения
 Анна Анастази (1908–2001)
 Сердечно-легочнаяреанимация.
 Мультимедиа.Аналоговой и цифровой звук
 CARCINOMA OF GALLBLADDER AND CHOLICYSTITIS
 Коренной перелом в Великой Отечественной войне
 Основы теории построения чертежа
 Мотивирование топ-менеджеров
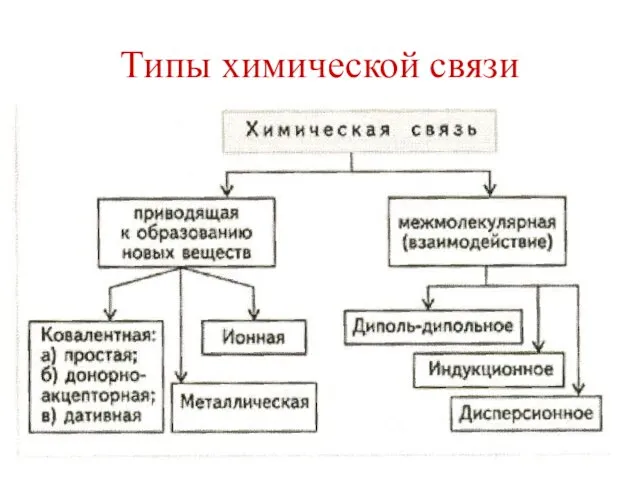 Презентация на тему Типы химической связи