- Process Analysis

Содержание
- 2. Process Analysis Process Flowcharting Types of Processes Process Performance Metrics OBJECTIVES
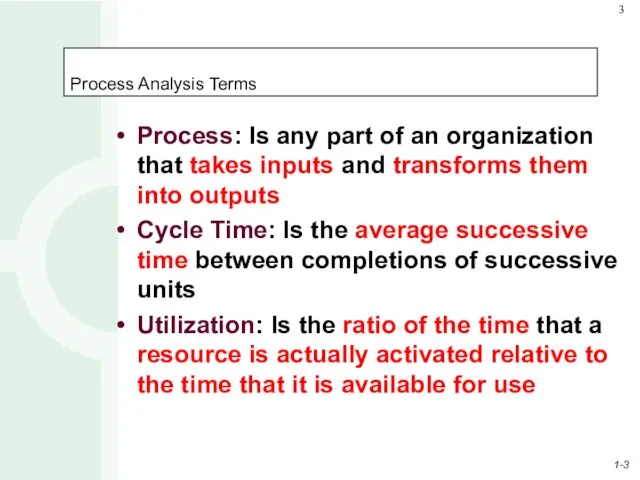
- 3. Process Analysis Terms Process: Is any part of an organization that takes inputs and transforms them
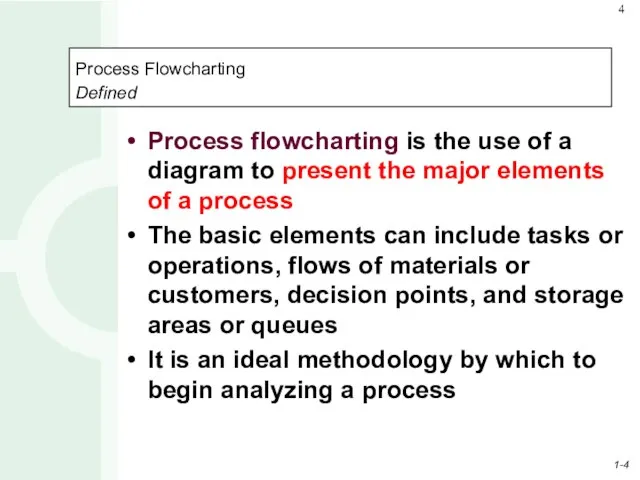
- 4. Process Flowcharting Defined Process flowcharting is the use of a diagram to present the major elements
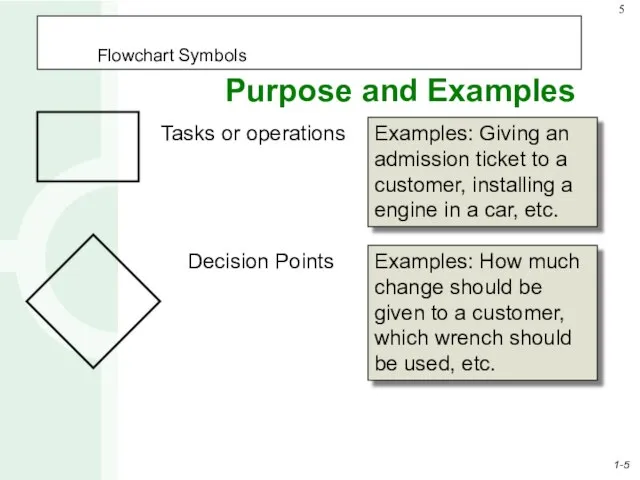
- 5. Examples: Giving an admission ticket to a customer, installing a engine in a car, etc. Examples:
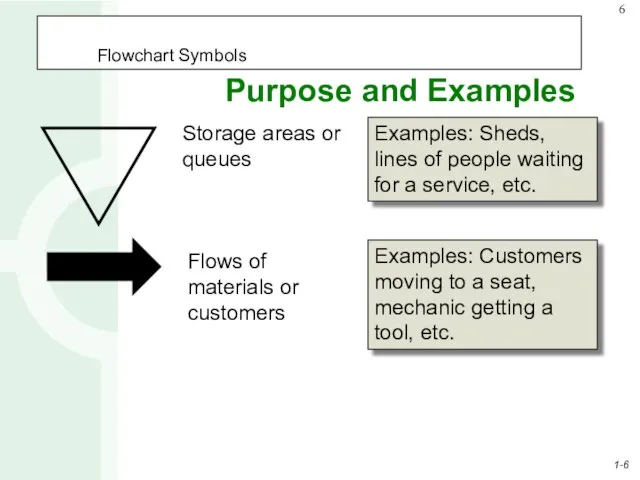
- 6. Examples: Sheds, lines of people waiting for a service, etc. Examples: Customers moving to a seat,
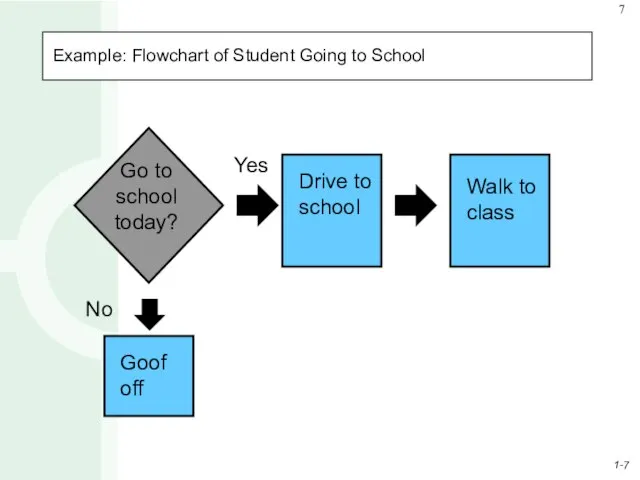
- 7. Example: Flowchart of Student Going to School
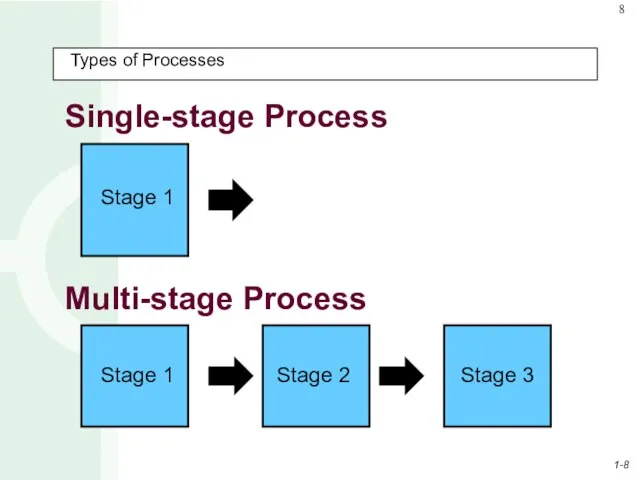
- 8. Types of Processes
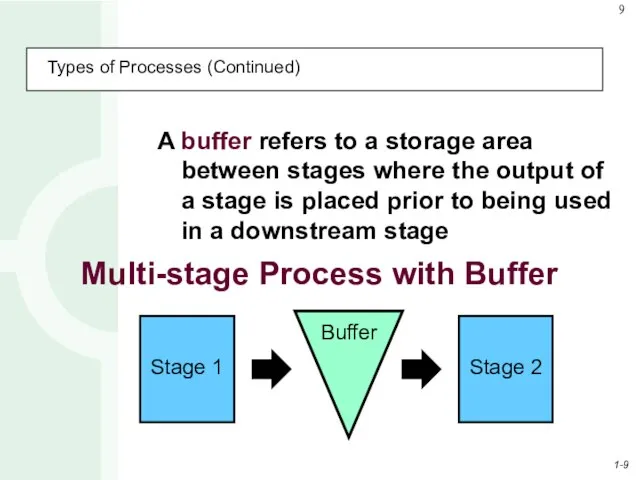
- 9. Types of Processes (Continued) A buffer refers to a storage area between stages where the output
- 10. Other Process Terminology Blocking Occurs when the activities in a stage must stop because there is
- 11. Other Process Terminology (Continued) Bottleneck Occurs when the limited capacity of a process causes work to
- 12. Other Types of Processes Make-to-order Only activated in response to an actual order Both work-in-process and
- 13. Process Performance Metrics Operation time = Setup time + Run time setup time= preparation time run
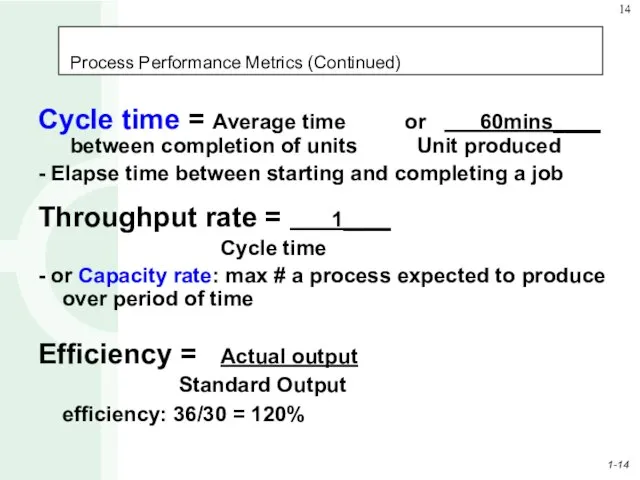
- 14. Process Performance Metrics (Continued) Cycle time = Average time or 60mins____ between completion of units Unit
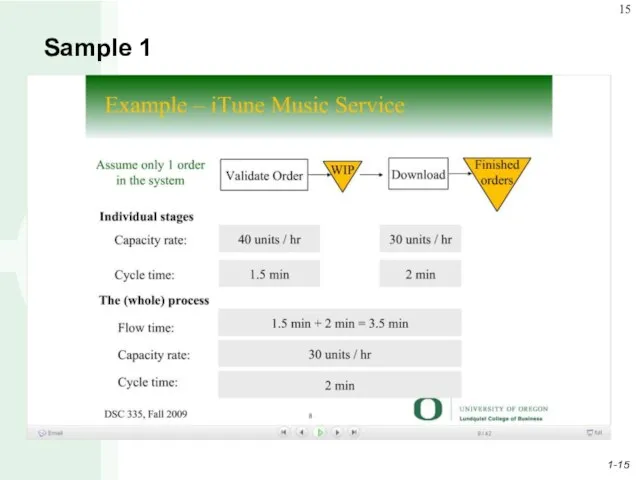
- 15. Sample 1
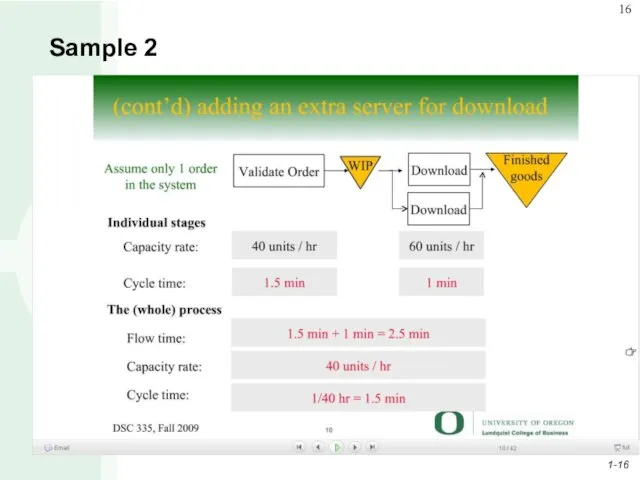
- 16. Sample 2
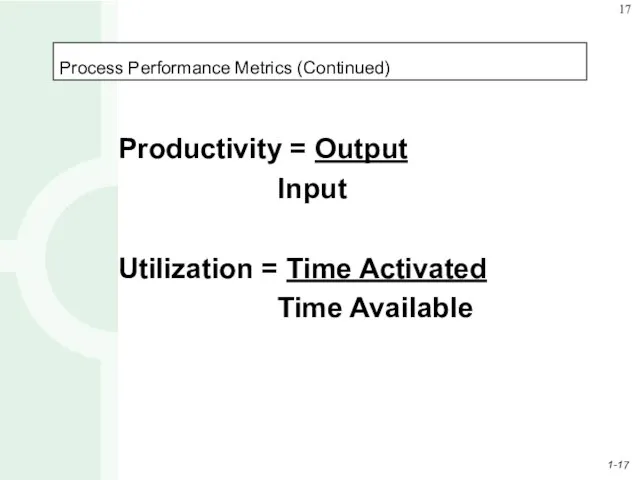
- 17. Process Performance Metrics (Continued) Productivity = Output Input Utilization = Time Activated Time Available
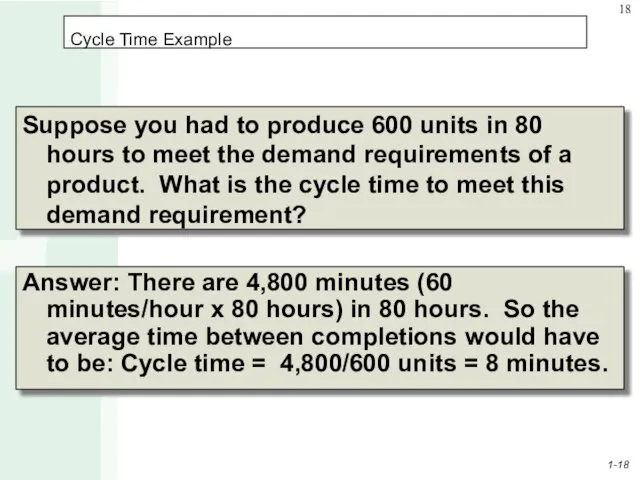
- 18. Cycle Time Example Suppose you had to produce 600 units in 80 hours to meet the
- 19. Process Throughput Time Reduction Perform activities in parallel Change the sequence of activities Reduce interruptions
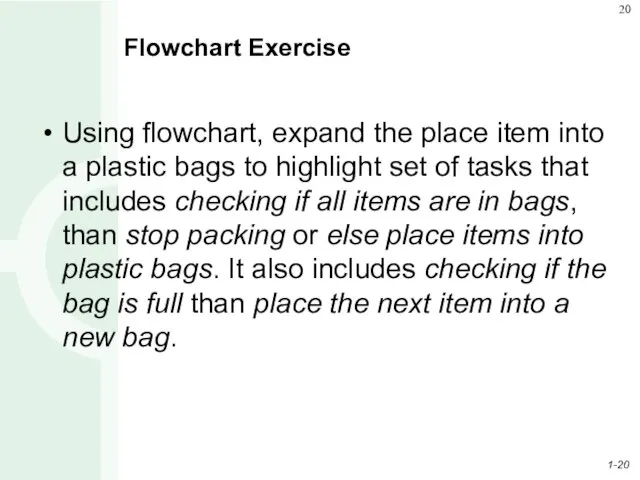
- 20. Flowchart Exercise Using flowchart, expand the place item into a plastic bags to highlight set of
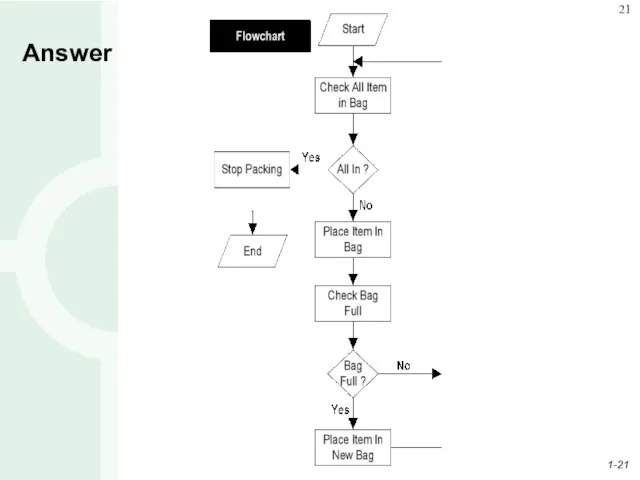
- 21. Answer
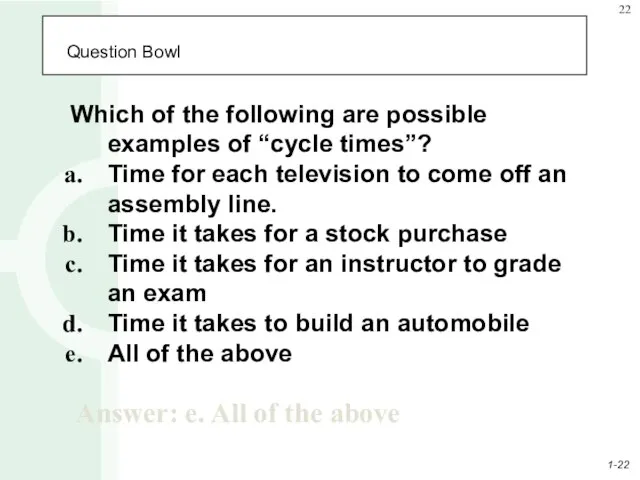
- 22. Question Bowl Which of the following are possible examples of “cycle times”? Time for each television
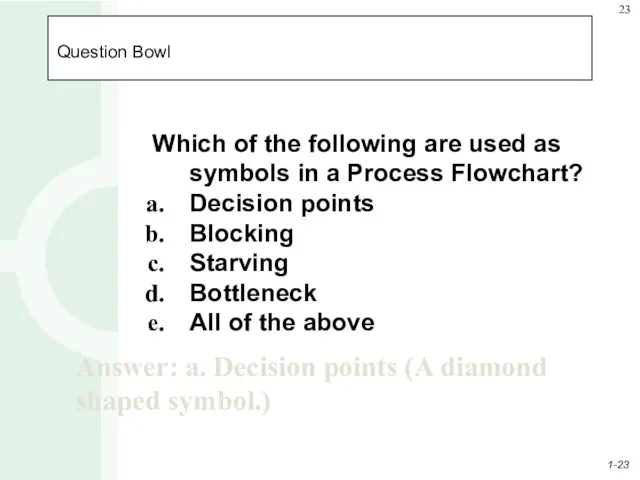
- 23. Question Bowl Which of the following are used as symbols in a Process Flowchart? Decision points
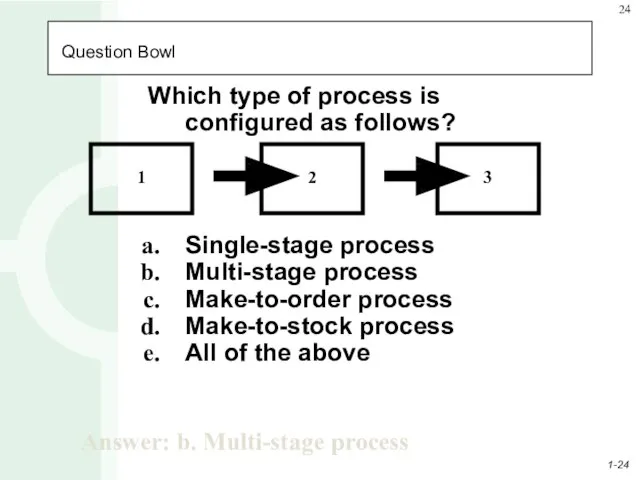
- 24. Question Bowl Which type of process is configured as follows? Single-stage process Multi-stage process Make-to-order process
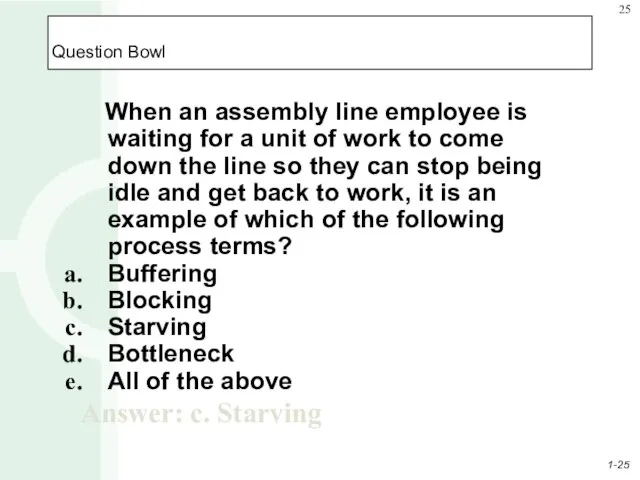
- 25. Question Bowl When an assembly line employee is waiting for a unit of work to come
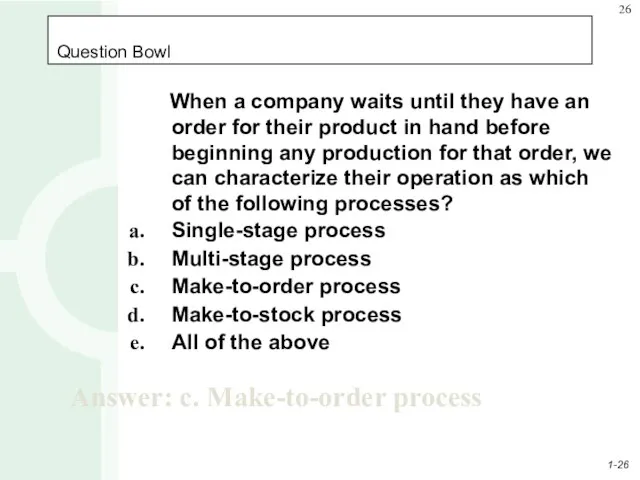
- 26. Question Bowl When a company waits until they have an order for their product in hand
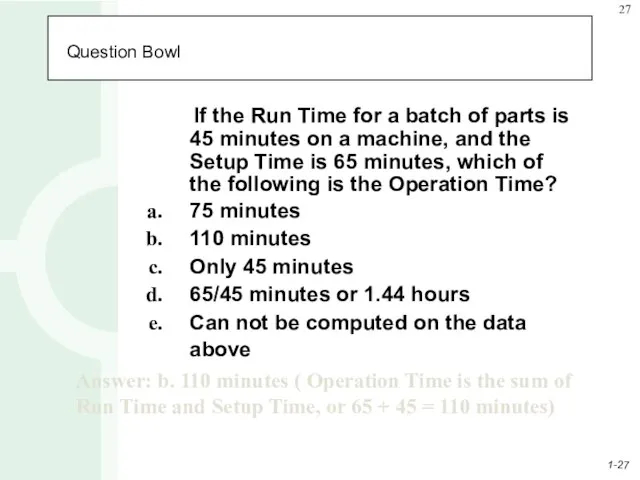
- 27. Question Bowl If the Run Time for a batch of parts is 45 minutes on a
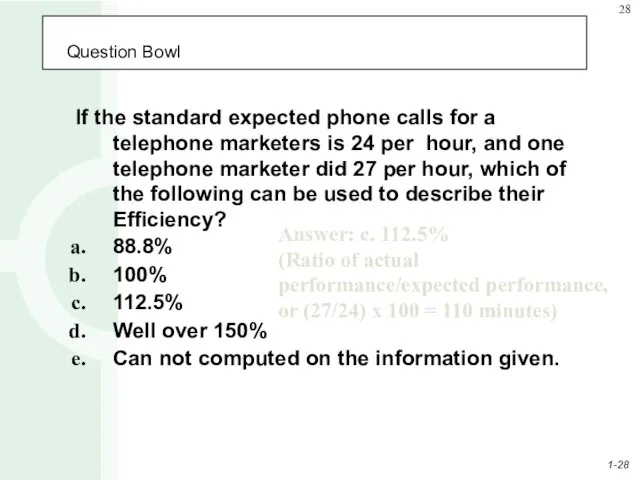
- 28. Question Bowl If the standard expected phone calls for a telephone marketers is 24 per hour,
- 30. Скачать презентацию
Слайд 3Process Analysis Terms
Process: Is any part of an organization that takes inputs
Process Analysis Terms
Process: Is any part of an organization that takes inputs
Слайд 4Process Flowcharting
Defined
Process flowcharting is the use of a diagram to present
Process Flowcharting
Defined
Process flowcharting is the use of a diagram to present
Слайд 5Examples: Giving an admission ticket to a customer, installing a engine in
Examples: Giving an admission ticket to a customer, installing a engine in
Слайд 6Examples: Sheds, lines of people waiting for a service, etc.
Examples: Customers moving
Examples: Sheds, lines of people waiting for a service, etc.
Examples: Customers moving
Слайд 7Example: Flowchart of Student Going to School
Example: Flowchart of Student Going to School
Слайд 8Types of Processes
Types of Processes
Слайд 9Types of Processes (Continued)
A buffer refers to a storage area between stages
Types of Processes (Continued)
A buffer refers to a storage area between stages
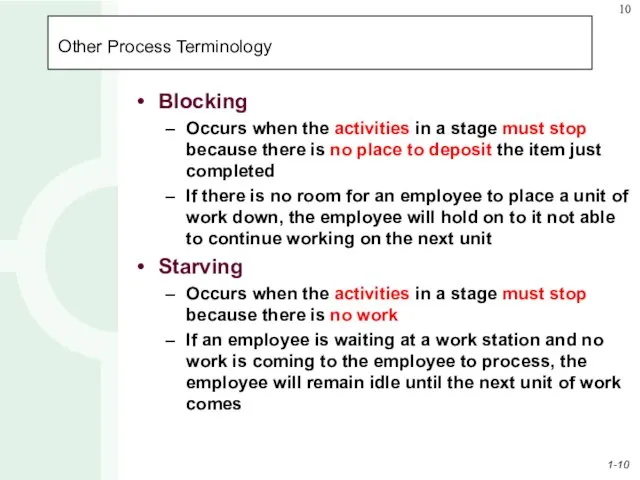
Слайд 10Other Process Terminology
Blocking
Occurs when the activities in a stage must stop because
Other Process Terminology
Blocking
Occurs when the activities in a stage must stop because
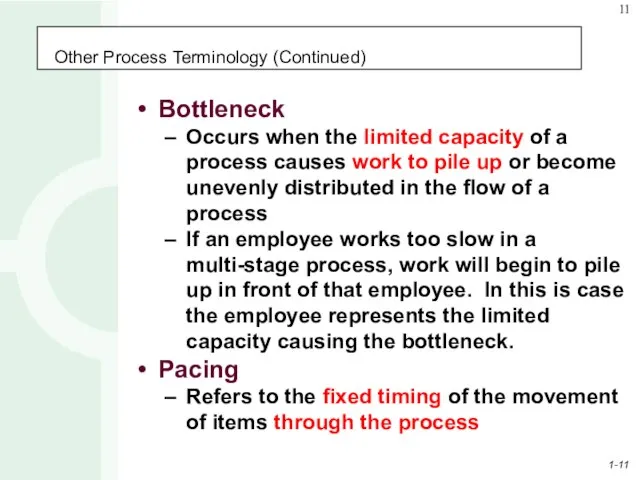
Слайд 11Other Process Terminology (Continued)
Bottleneck
Occurs when the limited capacity of a process causes
Other Process Terminology (Continued)
Bottleneck
Occurs when the limited capacity of a process causes
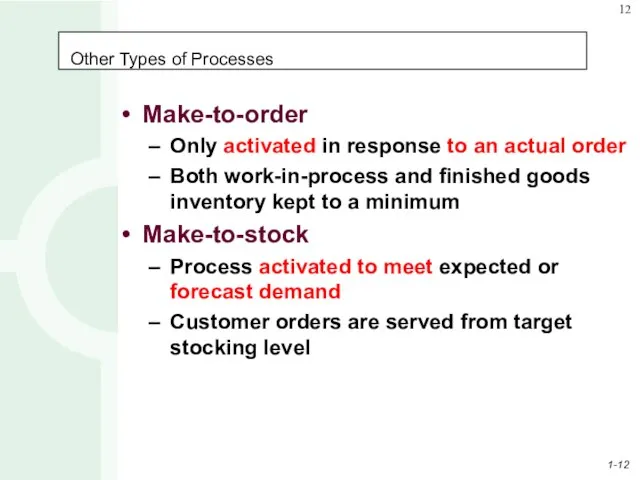
Слайд 12Other Types of Processes
Make-to-order
Only activated in response to an actual order
Both work-in-process
Other Types of Processes
Make-to-order
Only activated in response to an actual order
Both work-in-process
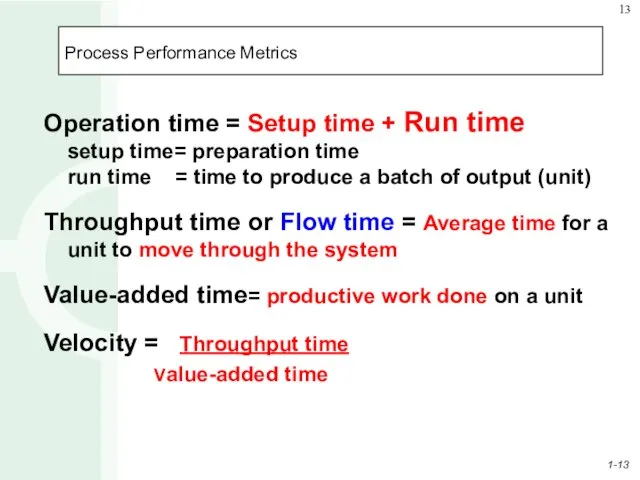
Слайд 13Process Performance Metrics
Operation time = Setup time + Run time
setup time= preparation
Process Performance Metrics
Operation time = Setup time + Run time
setup time= preparation
Слайд 14Process Performance Metrics (Continued)
Cycle time = Average time or 60mins____
between completion of
Process Performance Metrics (Continued)
Cycle time = Average time or 60mins____ between completion of
Слайд 15Sample 1
Sample 1
Слайд 16Sample 2
Sample 2
Слайд 17Process Performance Metrics (Continued)
Productivity = Output
Input
Utilization = Time Activated
Time Available
Process Performance Metrics (Continued)
Productivity = Output
Input
Utilization = Time Activated
Time Available
Слайд 18Cycle Time Example
Suppose you had to produce 600 units in 80 hours
Cycle Time Example
Suppose you had to produce 600 units in 80 hours
Слайд 19Process Throughput Time Reduction
Perform activities in parallel
Change the sequence of activities
Reduce
Process Throughput Time Reduction
Perform activities in parallel
Change the sequence of activities
Reduce
Слайд 20Flowchart Exercise
Using flowchart, expand the place item into a plastic bags to
Flowchart Exercise
Using flowchart, expand the place item into a plastic bags to
Слайд 21Answer
Answer
Слайд 22 Question Bowl
Which of the following are possible examples of “cycle times”?
Time
Question Bowl
Which of the following are possible examples of “cycle times”?
Time
Слайд 23 Question Bowl
Which of the following are used as symbols in a
Question Bowl
Which of the following are used as symbols in a
Слайд 24 Question Bowl
Which type of process is configured as follows?
Single-stage process
Multi-stage process
Make-to-order
Question Bowl
Which type of process is configured as follows?
Single-stage process
Multi-stage process
Make-to-order
Слайд 25 Question Bowl
When an assembly line employee is waiting for a
Question Bowl
When an assembly line employee is waiting for a
Слайд 26 Question Bowl
When a company waits until they have an order
Question Bowl
When a company waits until they have an order
Слайд 27 Question Bowl
If the Run Time for a batch of parts
Question Bowl
If the Run Time for a batch of parts
Слайд 28 Question Bowl
If the standard expected phone calls for a telephone marketers
Question Bowl
If the standard expected phone calls for a telephone marketers
 Праздник Светлой Пасхи
 Презентация на тему Проект "Полетели в космос"
 Проще чем одолжить деньги у Родственников !
 ID- карта
 Проблемы разработки и внедрения административного регламента оказания государственных и муниципальных услуг в сфере предоставл
 Расчёт и выбор конструкции кожухотрубного теплообменного аппарата
 Недетские проблемы детского чтения
 Столица Великобритании
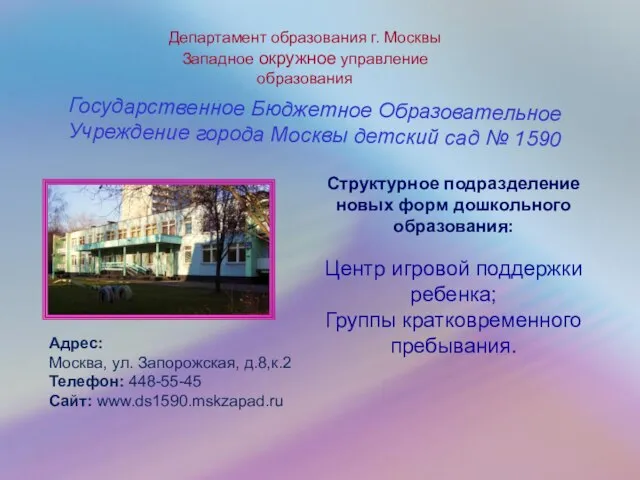 Государственное Бюджетное Образовательное Учреждение города Москвы детский сад № 1590
 Эффективная реклама в соц. медиа
 Влияние компьютерных игр на психику подростков
 Всеобщая история архитектуры Рим
  Чтение слов и предложений с изученными буквами
 ОБЗОР ПРОДУКЦИИ
 Презентация на тему Решение иррациональных уравнений
 Презентация на тему Плоскостопие у детей и взрослых
  Хлебопекарные формы для выпечки хлеба
 Неравенство доходов в обществе
 ROSS 2012 (Russian Open Source Summit) Приветствие к участникам ROSS 2012 от НП РУССОФТ 12 апреля 2012 года, Москва Валентин Макаров Президент Ассоциации.
 Символ года 2021 - бычок. Конкурс поделок
 Плоскость, касательная к поверхности, нормаль поверхности. Лекция 8
 Понятие и виды юридической ответственности
 Презентация на тему Электронная проводимость металлов
 Как скоморох масленицу встречал
 Почерк
 НЕСУЩИЙ ОСТОВ ЗДАНИЯ
 Программы утилиты
 День именинника