- RESEARCH OF NANOPOWDERS PROPERTIES PURE AND DOPED METAL

Содержание
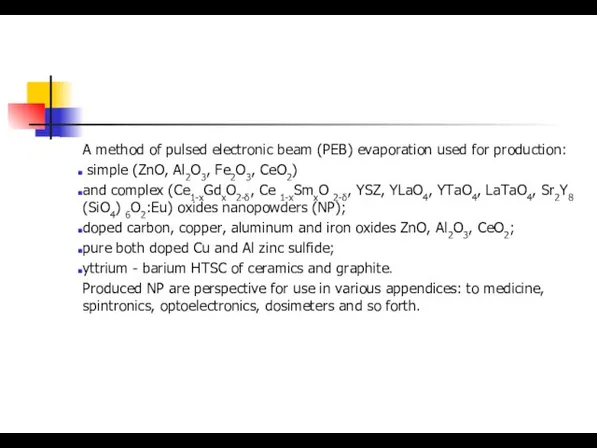
- 2. A method of pulsed electronic beam (PEB) evaporation used for production: simple (ZnO, Al2O3, Fe2O3, CeO2)
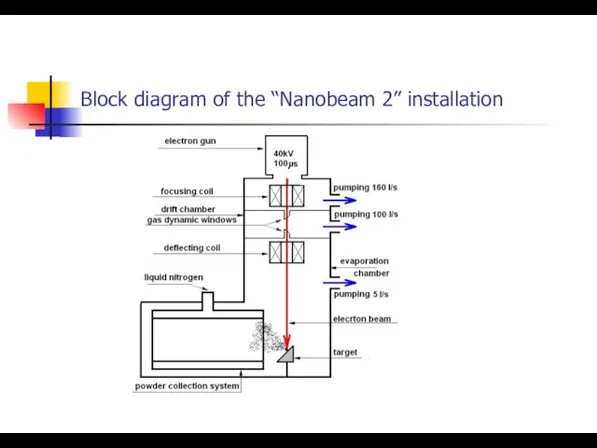
- 3. Block diagram of the “Nanobeam 2” installation
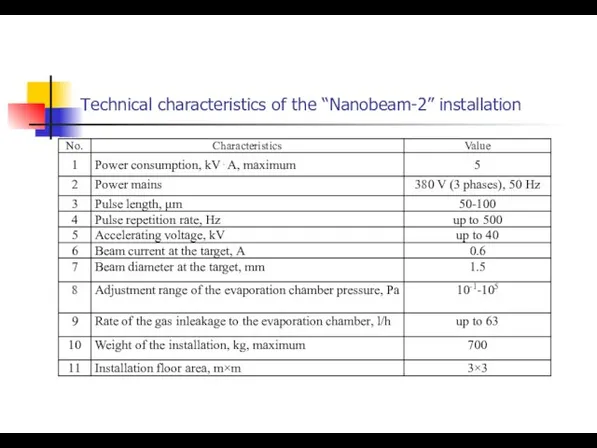
- 4. Technical characteristics of the “Nanobeam-2” installation
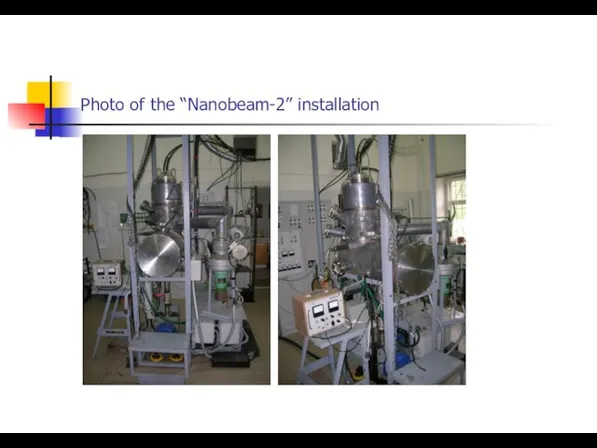
- 5. Photo of the “Nanobeam-2” installation
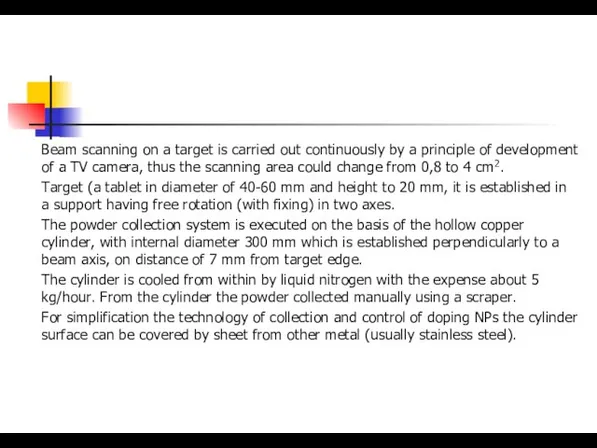
- 6. Beam scanning on a target is carried out continuously by a principle of development of a
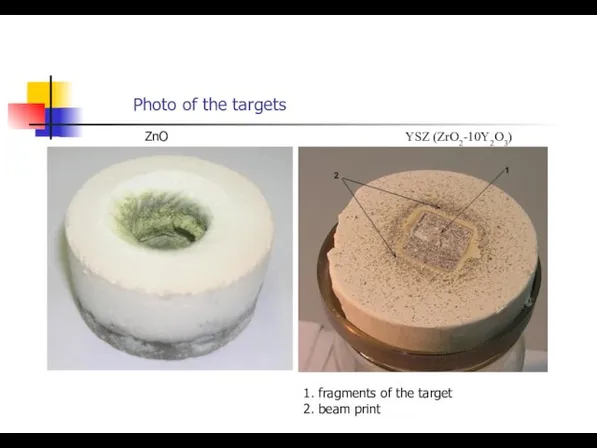
- 7. Photo of the targets ZnO YSZ (ZrO2-10Y2O3) 1. fragments of the target 2. beam print
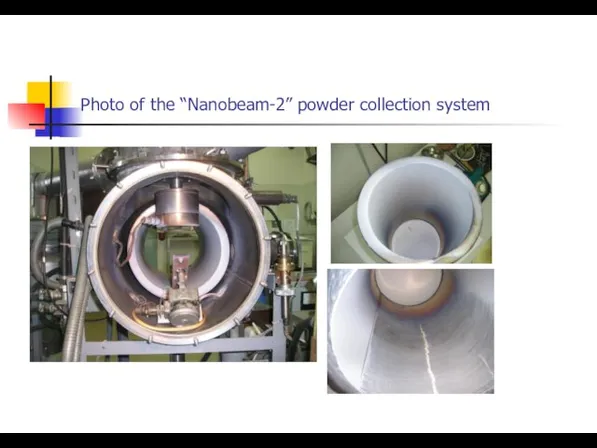
- 8. Photo of the “Nanobeam-2” powder collection system
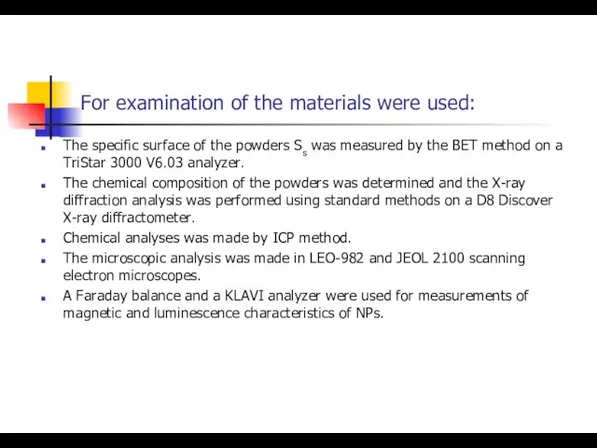
- 9. For examination of the materials were used: The specific surface of the powders Ss was measured
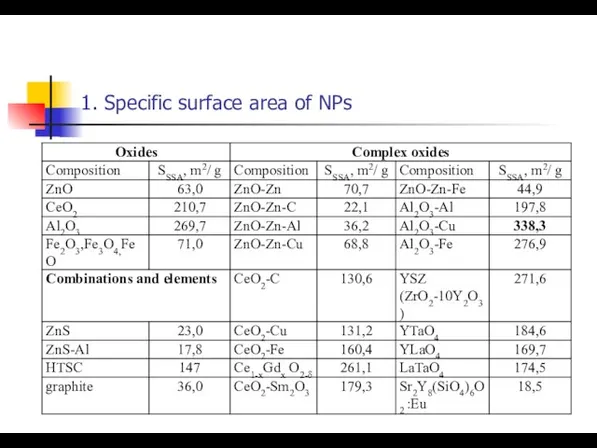
- 10. 1. Specific surface area of NPs
- 11. 2. Features in common of the morphology of the NPs were as follows: 1) coarse shapeless
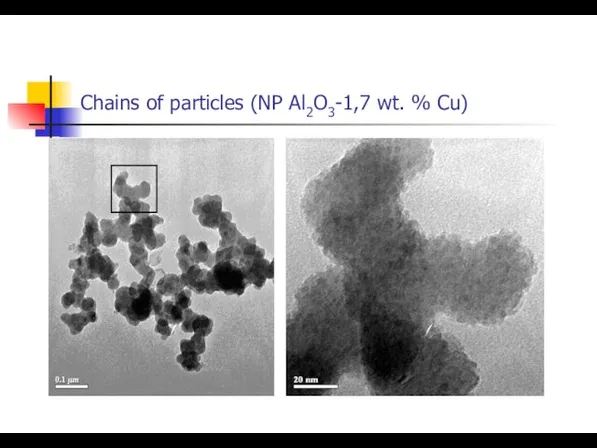
- 12. Chains of particles (NP Al2O3-1,7 wt. % Сu)
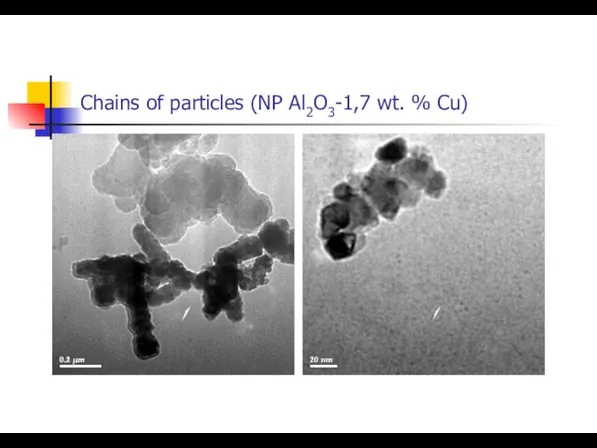
- 13. Chains of particles (NP Al2O3-1,7 wt. % Сu)
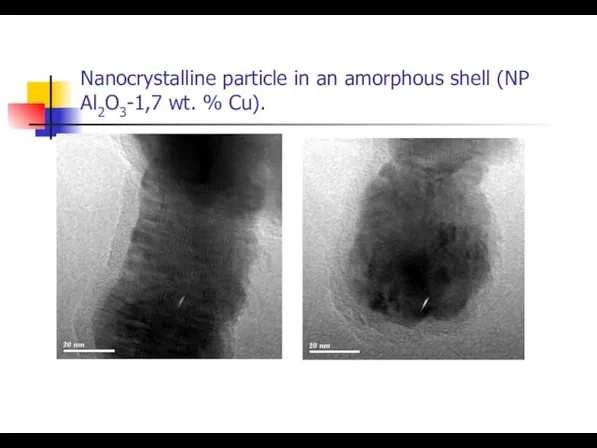
- 14. Nanocrystalline particle in an amorphous shell (NP Al2O3-1,7 wt. % Сu).
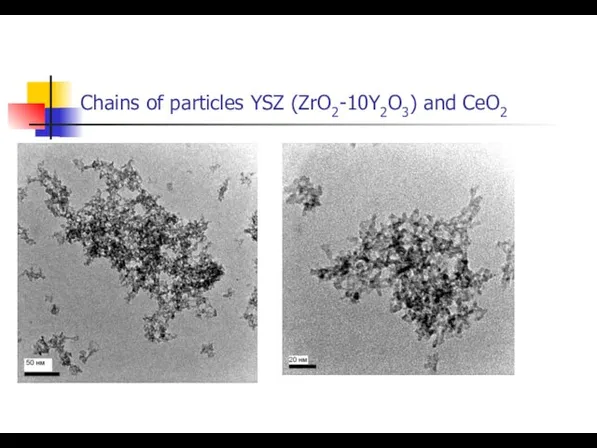
- 15. Chains of particles YSZ (ZrO2-10Y2O3) and CeO2
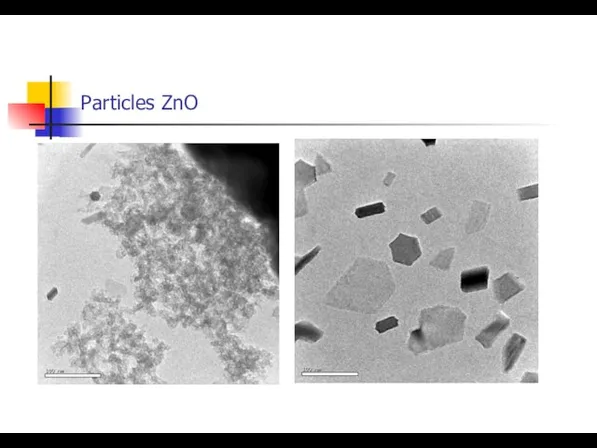
- 16. Particles ZnO
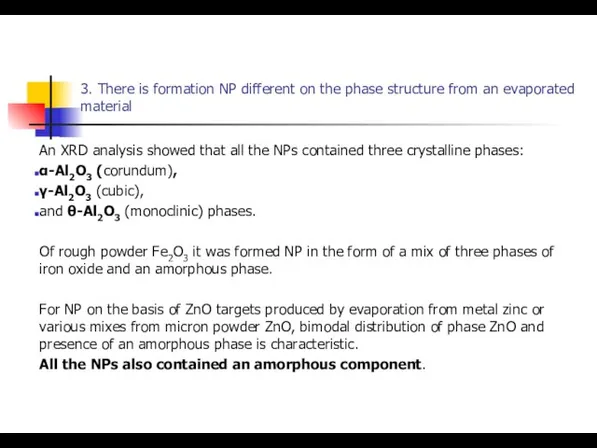
- 17. 3. There is formation NP different on the phase structure from an evaporated material An XRD
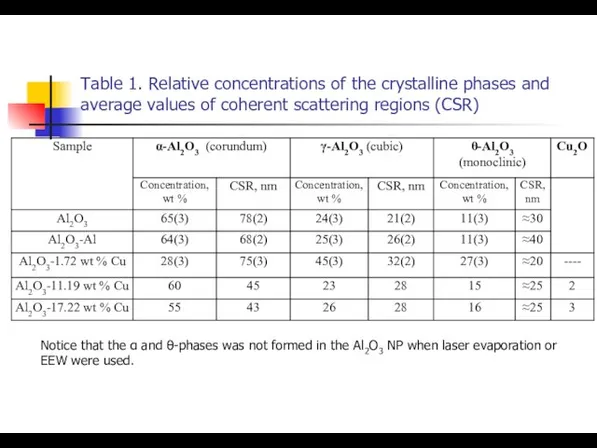
- 18. Table 1. Relative concentrations of the crystalline phases and average values of coherent scattering regions (CSR)
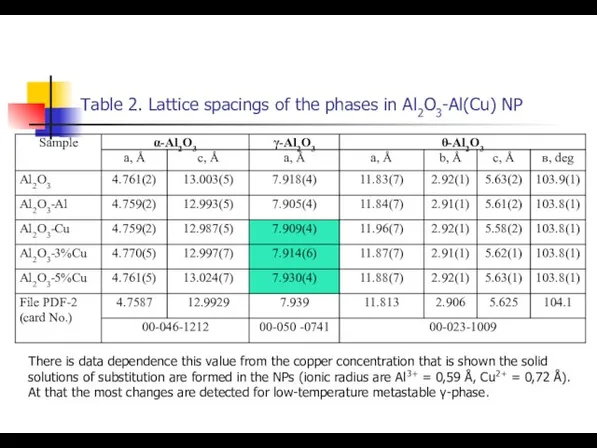
- 19. Table 2. Lattice spacings of the phases in Al2O3-Al(Cu) NP There is data dependence this value
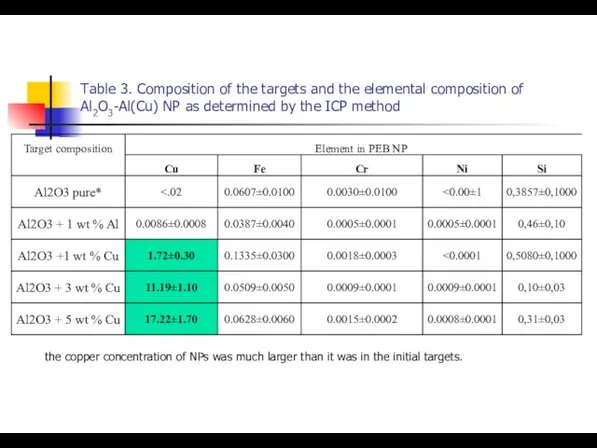
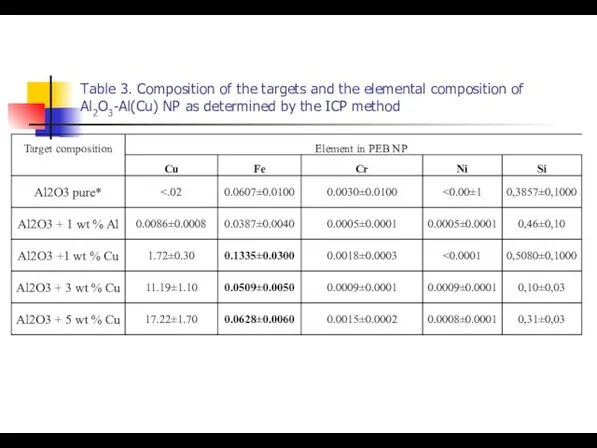
- 20. Table 3. Composition of the targets and the elemental composition of Al2O3-Al(Cu) NP as determined by
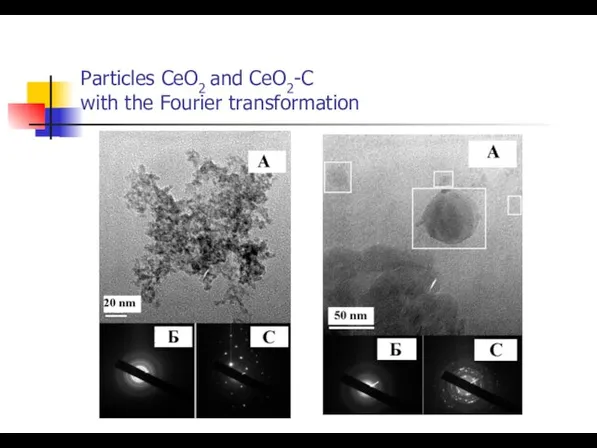
- 21. Particles CeO2 and CeO2-C with the Fourier transformation
- 22. The ferromagnetic properties of Al2O3 nanoparticles (NPTs) were found for the first time in Sunderesan et
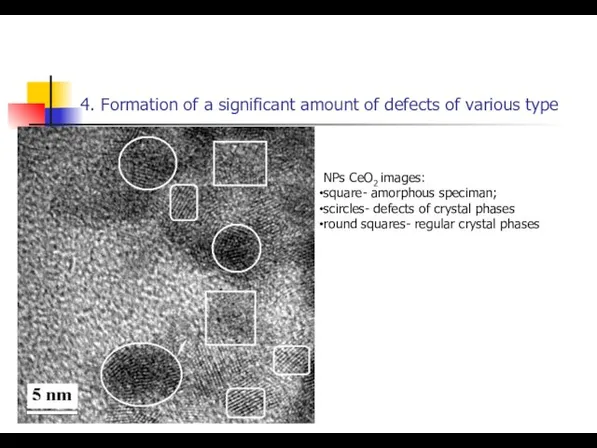
- 23. 4. Formation of a significant amount of defects of various type NPs СeO2 images: square- amorphous
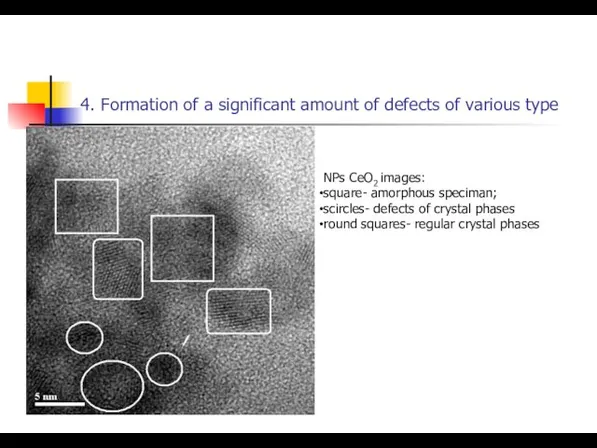
- 24. 4. Formation of a significant amount of defects of various type NPs СeO2 images: square- amorphous
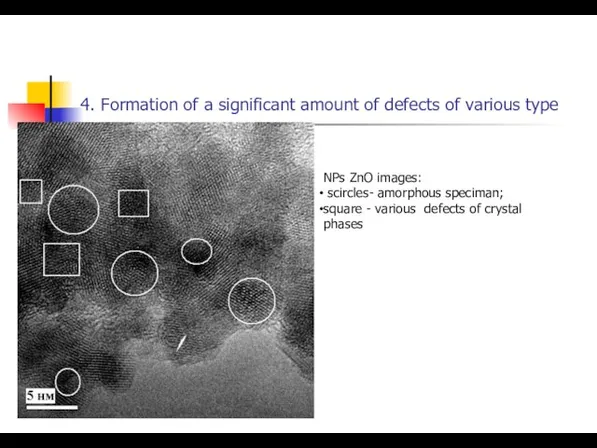
- 25. 4. Formation of a significant amount of defects of various type NPs ZnO images: scircles- amorphous
- 26. The ferromagnetic properties of Al2O3 nanoparticles (NPTs) were found for the first time in Sunderesan et
- 27. The ferromagnetic properties of Al2O3 nanoparticles (NPTs) were found for the first time in Sunderesan et
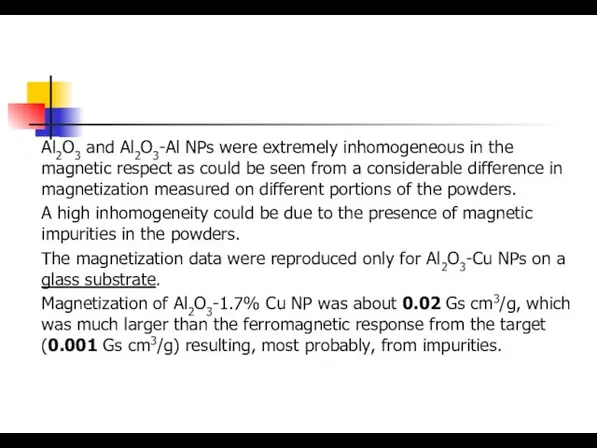
- 28. Al2O3 and Al2O3-Al NPs were extremely inhomogeneous in the magnetic respect as could be seen from
- 29. Generally, magnetization of the Al2O3-Cu powders was higher than that of Al2O3 NPs [Sunderesan et al.
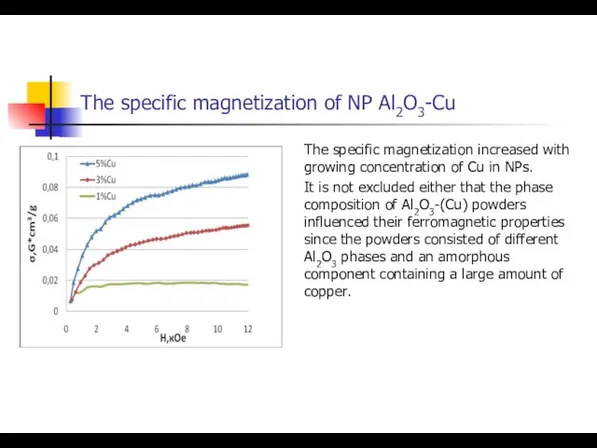
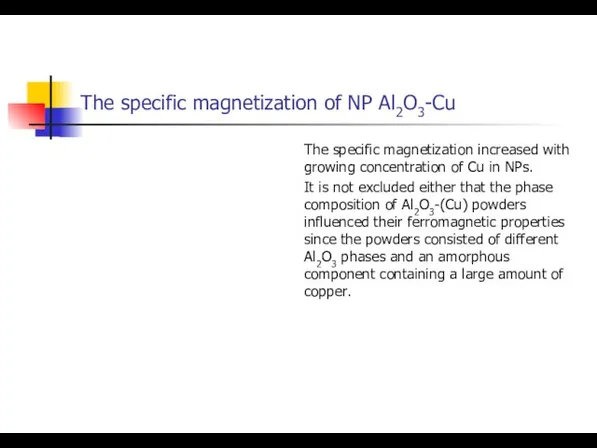
- 30. The specific magnetization of NP Al2O3-Cu The specific magnetization increased with growing concentration of Cu in
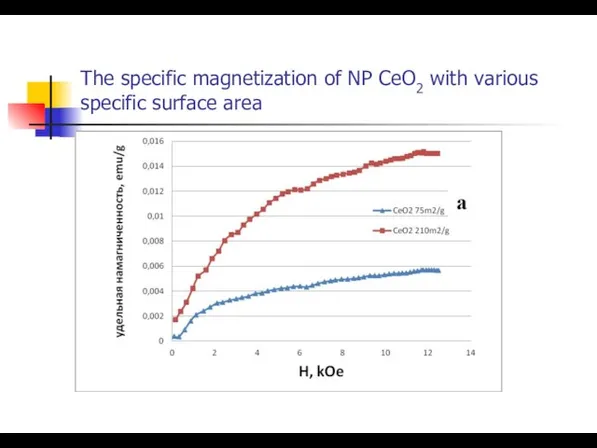
- 31. The specific magnetization of NP CeO2 with various specific surface area
- 32. The specific magnetization of NP Al2O3-Cu The specific magnetization increased with growing concentration of Cu in
- 33. Nonreproducibility of magnetization of pure Al2O3 and Al2O3-Al NPs containing comparable concentrations of iron impurities in
- 34. Table 3. Composition of the targets and the elemental composition of Al2O3-Al(Cu) NP as determined by
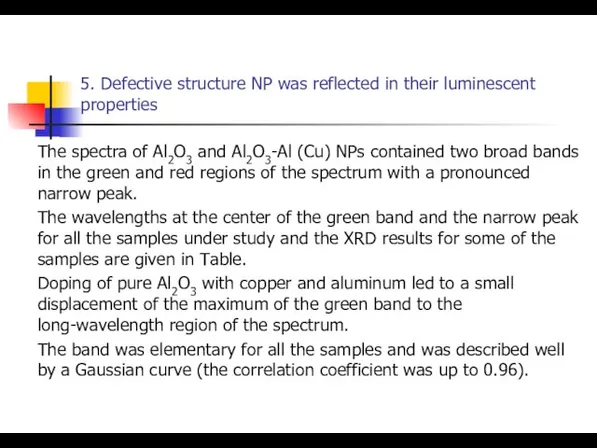
- 35. 5. Defective structure NP was reflected in their luminescent properties The spectra of Al2O3 and Al2O3-Al
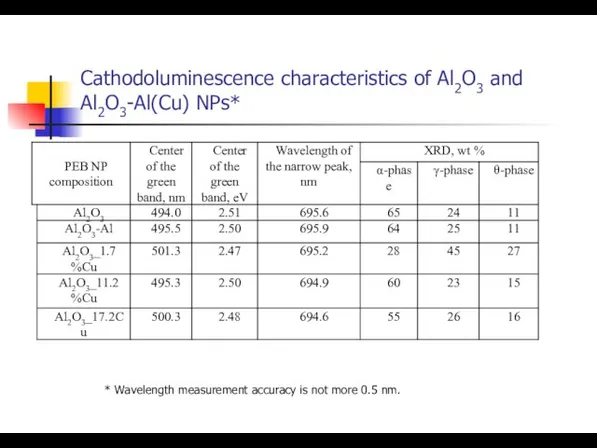
- 36. Cathodoluminescence characteristics of Al2O3 and Al2O3-Al(Cu) NPs* * Wavelength measurement accuracy is not more 0.5 nm.
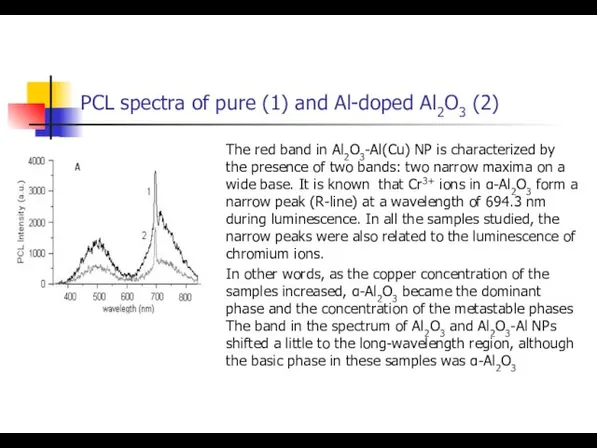
- 37. PCL spectra of pure (1) and Al-doped Al2O3 (2) The red band in Al2O3-Al(Cu) NP is
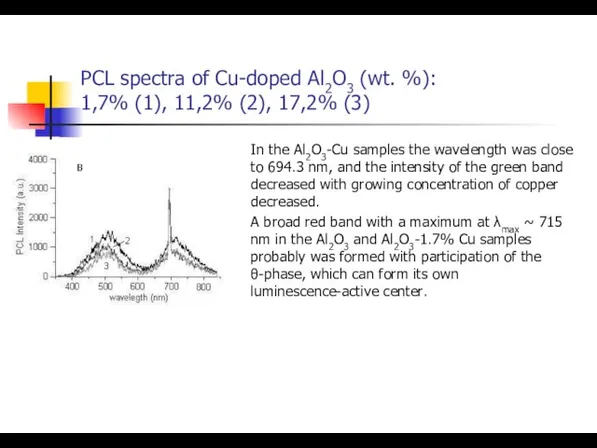
- 38. PCL spectra of Cu-doped Al2O3 (wt. %): 1,7% (1), 11,2% (2), 17,2% (3) In the Al2O3-Cu
- 39. PCL spectra of Cu-doped Al2O3 (wt. %): 1,7% (1), 11,2% (2), 17,2% (3) In the Al2O3-Cu
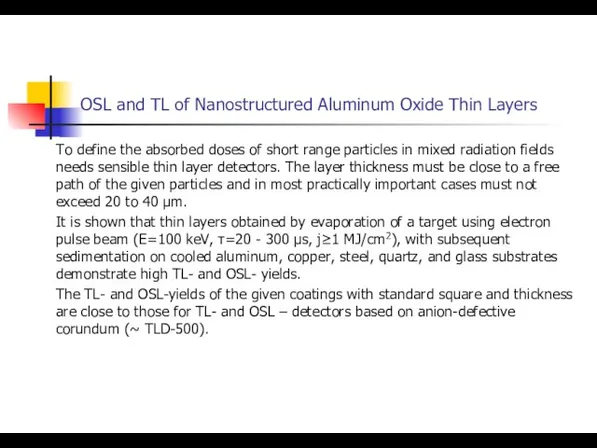
- 40. OSL and TL of Nanostructured Aluminum Oxide Thin Layers To define the absorbed doses of short
- 41. OSL and TL of Nanostructured Aluminum Oxide Thin Layers The TL glow curve shows an unusually
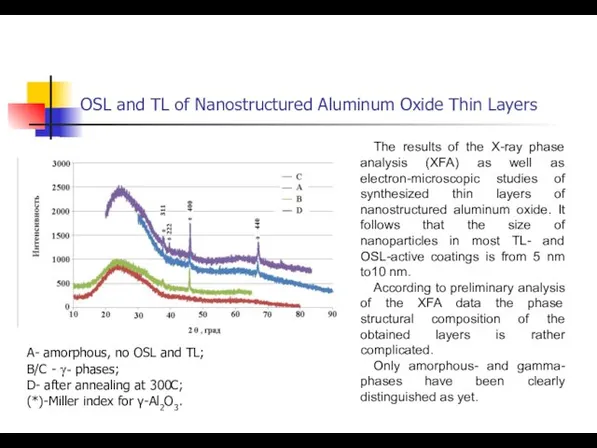
- 42. OSL and TL of Nanostructured Aluminum Oxide Thin Layers The results of the X-ray phase analysis
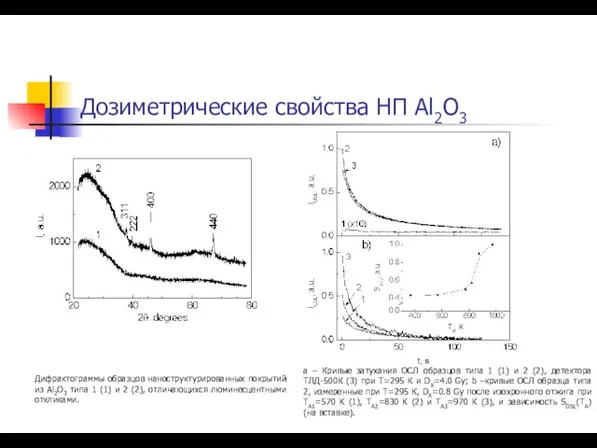
- 43. Дозиметрические свойства НП Al2O3 Дифрактограммы образцов наноструктурированных покрытий из Al2O3 типа 1 (1) и 2 (2),
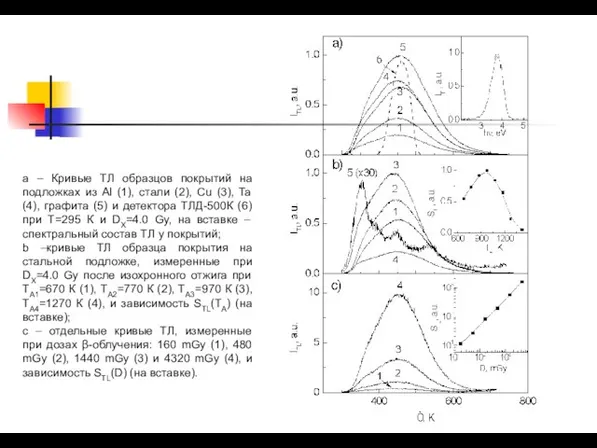
- 44. a – Кривые ТЛ образцов покрытий на подложках из Al (1), стали (2), Сu (3), Ta
- 45. Conclusions The conducted researches have shown that by means of PEB evaporation it is possible to
- 47. Скачать презентацию
Слайд 3Block diagram of the “Nanobeam 2” installation
Block diagram of the “Nanobeam 2” installation
Слайд 4Technical characteristics of the “Nanobeam-2” installation
Technical characteristics of the “Nanobeam-2” installation
Слайд 5Photo of the “Nanobeam-2” installation
Photo of the “Nanobeam-2” installation
Слайд 6Beam scanning on a target is carried out continuously by a principle
Beam scanning on a target is carried out continuously by a principle
Слайд 7Photo of the targets
ZnO
YSZ (ZrO2-10Y2O3)
1. fragments of the target
2. beam
Photo of the targets
ZnO
YSZ (ZrO2-10Y2O3)
1. fragments of the target
2. beam
Слайд 8Photo of the “Nanobeam-2” powder collection system
Photo of the “Nanobeam-2” powder collection system
Слайд 9For examination of the materials were used:
The specific surface of the
For examination of the materials were used:
The specific surface of the
Слайд 101. Specific surface area of NPs
1. Specific surface area of NPs
Слайд 112. Features in common of the morphology of the NPs were as
2. Features in common of the morphology of the NPs were as
Слайд 12Chains of particles (NP Al2O3-1,7 wt. % Сu)
Chains of particles (NP Al2O3-1,7 wt. % Сu)
Слайд 13Chains of particles (NP Al2O3-1,7 wt. % Сu)
Chains of particles (NP Al2O3-1,7 wt. % Сu)
Слайд 14Nanocrystalline particle in an amorphous shell (NP Al2O3-1,7 wt. % Сu).
Nanocrystalline particle in an amorphous shell (NP Al2O3-1,7 wt. % Сu).
Слайд 15Chains of particles YSZ (ZrO2-10Y2O3) and CeO2
Chains of particles YSZ (ZrO2-10Y2O3) and CeO2
Слайд 16Particles ZnO
Particles ZnO
Слайд 173. There is formation NP different on the phase structure from an
3. There is formation NP different on the phase structure from an
Слайд 18Table 1. Relative concentrations of the crystalline phases and average values of
Table 1. Relative concentrations of the crystalline phases and average values of
Слайд 19Table 2. Lattice spacings of the phases in Al2O3-Al(Cu) NP
There is data
Table 2. Lattice spacings of the phases in Al2O3-Al(Cu) NP
There is data
Слайд 20Table 3. Composition of the targets and the elemental composition of Al2O3-Al(Cu)
Table 3. Composition of the targets and the elemental composition of Al2O3-Al(Cu)
Слайд 21Particles CeO2 and CeO2-C
with the Fourier transformation
Particles CeO2 and CeO2-C
with the Fourier transformation
Слайд 22The ferromagnetic properties of Al2O3 nanoparticles (NPTs) were found for the first
The ferromagnetic properties of Al2O3 nanoparticles (NPTs) were found for the first

Слайд 234. Formation of a significant amount of defects of various type
NPs
4. Formation of a significant amount of defects of various type
NPs
Слайд 244. Formation of a significant amount of defects of various type
NPs
4. Formation of a significant amount of defects of various type
NPs
Слайд 254. Formation of a significant amount of defects of various type
NPs
4. Formation of a significant amount of defects of various type
NPs
Слайд 26The ferromagnetic properties of Al2O3 nanoparticles (NPTs) were found for the first
The ferromagnetic properties of Al2O3 nanoparticles (NPTs) were found for the first

Слайд 27The ferromagnetic properties of Al2O3 nanoparticles (NPTs) were found for the first
The ferromagnetic properties of Al2O3 nanoparticles (NPTs) were found for the first
Слайд 28Al2O3 and Al2O3-Al NPs were extremely inhomogeneous in the magnetic respect as
Al2O3 and Al2O3-Al NPs were extremely inhomogeneous in the magnetic respect as
Слайд 29Generally, magnetization of the Al2O3-Cu powders was higher than that of Al2O3
Generally, magnetization of the Al2O3-Cu powders was higher than that of Al2O3
Слайд 30The specific magnetization of NP Al2O3-Cu
The specific magnetization increased with growing concentration
The specific magnetization of NP Al2O3-Cu
The specific magnetization increased with growing concentration
Слайд 31The specific magnetization of NP CeO2 with various specific surface area
The specific magnetization of NP CeO2 with various specific surface area
Слайд 32The specific magnetization of NP Al2O3-Cu
The specific magnetization increased with growing concentration
The specific magnetization of NP Al2O3-Cu
The specific magnetization increased with growing concentration
Слайд 33Nonreproducibility of magnetization of pure Al2O3 and Al2O3-Al NPs containing comparable concentrations
Nonreproducibility of magnetization of pure Al2O3 and Al2O3-Al NPs containing comparable concentrations
Слайд 34Table 3. Composition of the targets and the elemental composition of Al2O3-Al(Cu)
Table 3. Composition of the targets and the elemental composition of Al2O3-Al(Cu)
Слайд 355. Defective structure NP was reflected in their luminescent properties
The spectra of
5. Defective structure NP was reflected in their luminescent properties
The spectra of
Слайд 36Cathodoluminescence characteristics of Al2O3 and Al2O3-Al(Cu) NPs*
* Wavelength measurement accuracy is not
Cathodoluminescence characteristics of Al2O3 and Al2O3-Al(Cu) NPs*
* Wavelength measurement accuracy is not
Слайд 37PCL spectra of pure (1) and Al-doped Al2O3 (2)
The red band in
PCL spectra of pure (1) and Al-doped Al2O3 (2)
The red band in
Слайд 38PCL spectra of Cu-doped Al2O3 (wt. %):
1,7% (1), 11,2% (2), 17,2% (3)
In
PCL spectra of Cu-doped Al2O3 (wt. %):
1,7% (1), 11,2% (2), 17,2% (3)
In
Слайд 39PCL spectra of Cu-doped Al2O3 (wt. %):
1,7% (1), 11,2% (2), 17,2% (3)
In
PCL spectra of Cu-doped Al2O3 (wt. %):
1,7% (1), 11,2% (2), 17,2% (3)
In

Слайд 40OSL and TL of Nanostructured Aluminum Oxide Thin Layers
To define the absorbed
OSL and TL of Nanostructured Aluminum Oxide Thin Layers
To define the absorbed
Слайд 41OSL and TL of Nanostructured Aluminum Oxide Thin Layers
The TL glow curve
OSL and TL of Nanostructured Aluminum Oxide Thin Layers
The TL glow curve
Слайд 42OSL and TL of Nanostructured Aluminum Oxide Thin Layers
The results of the
OSL and TL of Nanostructured Aluminum Oxide Thin Layers
The results of the
Слайд 43Дозиметрические свойства НП Al2O3
Дифрактограммы образцов наноструктурированных покрытий из Al2O3 типа 1 (1)
Дозиметрические свойства НП Al2O3
Дифрактограммы образцов наноструктурированных покрытий из Al2O3 типа 1 (1)
Слайд 44a – Кривые ТЛ образцов покрытий на подложках из Al (1), стали
a – Кривые ТЛ образцов покрытий на подложках из Al (1), стали
Слайд 45Conclusions
The conducted researches have shown that by means of PEB evaporation it
Conclusions
The conducted researches have shown that by means of PEB evaporation it
 Формирование умения решать уравнения в начальной школе
 Программы кредитования субъектов малого и среднего бизнеса
 Что такое дружба
 Весна море 3-бклассx
 Развитие школьной библиотеки
 Джедайское искуство боя
 Предложения по формированию корпоративной культуры Департамента культуры и архивного дела Ульяновской области
 Отдел Мохообразные. Общая характеристика
 Изобразительно- выразительные средства языка Сравнение урок литературы, 5 класс
 Плавный пуск электродвигателей
 Реализм во Франции
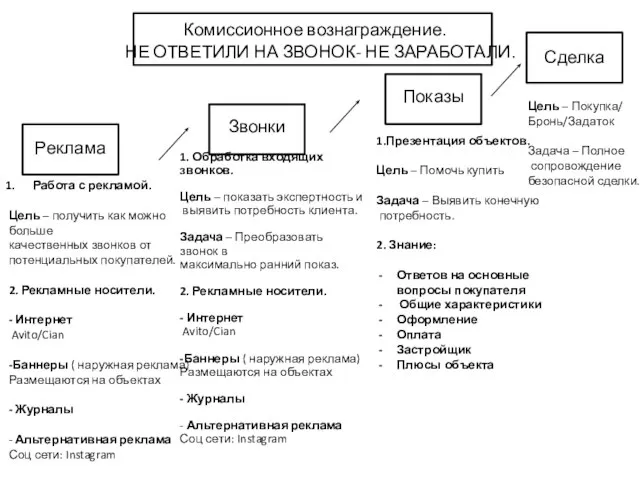 Комиссионное вознаграждение
 Мотивация
 Мастер группа Хранители снов
 Восстание декабристов (8 класс)
 «Мир начинается с тебя»рабочая программакурса внеурочной деятельностидля учащихся 1-4 классов
 Верста значение
 Органическое управление(методология эффективной управленческойдеятельности в информационном обществе)
 Правила работы в группе: 1. Уважение к говорящему, 1. Уважение к говорящему, не перебивать говорящего, не шуметь, когда кто-то говорит;
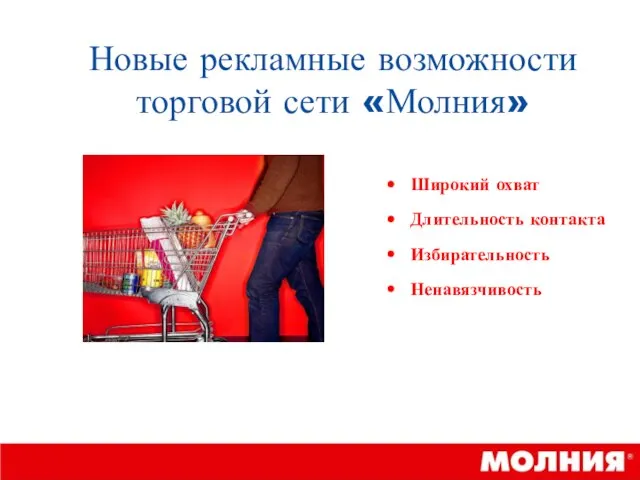 Новые рекламные возможности торговой сети «Молния»
 Финансовые результаты деятельности предприятия ОАО Лазмурь
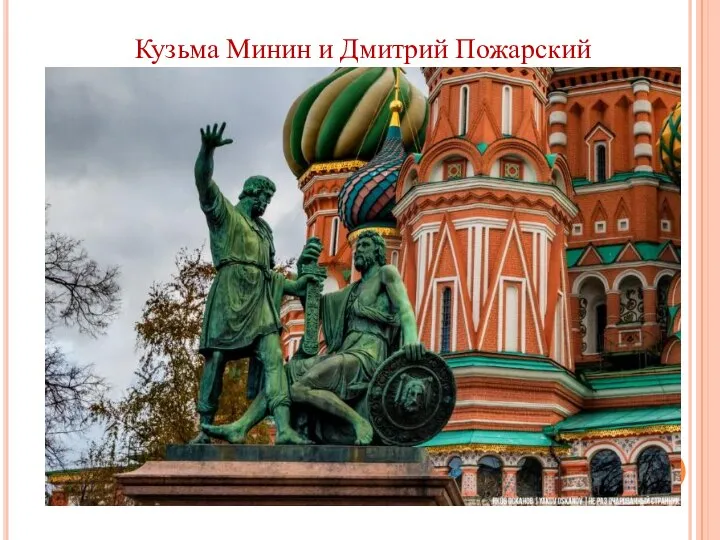 Кузьма Минин и Дмитрий Пожарский
 Кафе “Унесенные кошками”
 Теорема Пифагора
 Основы теории мотивации
  Торговля на новостях. Фундаментальный анализ
 Трудовые организации. Системы и формы оплаты труда. Тема 3
 ЛЕКЦИЯ № 7