- Independent and parallel visual processing of ensemble statistics: Evidence from dual tasks

Содержание
- 2. Independent and parallel visual processing of ensemble statistics: Evidence from dual tasks Vladislav Khvostov and Igor
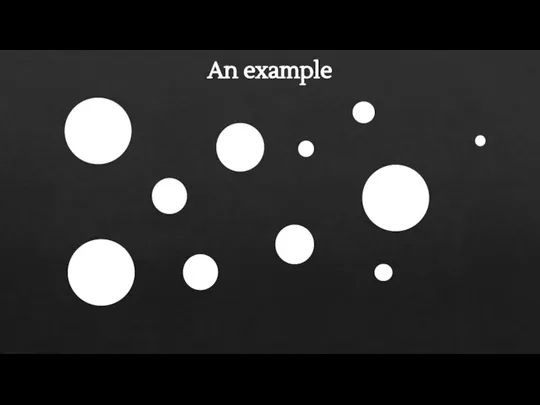
- 3. An example
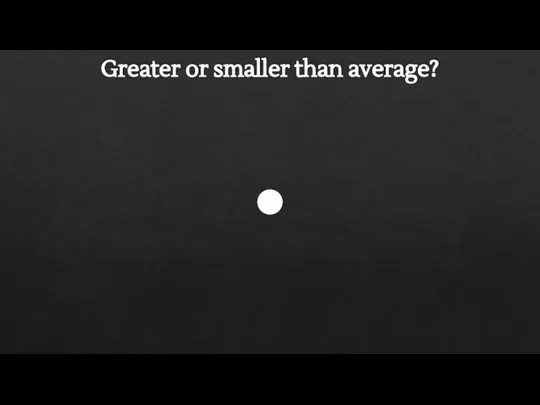
- 4. Greater or smaller than average?
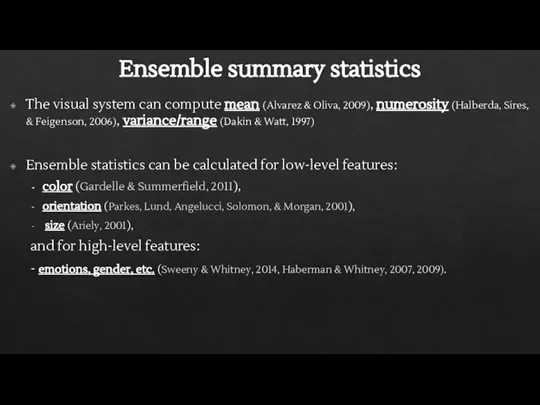
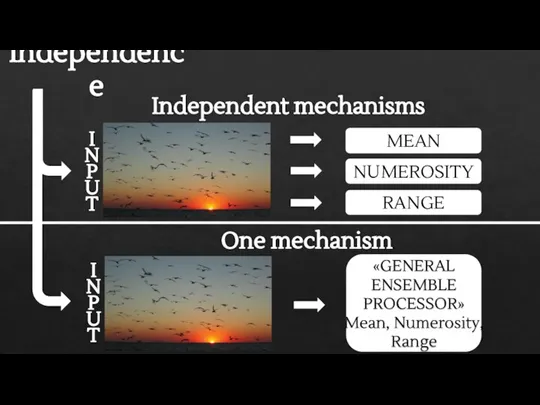
- 5. Ensemble summary statistics The visual system can compute mean (Alvarez & Oliva, 2009), numerosity (Halberda, Sires,
- 6. Independence
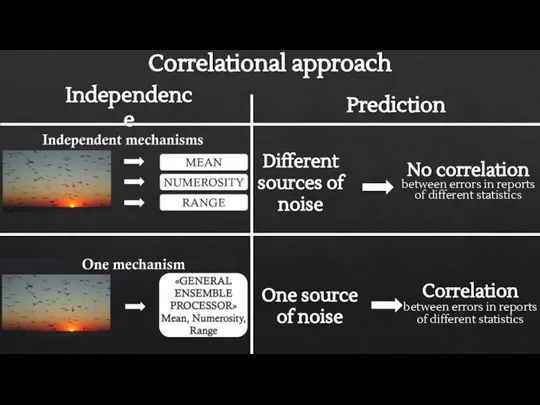
- 7. Correlational approach Prediction Independence
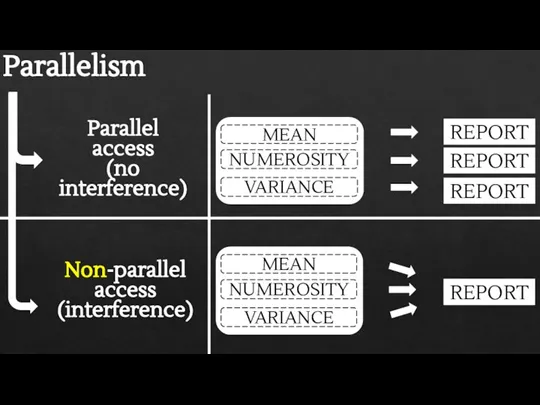
- 8. Parallelism Non-parallel access (interference)
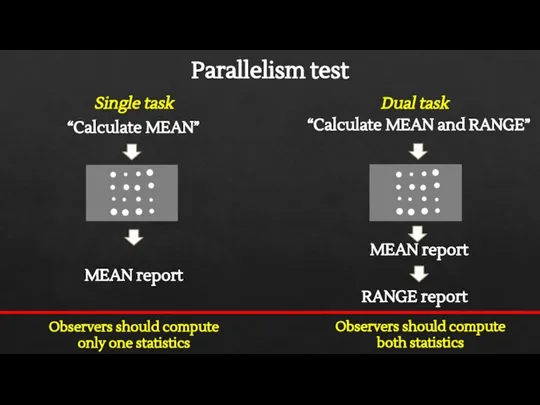
- 9. Parallelism test Single task “Calculate MEAN” MEAN report Dual task Observers should compute only one statistics
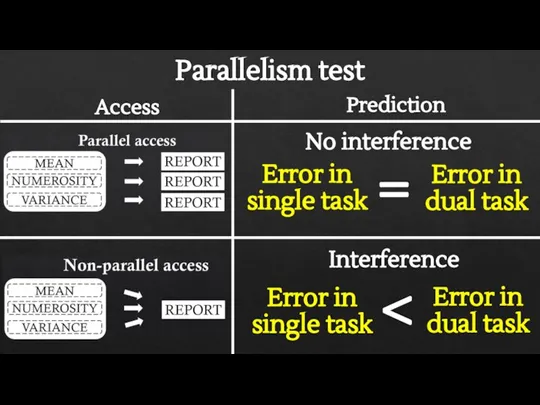
- 10. Parallelism test Prediction Access
- 11. Experiment 1 Whether mean and numerosity can be calculated independently and in parallel? N=23
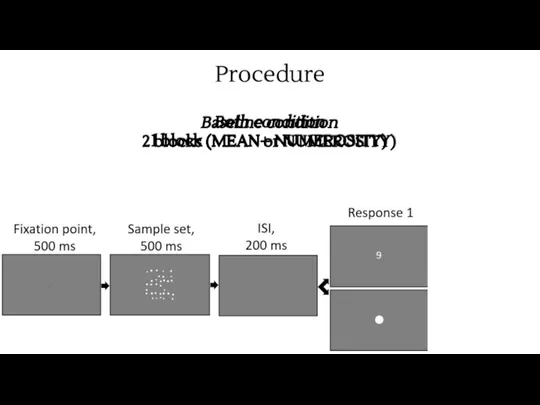
- 12. Procedure Baseline condition 2 blocks (MEAN or NUMEROSITY) Both condition 1 block (MEAN+ NUMEROSITY)
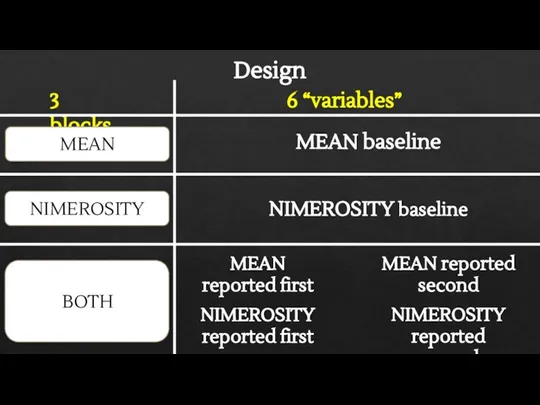
- 13. Design MEAN baseline 3 blocks MEAN NIMEROSITY BOTH 6 “variables” NIMEROSITY baseline MEAN reported first NIMEROSITY
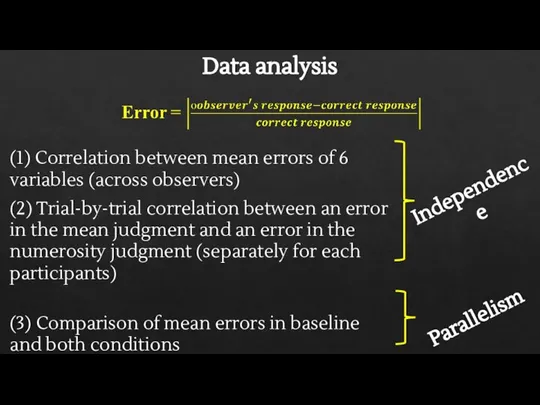
- 14. Data analysis (1) Correlation between mean errors of 6 variables (across observers) (2) Trial-by-trial correlation between
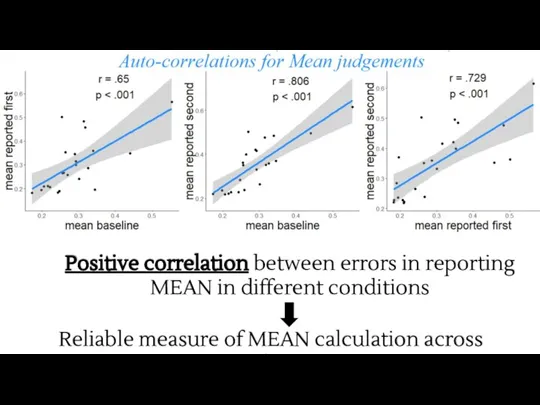
- 15. Positive correlation between errors in reporting MEAN in different conditions Reliable measure of MEAN calculation across
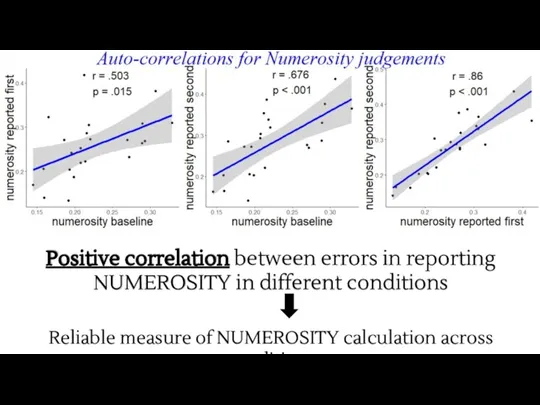
- 16. Positive correlation between errors in reporting NUMEROSITY in different conditions Reliable measure of NUMEROSITY calculation across
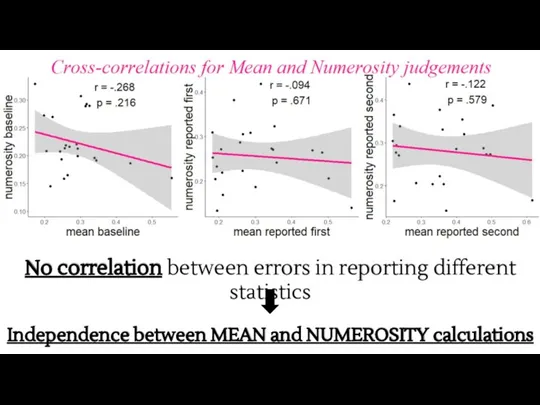
- 17. No correlation between errors in reporting different statistics Independence between MEAN and NUMEROSITY calculations
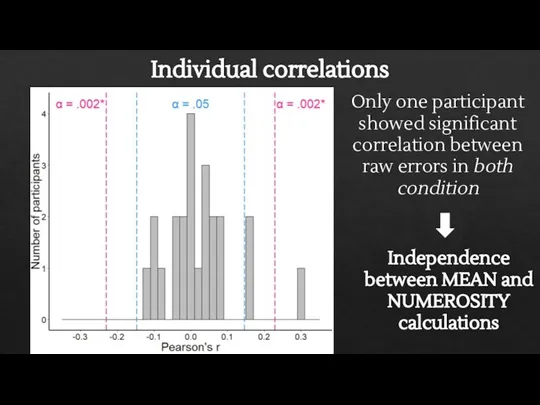
- 18. Individual correlations Only one participant showed significant correlation between raw errors in both condition Independence between
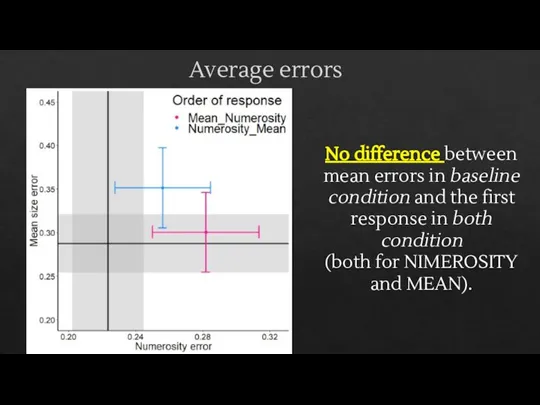
- 19. Average errors No difference between mean errors in baseline condition and the first response in both
- 20. Conclusion Mean and numerosity are calculated independently and in parallel
- 21. Experiment 2 Whether mean and range can be calculated independently and in parallel? N=20
- 22. Procedure Baseline condition 2 blocks (MEAN or RANGE) Both condition 1 block (MEAN+ RANGE)
- 23. Design MEAN baseline 3 blocks MEAN RANGE BOTH 6 “variables” RANGE baseline MEAN reported first RANGE
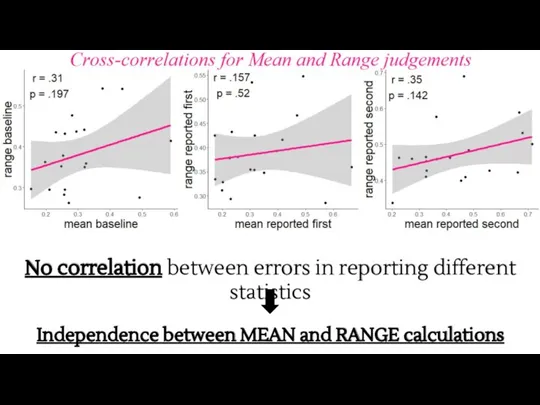
- 24. Positive correlation between errors in reporting MEAN in different conditions Reliable measure of MEAN calculation across
- 25. Positive correlation between errors in reporting RANGE in different conditions Reliable measure of RANGE calculation across
- 26. No correlation between errors in reporting different statistics Independence between MEAN and RANGE calculations
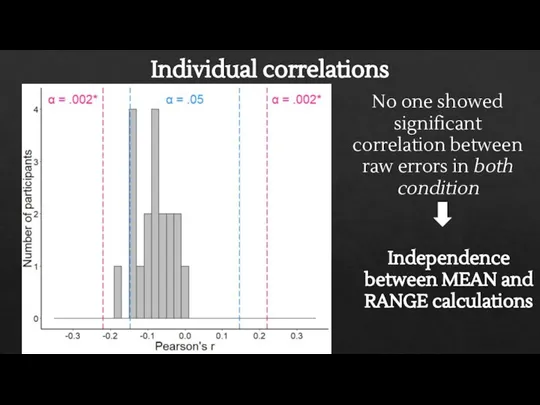
- 27. Individual correlations No one showed significant correlation between raw errors in both condition Independence between MEAN
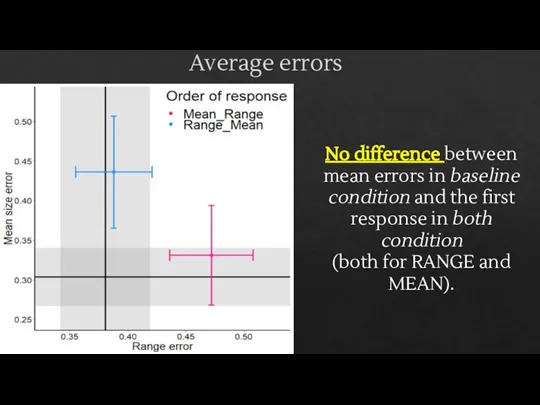
- 28. Average errors No difference between mean errors in baseline condition and the first response in both
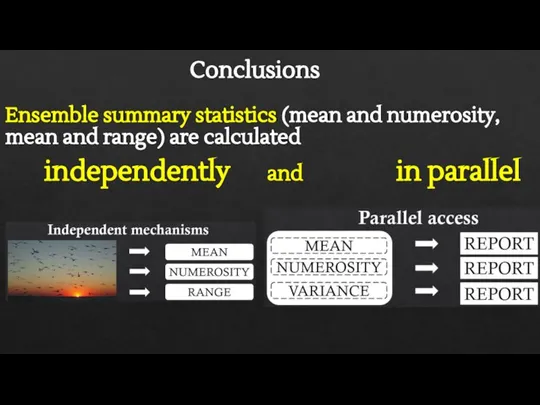
- 29. Conclusions Ensemble summary statistics (mean and numerosity, mean and range) are calculated independently and in parallel
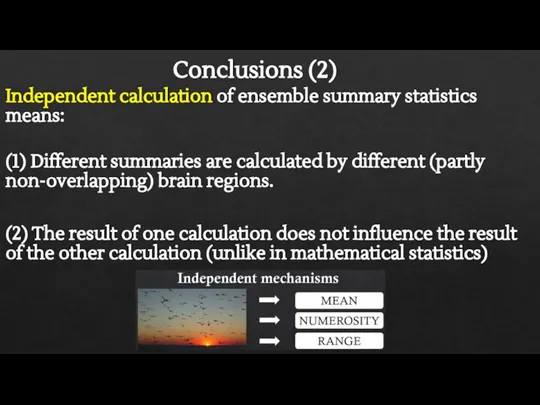
- 30. Conclusions (2) Independent calculation of ensemble summary statistics means: (1) Different summaries are calculated by different
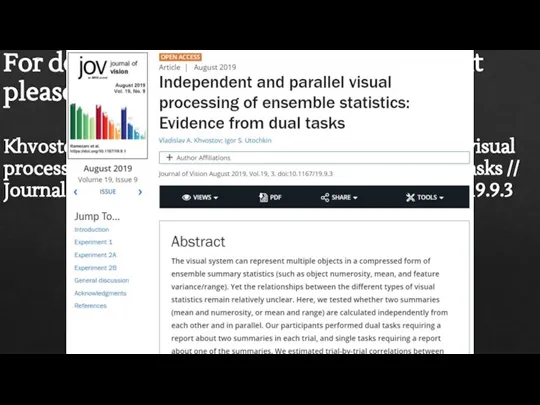
- 31. For details and even one more experiment please read: Khvostov V.A., Utochkin I. S. Independent and
- 32. Thank you for being with me till the end of the first part
- 33. Confidence intervals in within-subject designs *Based on Cousineau, 2005 Part #2
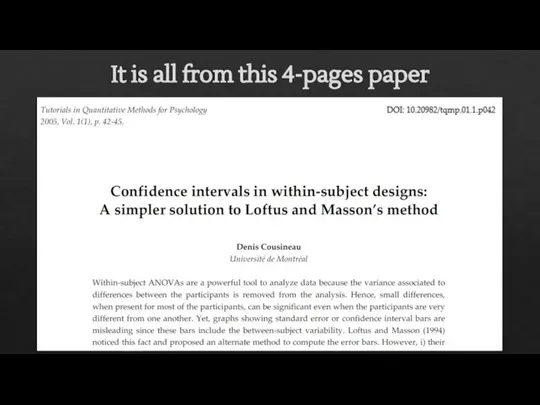
- 34. It is all from this 4-pages paper
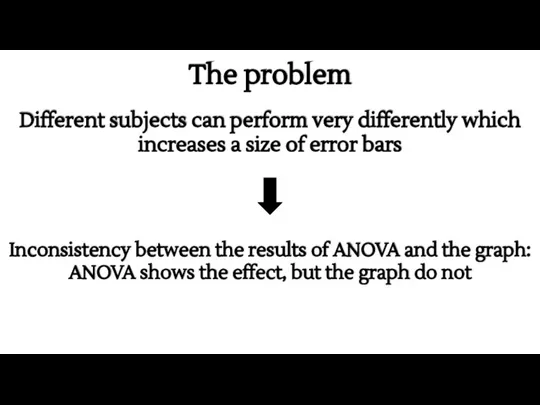
- 35. The problem Different subjects can perform very differently which increases a size of error bars Inconsistency
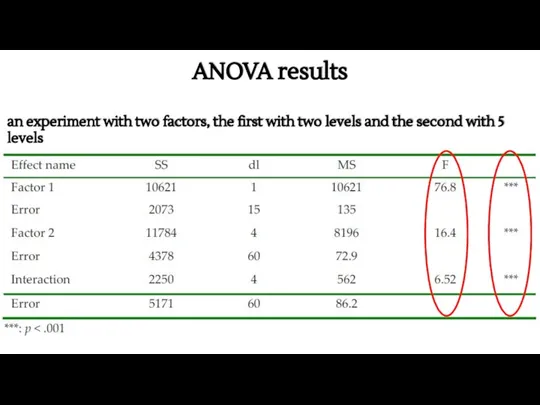
- 36. ANOVA results an experiment with two factors, the first with two levels and the second with
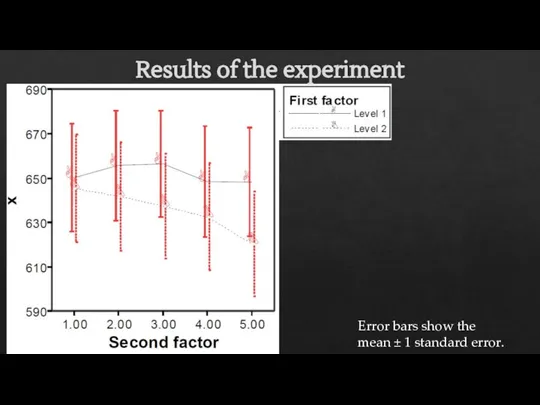
- 37. Results of the experiment Error bars show the mean ± 1 standard error.
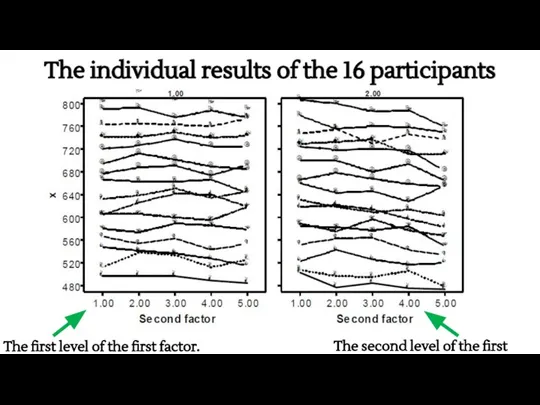
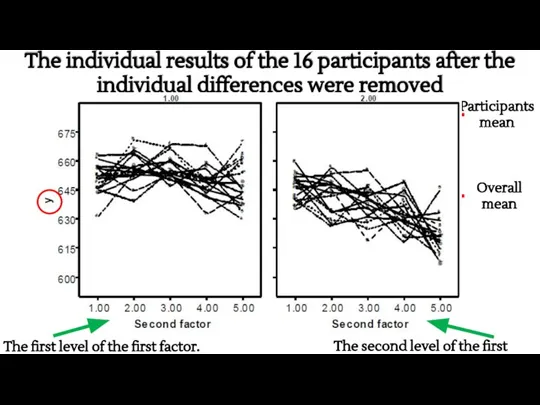
- 38. The individual results of the 16 participants The first level of the first factor. The second
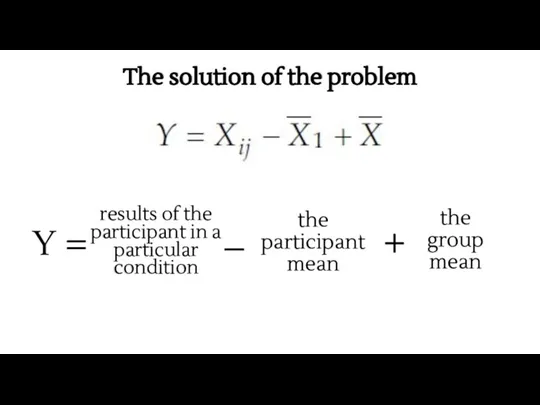
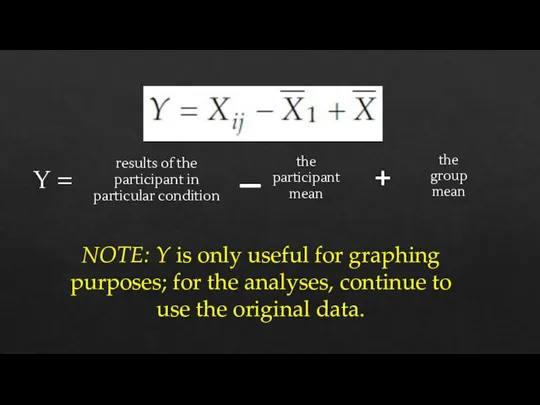
- 39. The solution of the problem the participant mean Y = _ + the group mean results
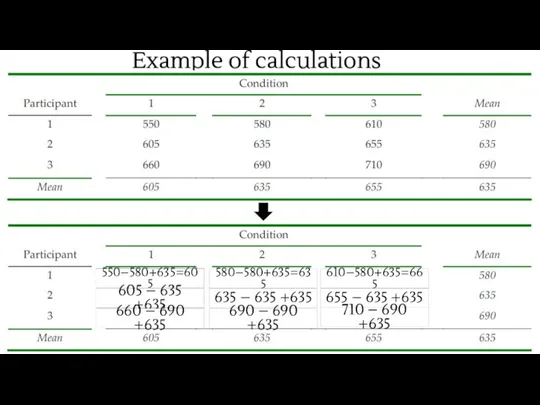
- 40. Example of calculations 550–580+635=605 580–580+635=635 610–580+635=665 605 – 635 +635 635 – 635 +635 655 –
- 41. The individual results of the 16 participants after the individual differences were removed The first level
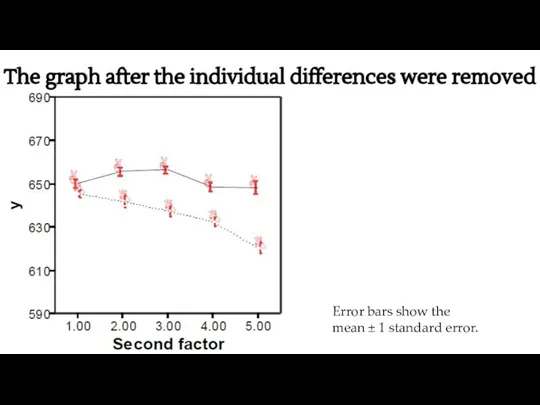
- 42. The graph after the individual differences were removed Error bars show the mean ± 1 standard
- 43. NOTE: Y is only useful for graphing purposes; for the analyses, continue to use the original
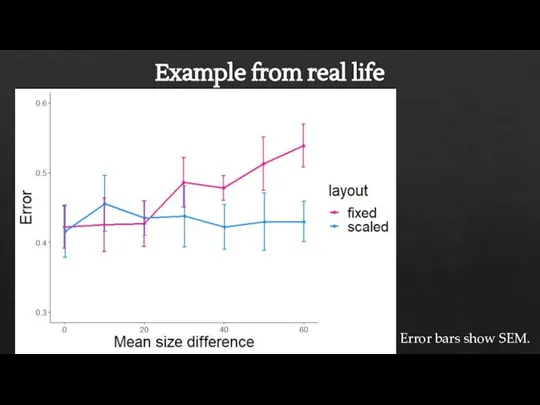
- 44. Example from real life Error bars show SEM.
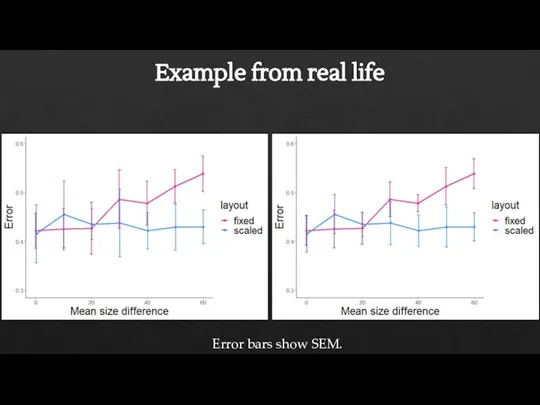
- 45. Example from real life Error bars show SEM.
- 47. Скачать презентацию
Слайд 2Independent and parallel visual processing of ensemble
statistics: Evidence from dual tasks
Vladislav Khvostov
and
Independent and parallel visual processing of ensemble
statistics: Evidence from dual tasks
Vladislav Khvostov
and
Слайд 3An example
An example
Слайд 4Greater or smaller than average?
Greater or smaller than average?
Слайд 5Ensemble summary statistics
The visual system can compute mean (Alvarez & Oliva, 2009),
Ensemble summary statistics
The visual system can compute mean (Alvarez & Oliva, 2009),
Слайд 6Independence
Independence
Слайд 7Correlational approach
Prediction
Independence
Correlational approach
Prediction
Independence
Слайд 8Parallelism
Non-parallel access
(interference)
Parallelism
Non-parallel access
(interference)
Слайд 9Parallelism test
Single task
“Calculate MEAN”
MEAN report
Dual task
Observers should compute only one statistics
“Calculate
Parallelism test
Single task
“Calculate MEAN”
MEAN report
Dual task
Observers should compute only one statistics
“Calculate
Слайд 10Parallelism test
Prediction
Access
Parallelism test
Prediction
Access
Слайд 11Experiment 1
Whether mean and numerosity can be calculated independently and in parallel?
N=23
Experiment 1
Whether mean and numerosity can be calculated independently and in parallel?
N=23
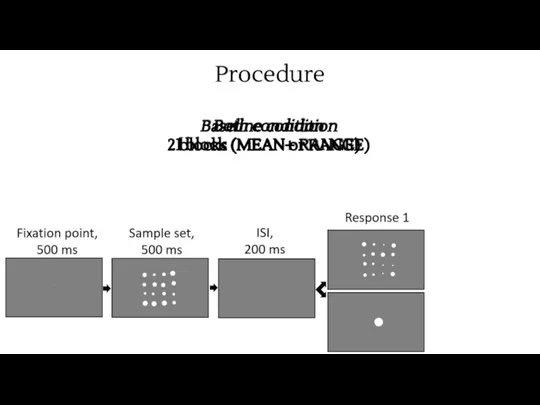
Слайд 12Procedure
Baseline condition
2 blocks (MEAN or NUMEROSITY)
Both condition
1 block (MEAN+ NUMEROSITY)
Procedure
Baseline condition
2 blocks (MEAN or NUMEROSITY)
Both condition
1 block (MEAN+ NUMEROSITY)
Слайд 13Design
MEAN baseline
3 blocks
MEAN
NIMEROSITY
BOTH
6 “variables”
NIMEROSITY baseline
MEAN reported first
NIMEROSITY reported first
NIMEROSITY reported second
MEAN reported
Design
MEAN baseline
3 blocks
MEAN
NIMEROSITY
BOTH
6 “variables”
NIMEROSITY baseline
MEAN reported first
NIMEROSITY reported first
NIMEROSITY reported second
MEAN reported
Слайд 14Data analysis
(1) Correlation between mean errors of 6 variables (across observers)
(2) Trial-by-trial
Data analysis
(1) Correlation between mean errors of 6 variables (across observers)
(2) Trial-by-trial
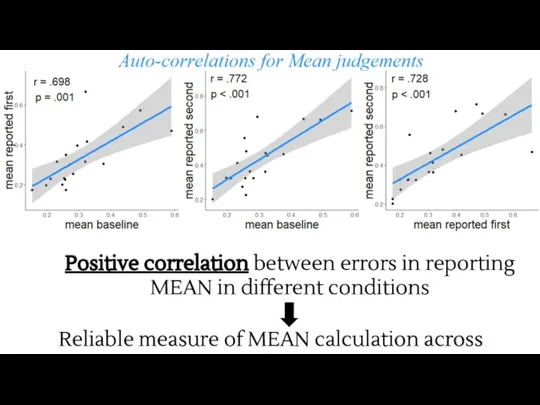
Слайд 15Positive correlation between errors in reporting MEAN in different conditions
Reliable measure of
Positive correlation between errors in reporting MEAN in different conditions
Reliable measure of
Слайд 16Positive correlation between errors in reporting NUMEROSITY in different conditions
Reliable measure of
Positive correlation between errors in reporting NUMEROSITY in different conditions
Reliable measure of
Слайд 17No correlation between errors in reporting different statistics
Independence between MEAN and NUMEROSITY
No correlation between errors in reporting different statistics
Independence between MEAN and NUMEROSITY
Слайд 18Individual correlations
Only one participant showed significant correlation between raw errors in both
Individual correlations
Only one participant showed significant correlation between raw errors in both
Слайд 19Average errors
No difference between mean errors in baseline condition and the first
Average errors
No difference between mean errors in baseline condition and the first
Слайд 20Conclusion
Mean and numerosity are calculated
independently and in parallel
Conclusion
Mean and numerosity are calculated
independently and in parallel
Слайд 21Experiment 2
Whether mean and range can be calculated independently and in parallel?
N=20
Experiment 2
Whether mean and range can be calculated independently and in parallel?
N=20
Слайд 22Procedure
Baseline condition
2 blocks (MEAN or RANGE)
Both condition
1 block (MEAN+ RANGE)
Procedure
Baseline condition
2 blocks (MEAN or RANGE)
Both condition
1 block (MEAN+ RANGE)
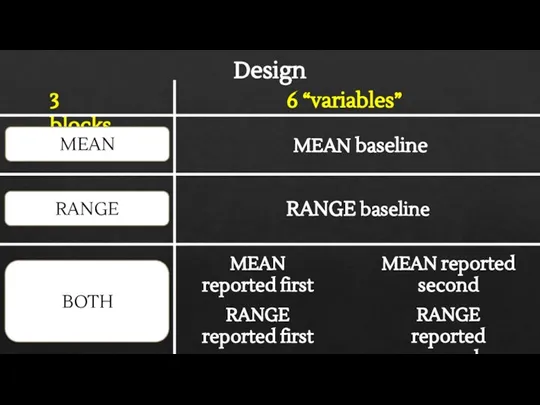
Слайд 23Design
MEAN baseline
3 blocks
MEAN
RANGE
BOTH
6 “variables”
RANGE baseline
MEAN reported first
RANGE reported first
RANGE reported second
MEAN reported
Design
MEAN baseline
3 blocks
MEAN
RANGE
BOTH
6 “variables”
RANGE baseline
MEAN reported first
RANGE reported first
RANGE reported second
MEAN reported
Слайд 24Positive correlation between errors in reporting MEAN in different conditions
Reliable measure of
Positive correlation between errors in reporting MEAN in different conditions
Reliable measure of
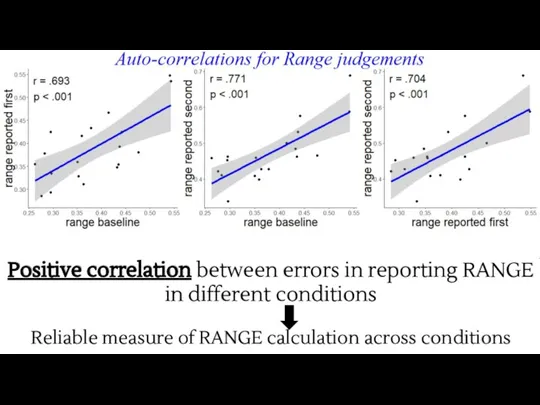
Слайд 25Positive correlation between errors in reporting RANGE in different conditions
Reliable measure of
Positive correlation between errors in reporting RANGE in different conditions
Reliable measure of
Слайд 26No correlation between errors in reporting different statistics
Independence between MEAN and RANGE
No correlation between errors in reporting different statistics
Independence between MEAN and RANGE
Слайд 27Individual correlations
No one showed significant correlation between raw errors in both condition
Independence
Individual correlations
No one showed significant correlation between raw errors in both condition
Independence
Слайд 28Average errors
No difference between mean errors in baseline condition and the first
Average errors
No difference between mean errors in baseline condition and the first
Слайд 29Conclusions
Ensemble summary statistics (mean and numerosity, mean and range) are calculated
independently
Conclusions
Ensemble summary statistics (mean and numerosity, mean and range) are calculated
independently
Слайд 30Conclusions (2)
Independent calculation of ensemble summary statistics means:
(1) Different summaries are calculated
Conclusions (2)
Independent calculation of ensemble summary statistics means:
(1) Different summaries are calculated
Слайд 31For details and even one more experiment please read:
Khvostov V.A., Utochkin I.
For details and even one more experiment please read: Khvostov V.A., Utochkin I.
Слайд 32Thank you for being with me till the end of the first
Thank you for being with me till the end of the first

Слайд 33Confidence intervals in within-subject designs
*Based on Cousineau, 2005
Part #2
Confidence intervals in within-subject designs
*Based on Cousineau, 2005
Part #2
Слайд 34It is all from this 4-pages paper
It is all from this 4-pages paper
Слайд 35The problem
Different subjects can perform very differently which increases a size of
The problem
Different subjects can perform very differently which increases a size of
Слайд 36ANOVA results
an experiment with two factors, the first with two levels and
ANOVA results
an experiment with two factors, the first with two levels and
Слайд 37Results of the experiment
Error bars show the mean ± 1 standard error.
Results of the experiment
Error bars show the mean ± 1 standard error.
Слайд 38The individual results of the 16 participants
The first level of the
The individual results of the 16 participants
The first level of the
Слайд 39The solution of the problem
the
participant
mean
Y =
_
+
the
group
mean
results of the participant in a particular
The solution of the problem
the
participant
mean
Y =
_
+
the
group
mean
results of the participant in a particular
Слайд 40Example of calculations
550–580+635=605
580–580+635=635
610–580+635=665
605 – 635 +635
635 – 635 +635
655 – 635 +635
660
Example of calculations
550–580+635=605
580–580+635=635
610–580+635=665
605 – 635 +635
635 – 635 +635
655 – 635 +635
660
Слайд 41The individual results of the 16 participants after the individual differences were
The individual results of the 16 participants after the individual differences were
Слайд 42The graph after the individual differences were removed
Error bars show the mean
The graph after the individual differences were removed
Error bars show the mean
Слайд 43NOTE: Y is only useful for graphing
purposes; for the analyses, continue to
NOTE: Y is only useful for graphing
purposes; for the analyses, continue to
Слайд 44Example from real life
Error bars show SEM.
Example from real life
Error bars show SEM.
Слайд 45Example from real life
Error bars show SEM.
Example from real life
Error bars show SEM.
 Планирование разработки программного обеспечения (лекция 3)
 Циклические алгоритмы
 Курс 6231A. Поддержка Microsoft®. SQL Server® 2008. Database
 Документооборот
 Engagement Rate
 Учебник Adobe Photoshop. Первое знакомство
 Викторина для самых умных (4 класс)
 Ознайомлення з поняттям алгоритму. (2 клас)
 МПСвЭПиТК. Передача данных
 Компьютерные сети
 Интеллектуальный марафон
 Линейное программирование
 Интернет – площадка Агрохолл
 Архивация данных
 На каких трех китах держится информатика? Логика, алгоритмы и программа
 с++ полная (1)
 Сервисы Интернета
 Деревья. Обход всего дерева. (Лекция 2)
 Data science. Кластеризация
 Использование Google forms в работе с родителями ДОУ
 WHILE … WEND ЦИКЛ
 Роль информатики и информационных технологий в современном мире
 Линейные списки
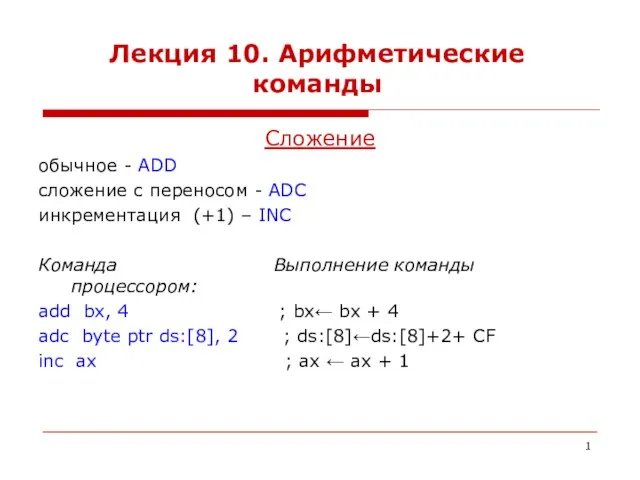 Арифметические команды. (Лекция 10)
 АрхКС _rus лекция1 (1)
 Виджеты. Занятие 10
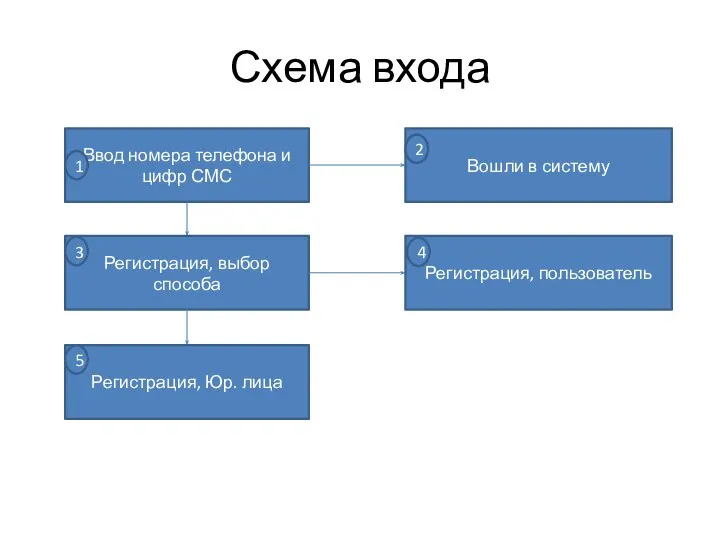 Залогинивание
 Создание программы для шифрования и дешифрования текста на языке Pascal