- Line graph essay

Содержание
- 2. 5 steps: 1) Analyse the question 2) Identify the main features 3) Write an introduction 4)
- 3. Your essay should have 4 paragraphs: Paragraph 1 – Introduction Paragraph 2 – Overview Paragraph 3
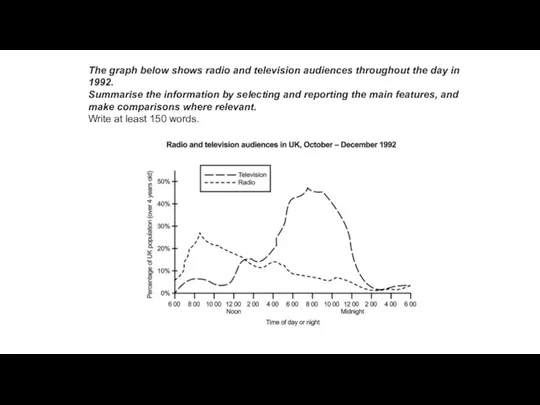
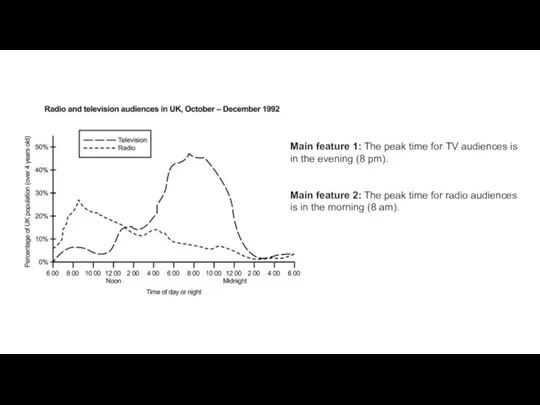
- 4. The graph below shows radio and television audiences throughout the day in 1992. Summarise the information
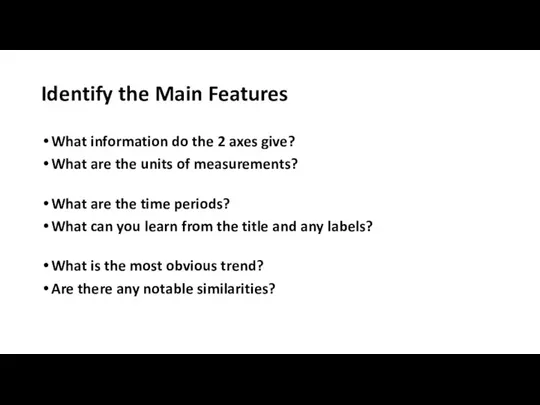
- 5. Identify the Main Features What information do the 2 axes give? What are the units of
- 6. Main feature 1: The peak time for TV audiences is in the evening (8 pm). Main
- 7. Write an Introduction Question: The graph below shows radio and television audiences throughout the day in
- 8. Write an Overview (Paragraph 2) Overview (Paragraph 2): Overall, a significantly greater percentage of the TV
- 9. Write the 1st Detail Paragraph Here is our first main feature again: Main feature 1: The
- 10. Write the 2nd Detail Paragraph For the fourth and final paragraph, you do the same thing
- 12. Скачать презентацию
Слайд 3Your essay should have 4 paragraphs:
Paragraph 1 – Introduction
Paragraph 2 – Overview
Paragraph 3 – 1st main
Your essay should have 4 paragraphs:
Paragraph 1 – Introduction
Paragraph 2 – Overview
Paragraph 3 – 1st main
Слайд 4The graph below shows radio and television audiences throughout the day in
The graph below shows radio and television audiences throughout the day in
Слайд 5
Identify the Main Features
What information do the 2 axes give?
What are the
Identify the Main Features
What information do the 2 axes give?
What are the
Слайд 6Main feature 1: The peak time for TV audiences is in the evening
Main feature 1: The peak time for TV audiences is in the evening
Слайд 7Write an Introduction
Question:
The graph below shows radio and television audiences throughout the
Write an Introduction
Question:
The graph below shows radio and television audiences throughout the
Слайд 8Write an Overview (Paragraph 2)
Overview (Paragraph 2):
Overall, a significantly greater percentage of the
Write an Overview (Paragraph 2)
Overview (Paragraph 2):
Overall, a significantly greater percentage of the
Слайд 9Write the 1st Detail Paragraph
Here is our first main feature again:
Main feature 1: The
Write the 1st Detail Paragraph
Here is our first main feature again:
Main feature 1: The

Слайд 10Write the 2nd Detail Paragraph
For the fourth and final paragraph, you do
Write the 2nd Detail Paragraph
For the fourth and final paragraph, you do
 numPy
numPy Введение в программу CorelDRAW
 измерение1
 Обобщенная модель нейрона. Персептрон (структура, алгоритмы обучения). Решение задачи распознавания образов с помощью НС
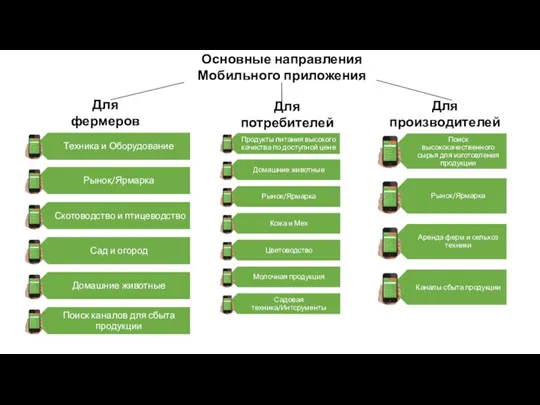 Основные направления мобильного приложения
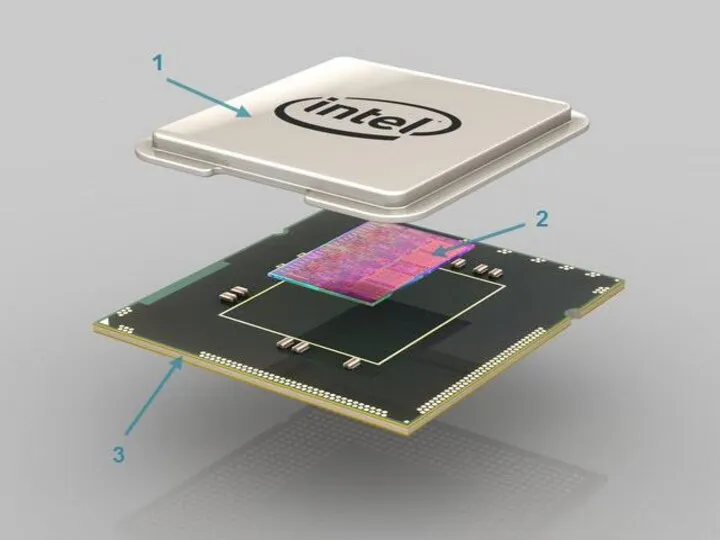 Тестирование ЭВМ
 База данных. Подготовка к ЕГЭ
 Информационное моделирование. Модели объектов и их назначение
 Решение прикладных задач и разработка приложений на языке Python
 Классификация и применение нейросетей
 Карта социологических организаций и информационных ресурсов России
 Маскируемые подсистемы
 DeLion Re:start - изменить образ жизни
 Network services
 Риски и возможности интернета
 Персональный компьютер (часть 1)
 Устройство компьютера
 Start. Pfyznbt 3
 Подготовка материалов на конкурс в облачной среде МойОфис
 Технология работы с инфоповодами
 Все, все про Майнкрафт
 MeSH Медицинский предметный указатель
 База данных. MySQL (Занятие 10)
 Авито для вашего бизнеса
 Шаблон презентации по информатике
 Программное обеспечение astraia
 Организация хранения информации в компьютере
 Zoom регистрация