- Project information

Содержание
- 2. Why doing a project? to be able to prepare data, analyze data and provide meaningful answers
- 3. Parts of the Project data collection data understanding data preparation data description data analysis (hypothesis testing)
- 4. 1. Data Collection kaggle https://www.kaggle.com/ own research UCI Machine Learning Repository https://archive.ics.uci.edu/ml/index.php
- 5. 2. Data Understanding one of the most critical parts necessary for further data analysis and hypothesis
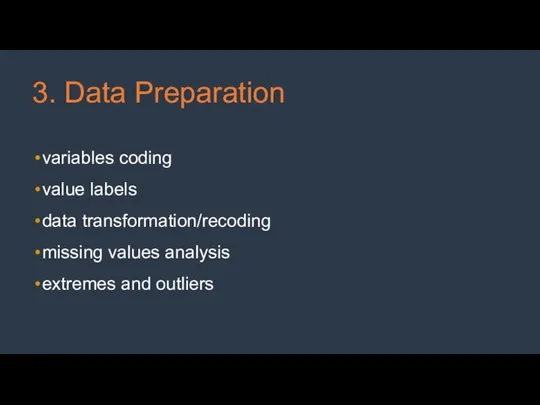
- 6. 3. Data Preparation variables coding value labels data transformation/recoding missing values analysis extremes and outliers
- 7. 4. Data Description descriptive statistics graphs
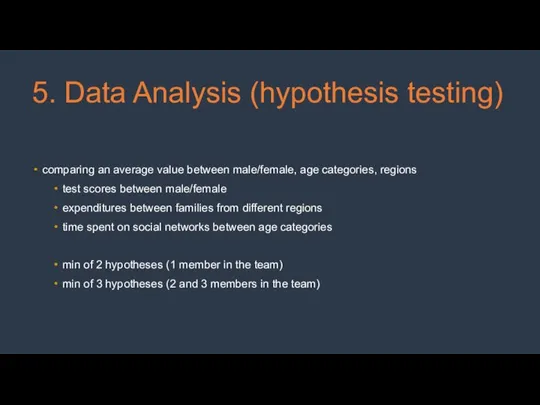
- 8. 5. Data Analysis (hypothesis testing) comparing an average value between male/female, age categories, regions test scores
- 10. Скачать презентацию
Слайд 3Parts of the Project
data collection
data understanding
data preparation
data description
data analysis (hypothesis testing)
Parts of the Project
data collection
data understanding
data preparation
data description
data analysis (hypothesis testing)
Слайд 41. Data Collection
kaggle
https://www.kaggle.com/
own research
UCI Machine Learning Repository
https://archive.ics.uci.edu/ml/index.php
1. Data Collection
kaggle
https://www.kaggle.com/
own research
UCI Machine Learning Repository
https://archive.ics.uci.edu/ml/index.php
Слайд 52. Data Understanding
one of the most critical parts
necessary for further data analysis
2. Data Understanding
one of the most critical parts
necessary for further data analysis
Слайд 63. Data Preparation
variables coding
value labels
data transformation/recoding
missing values analysis
extremes and outliers
3. Data Preparation
variables coding
value labels
data transformation/recoding
missing values analysis
extremes and outliers
Слайд 74. Data Description
descriptive statistics
graphs
4. Data Description
descriptive statistics
graphs
Слайд 85. Data Analysis (hypothesis testing)
comparing an average value between male/female, age categories,
5. Data Analysis (hypothesis testing)
comparing an average value between male/female, age categories,
 Анализ по открытым данным
 Создание и разработка мобильной игры
 Устройства Памяти компьютера
 Логические основы работы компьютера
 Конструктор индивидуальной траектории профессионального роста
 Обзор программного обеспечения ПК
 Пять наиболее распространенных заблуждений в отношении Linux
 Системное программное обеспечение. OC Windows. (Лекция 6.3)
 Линейные списки
 Государственные информационные системы на гражданской службе
 Программирование на Python. Ввод. Вывод. Оператор присваивания. Математические операции
 Программирование. Занятие 7 - 8. Базовые формулы (зависимости) и задачи
 Презентация на тему Классификация компьютеров по функциональным возможностям
  День информатики
 Пошаговая инструкция по регистрации. Центр компетенций
 Cybersport-bootsamp
 Таблицы и массивы
 Итоговая работа по дисциплине Основы информационной безопасности
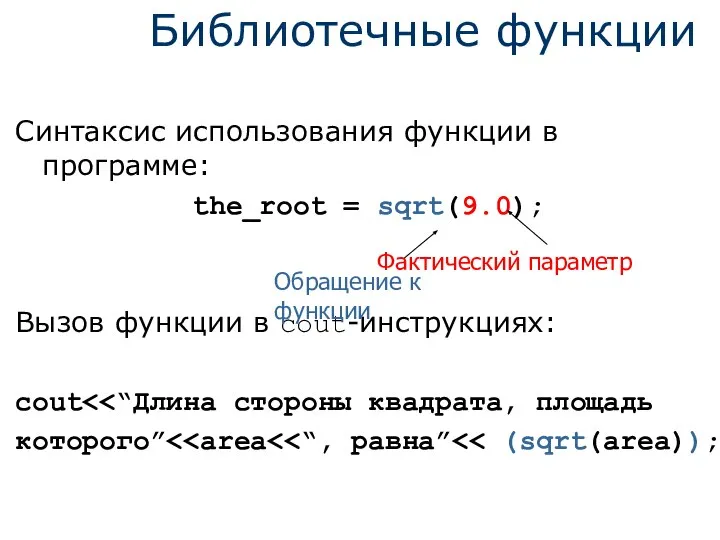 Библиотечные функции. Синтаксис использования функции в программе: the_root = sqrt(9.0)
 Работа в программе Audacity
 Система “БААН”. Оптимальное управление в условиях современной конкуренции
 Kodirovanie_zvuka
 Система управления службой каталогов с поддержкой групповых политик. Dynamic Directory
 Цикл с условием окончания работы
 Objektorientierte Programmierung
 Разработка тематического проекта Web-сайта различными инструментами
 Применение информационных технологий в фармацевтической деятельности
 Детали. Варианты соединения балок