- Chelyabinsk region: economical and geographic portrait of the region

Содержание
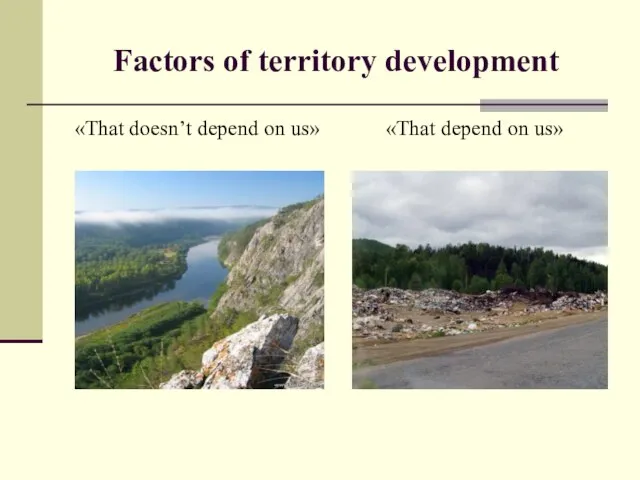
- 2. Factors of territory development «That doesn’t depend on us» «That depend on us»
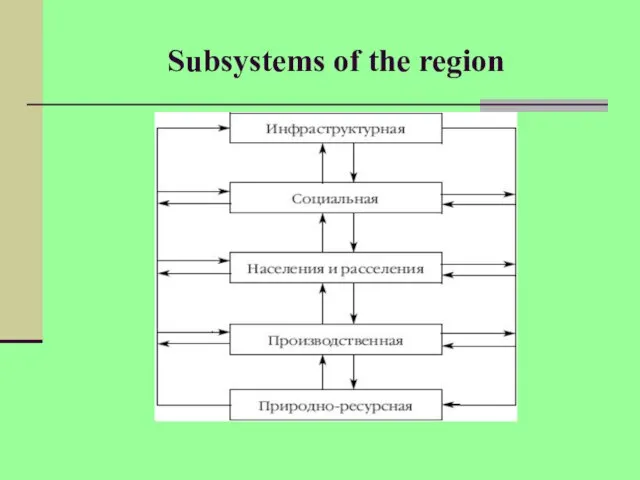
- 3. Subsystems of the region
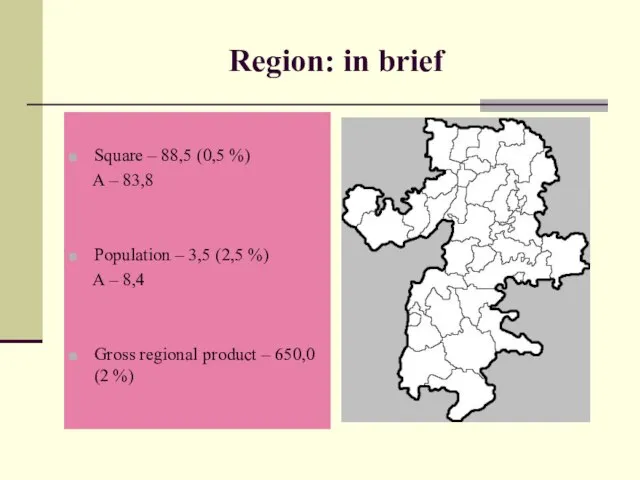
- 4. Region: in brief Square – 88,5 (0,5 %) А – 83,8 Population – 3,5 (2,5 %)
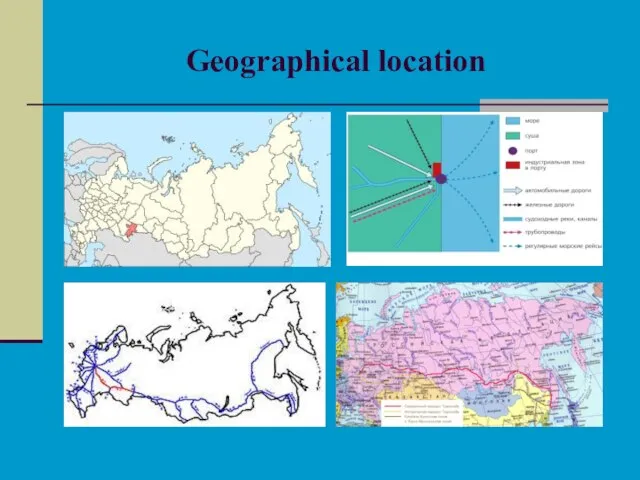
- 5. Geographical location
- 6. Territory Features: 1. Efficiency. 2. Relative size. 3. Relative location . 4. Integrity. 4. Saturation. 5.
- 7. Natural conditions 20 % - mountain territory Almost comfortable territory Periodical draughts Spring’s big water Geochemical
- 9. Territory: bronze age
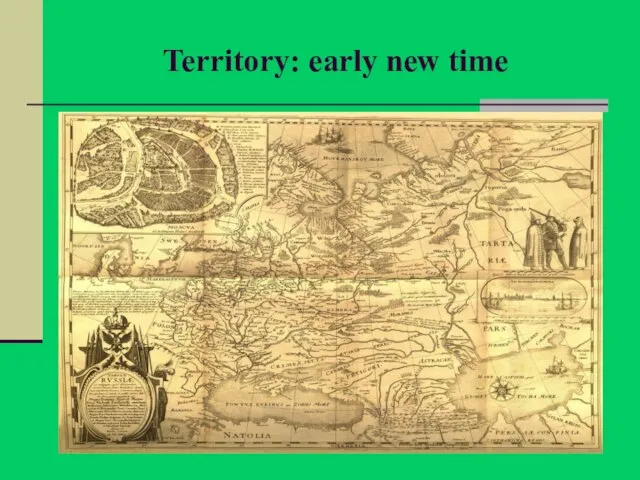
- 10. Territory: early new time
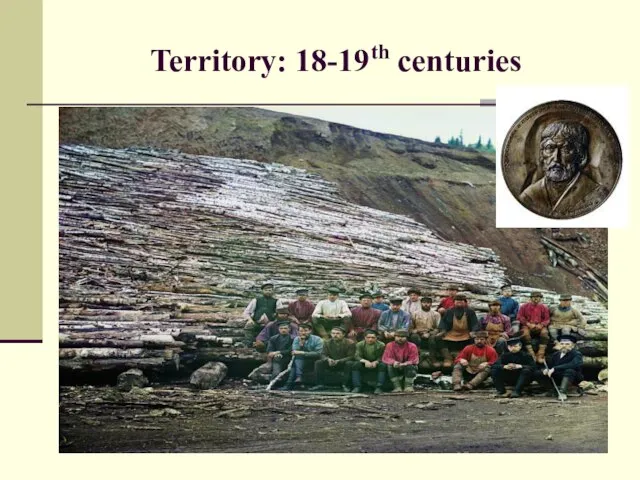
- 11. Territory: 18-19th centuries
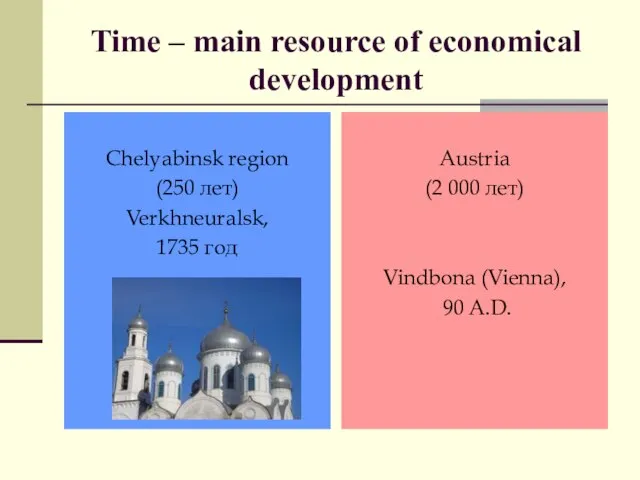
- 12. Time – main resource of economical development Chelyabinsk region (250 лет) Verkhneuralsk, 1735 год Austria (2
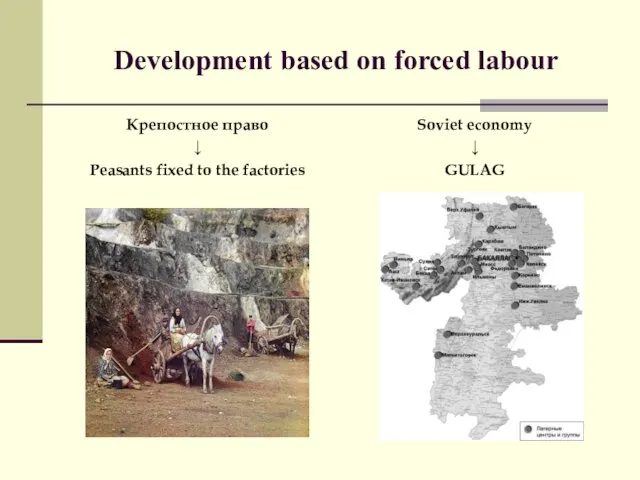
- 13. Development based on forced labour Крепостное право ↓ Peasants fixed to the factories Soviet economy ↓
- 14. Dynamics of populations
- 15. Demographic features Negative: Population decrease (from 1992) High death rate (especially, men) Increase of old population
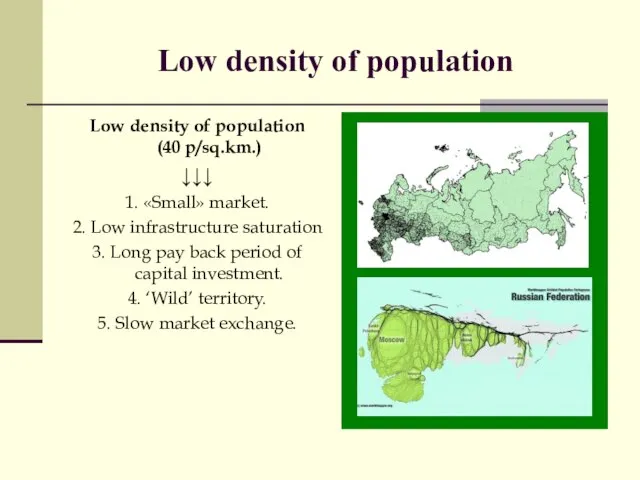
- 16. Low density of population Low density of population (40 p/sq.km.) ↓↓↓ 1. «Small» market. 2. Low
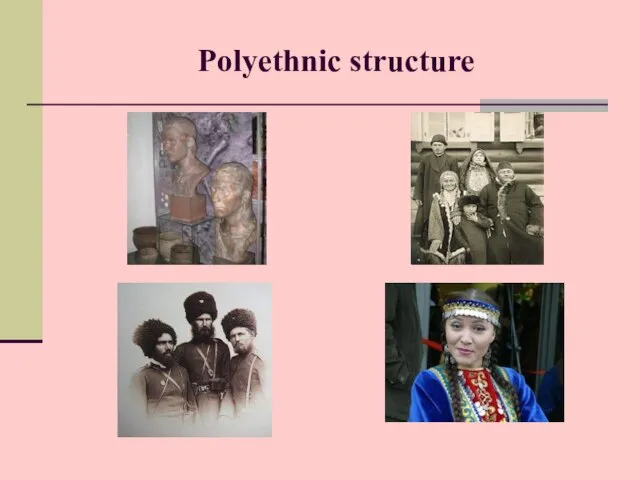
- 17. Polyethnic structure
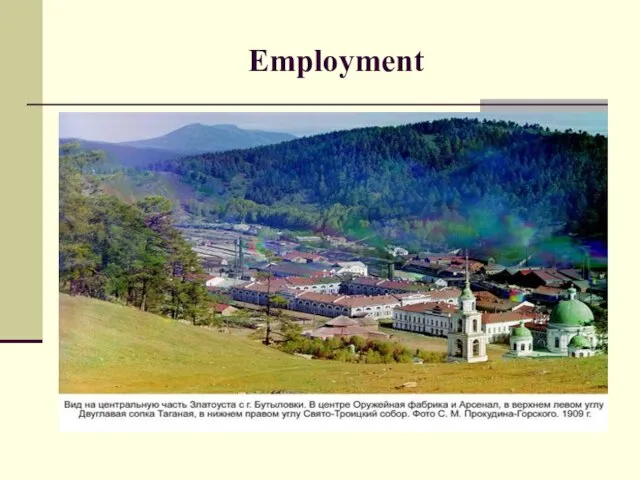
- 18. Employment
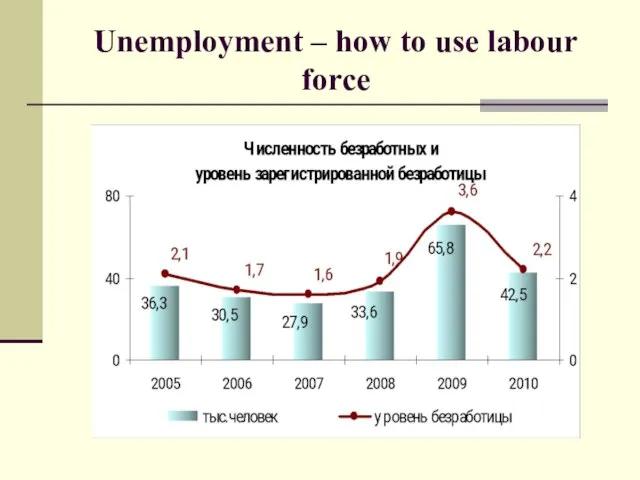
- 19. Unemployment – how to use labour force
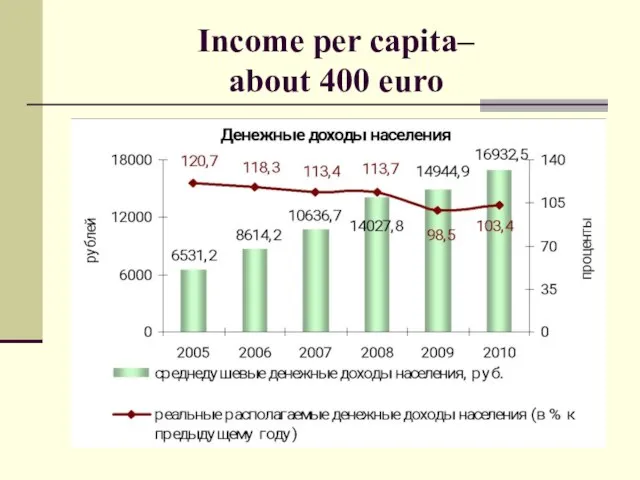
- 20. Income per capita– about 400 euro
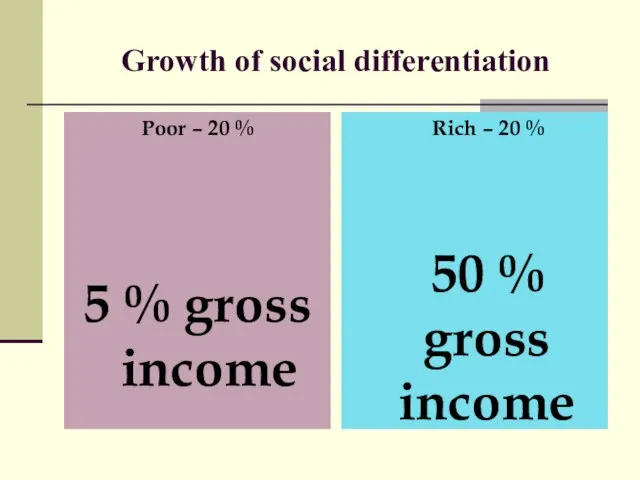
- 21. Growth of social differentiation Poor – 20 % 5 % gross income Rich – 20 %
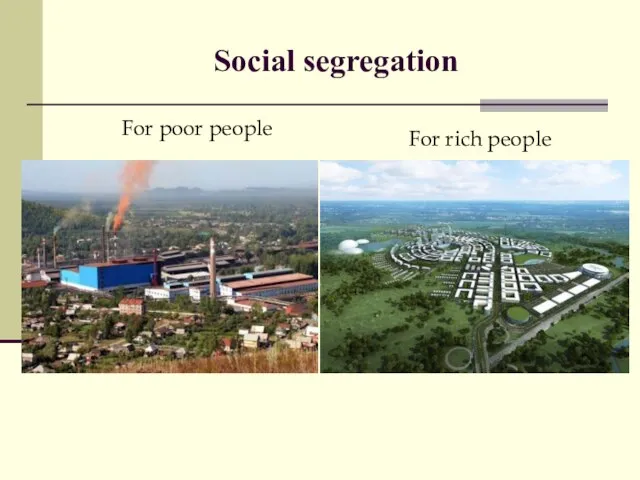
- 22. Social segregation For poor people For rich people
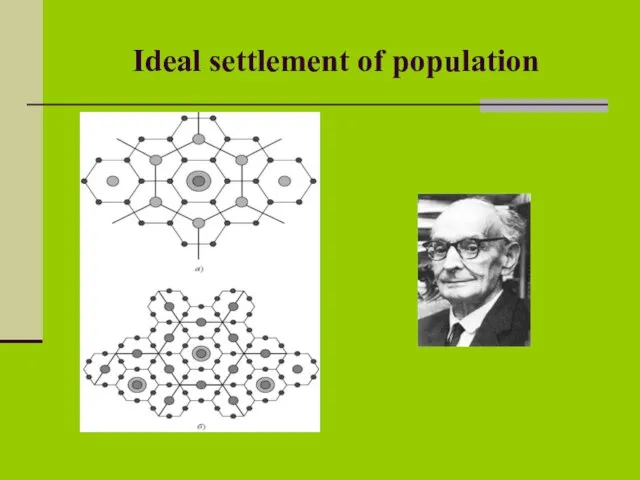
- 23. Ideal settlement of population
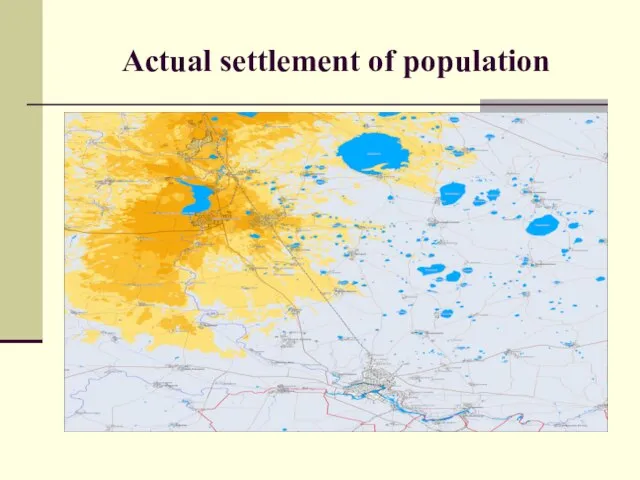
- 24. Actual settlement of population
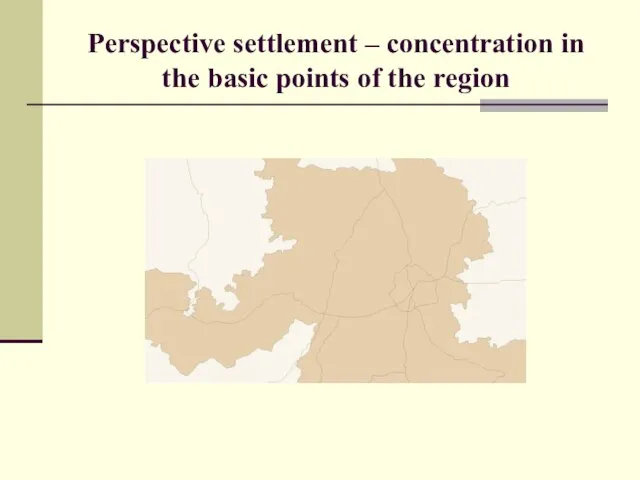
- 25. Perspective settlement – concentration in the basic points of the region
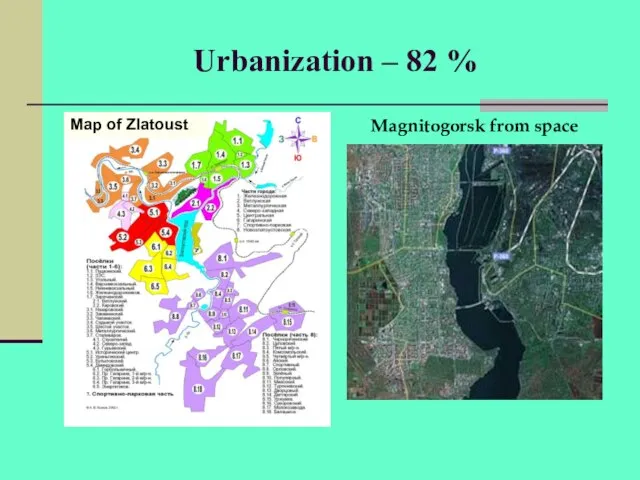
- 26. Urbanization – 82 % Magnitogorsk from space Map of Zlatoust
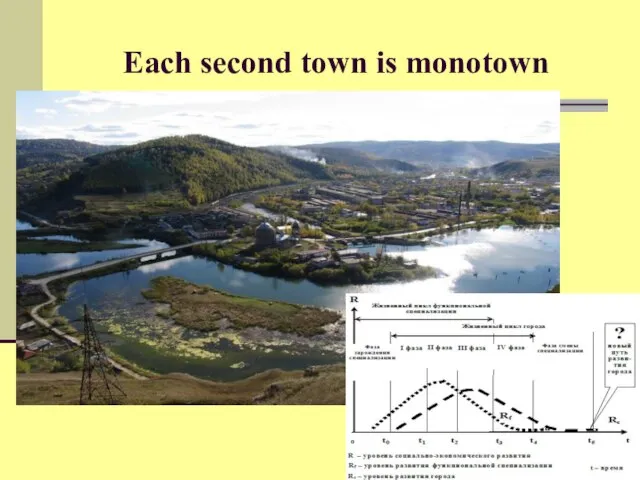
- 27. Each second town is monotown
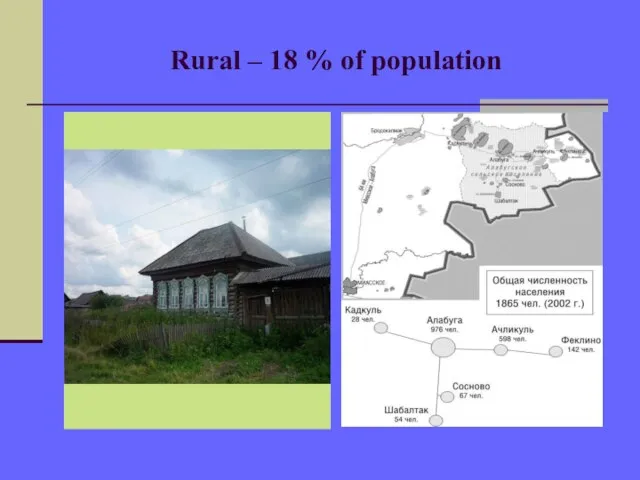
- 28. Rural – 18 % of population
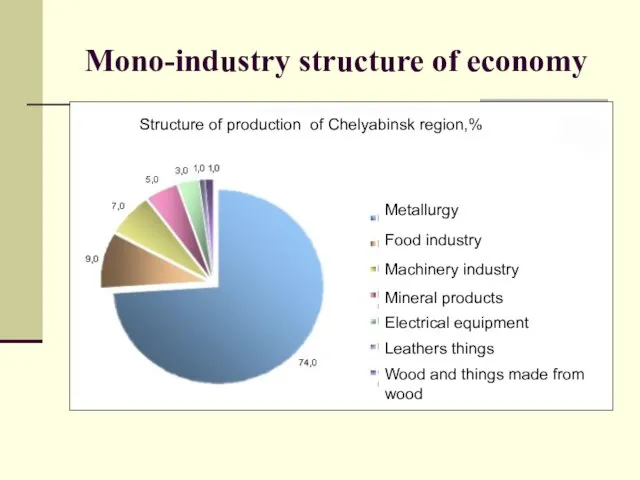
- 29. Mono-industry structure of economy Structure of production of Chelyabinsk region,% Metallurgy Food industry Machinery industry Mineral
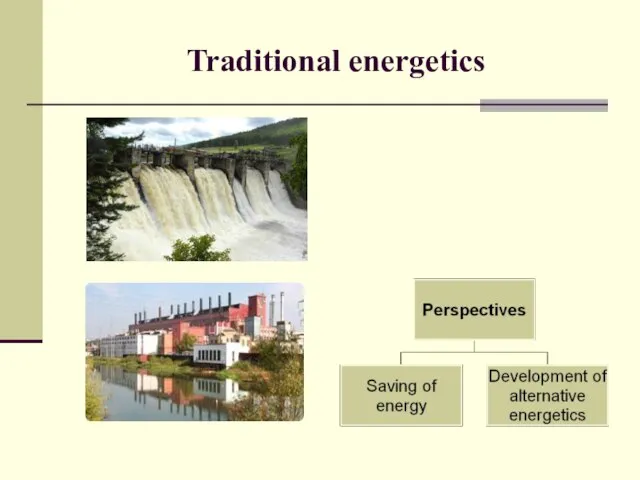
- 30. Traditional energetics
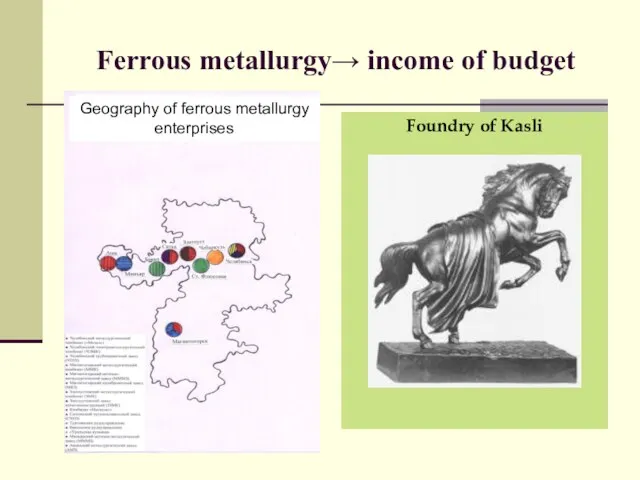
- 31. Ferrous metallurgy→ income of budget Foundry of Kasli Geography of ferrous metallurgy enterprises
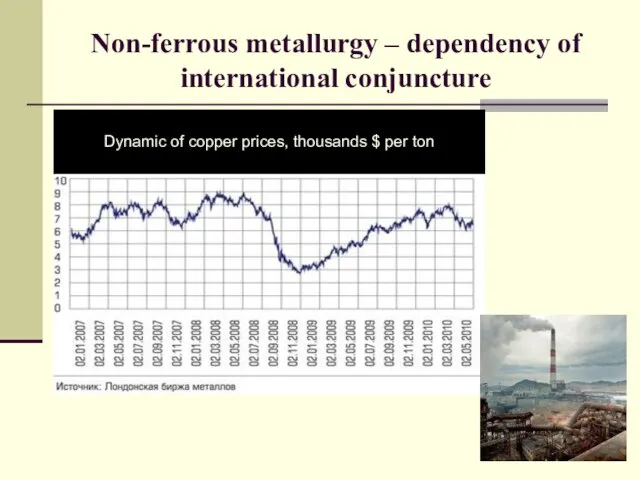
- 32. Non-ferrous metallurgy – dependency of international conjuncture Dynamic of copper prices, thousands $ per ton
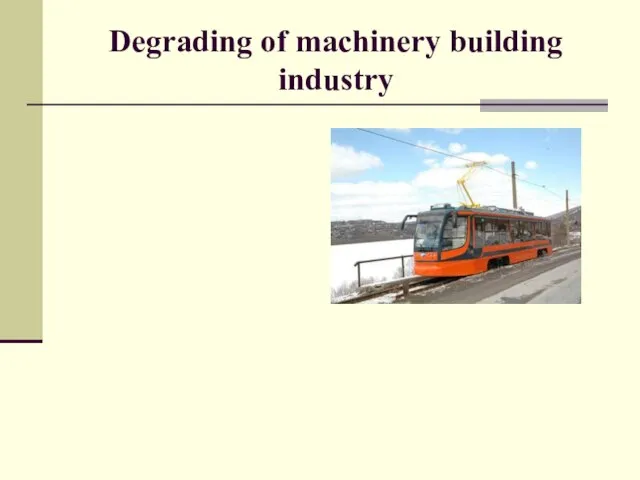
- 33. Degrading of machinery building industry
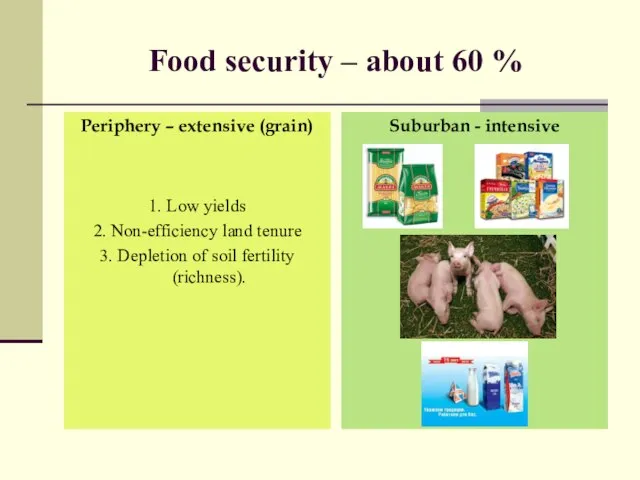
- 34. Food security – about 60 % Periphery – extensive (grain) 1. Low yields 2. Non-efficiency land
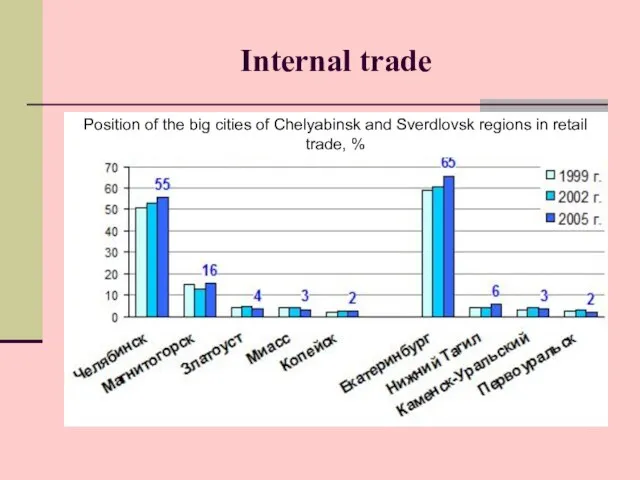
- 35. Internal trade Position of the big cities of Chelyabinsk and Sverdlovsk regions in retail trade, %
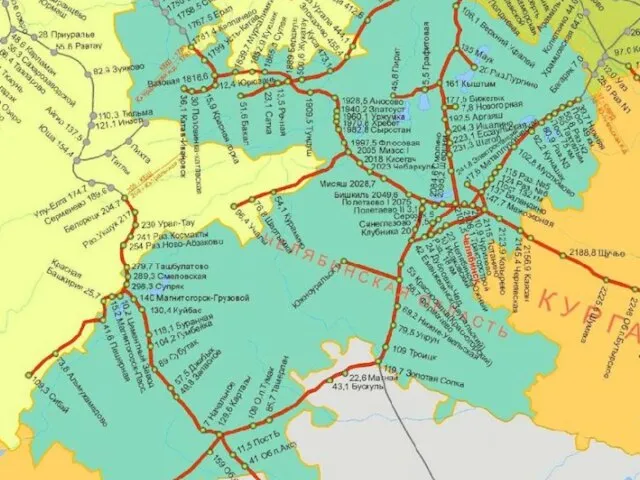
- 36. Инфраструктура
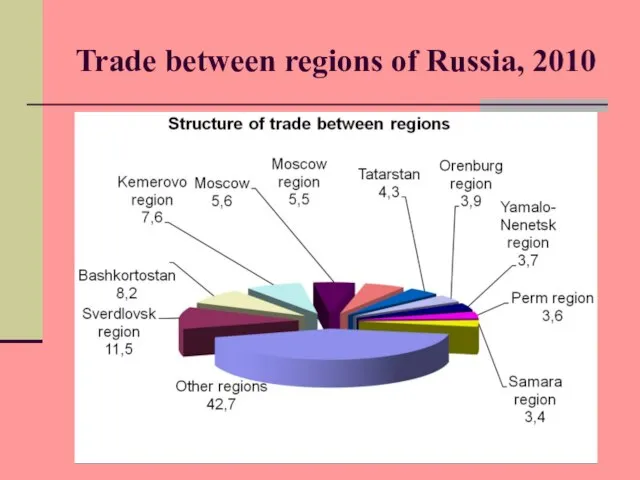
- 37. Trade between regions of Russia, 2010
- 38. International relations More than 120 countries 1 600 companies Positive trade balance Semi-food export (-) Raw
- 39. Bipolar organization of regional economy Chelyabinsk + Magnitogorsk = 50 % of population, 70 % retail
- 40. Main problems Development based on inertia (persistence) Market without competition
- 42. Скачать презентацию
Слайд 3Subsystems of the region
Subsystems of the region
Слайд 4Region: in brief
Square – 88,5 (0,5 %)
А – 83,8
Population – 3,5
Region: in brief
Square – 88,5 (0,5 %)
А – 83,8
Population – 3,5
Слайд 5Geographical location
Geographical location
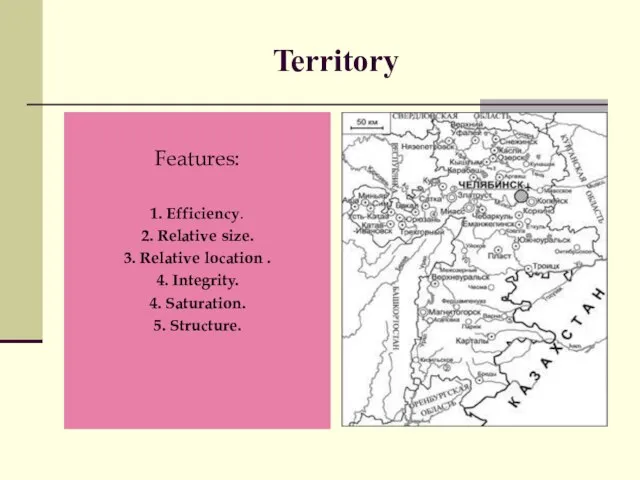
Слайд 6Territory
Features:
1. Efficiency.
2. Relative size.
3. Relative location .
4. Integrity.
4. Saturation.
5. Structure.
Territory
Features:
1. Efficiency.
2. Relative size.
3. Relative location .
4. Integrity.
4. Saturation.
5. Structure.
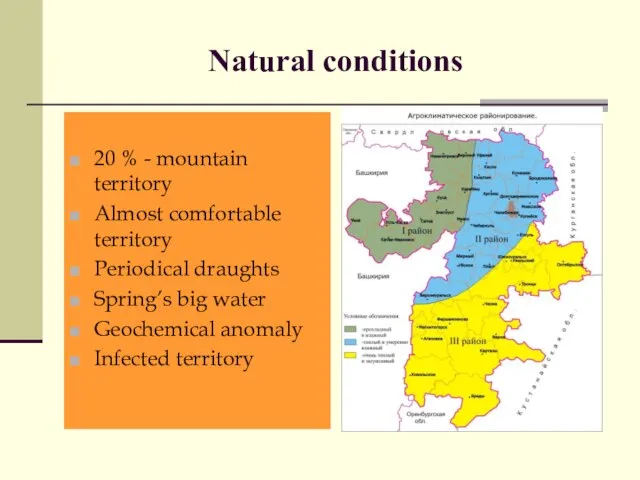
Слайд 7Natural conditions
20 % - mountain territory
Almost comfortable territory
Periodical draughts
Spring’s big water
Geochemical anomaly
Infected
Natural conditions
20 % - mountain territory
Almost comfortable territory
Periodical draughts
Spring’s big water
Geochemical anomaly
Infected
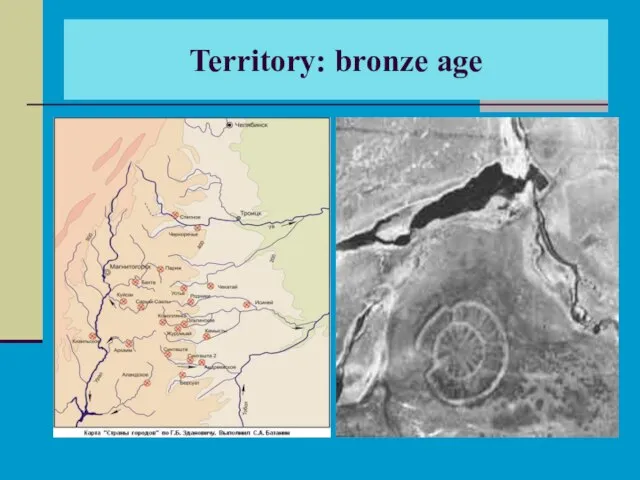
Слайд 9Territory: bronze age
Territory: bronze age
Слайд 10Territory: early new time
Territory: early new time
Слайд 11Territory: 18-19th centuries
Territory: 18-19th centuries
Слайд 12Time – main resource of economical development
Chelyabinsk region
(250 лет)
Verkhneuralsk,
1735 год
Austria
(2 000
Time – main resource of economical development
Chelyabinsk region
(250 лет)
Verkhneuralsk,
1735 год
Austria
(2 000
Слайд 13Development based on forced labour
Крепостное право
↓
Peasants fixed to the factories
Soviet economy
↓
GULAG
Development based on forced labour
Крепостное право
↓
Peasants fixed to the factories
Soviet economy
↓
GULAG
Слайд 14Dynamics of populations
Dynamics of populations
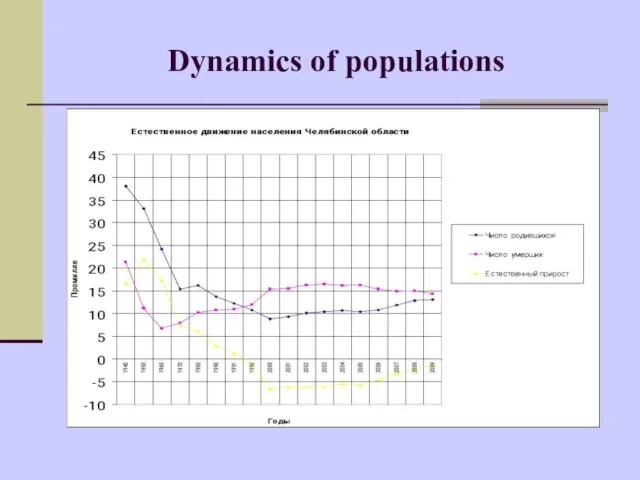
Слайд 15Demographic features
Negative:
Population decrease (from 1992)
High death rate (especially, men)
Increase of old population
Disproportion
Demographic features
Negative:
Population decrease (from 1992)
High death rate (especially, men)
Increase of old population
Disproportion
Слайд 16Low density of population
Low density of population
(40 p/sq.km.)
↓↓↓
1. «Small» market.
2. Low
Low density of population
Low density of population
(40 p/sq.km.)
↓↓↓
1. «Small» market.
2. Low
Слайд 17Polyethnic structure
Polyethnic structure
Слайд 18Employment
Employment
Слайд 19Unemployment – how to use labour force
Unemployment – how to use labour force
Слайд 20Income per capita–
about 400 euro
Income per capita–
about 400 euro
Слайд 21Growth of social differentiation
Poor – 20 %
5 % gross income
Rich –
Growth of social differentiation
Poor – 20 %
5 % gross income
Rich –
Слайд 22Social segregation
For poor people
For rich people
Social segregation
For poor people
For rich people
Слайд 23Ideal settlement of population
Ideal settlement of population
Слайд 24Actual settlement of population
Actual settlement of population
Слайд 25Perspective settlement – concentration in the basic points of the region
Perspective settlement – concentration in the basic points of the region
Слайд 26Urbanization – 82 %
Magnitogorsk from space
Map of Zlatoust
Urbanization – 82 %
Magnitogorsk from space
Map of Zlatoust
Слайд 27Each second town is monotown
Each second town is monotown
Слайд 28Rural – 18 % of population
Rural – 18 % of population
Слайд 29Mono-industry structure of economy
Structure of production of Chelyabinsk region,%
Metallurgy
Food industry
Machinery industry
Mineral products
Electrical
Mono-industry structure of economy
Structure of production of Chelyabinsk region,%
Metallurgy
Food industry
Machinery industry
Mineral products
Electrical
Слайд 30Traditional energetics
Traditional energetics
Слайд 31Ferrous metallurgy→ income of budget
Foundry of Kasli
Geography of ferrous metallurgy enterprises
Ferrous metallurgy→ income of budget
Foundry of Kasli
Geography of ferrous metallurgy enterprises
Слайд 32Non-ferrous metallurgy – dependency of international conjuncture
Dynamic of copper prices, thousands $
Non-ferrous metallurgy – dependency of international conjuncture
Dynamic of copper prices, thousands $
Слайд 33Degrading of machinery building industry
Degrading of machinery building industry
Слайд 34Food security – about 60 %
Periphery – extensive (grain)
1. Low yields
2. Non-efficiency
Food security – about 60 %
Periphery – extensive (grain)
1. Low yields
2. Non-efficiency
Слайд 35Internal trade
Position of the big cities of Chelyabinsk and Sverdlovsk regions in
Internal trade
Position of the big cities of Chelyabinsk and Sverdlovsk regions in
Слайд 36Инфраструктура
Инфраструктура
Слайд 37Trade between regions of Russia, 2010
Trade between regions of Russia, 2010
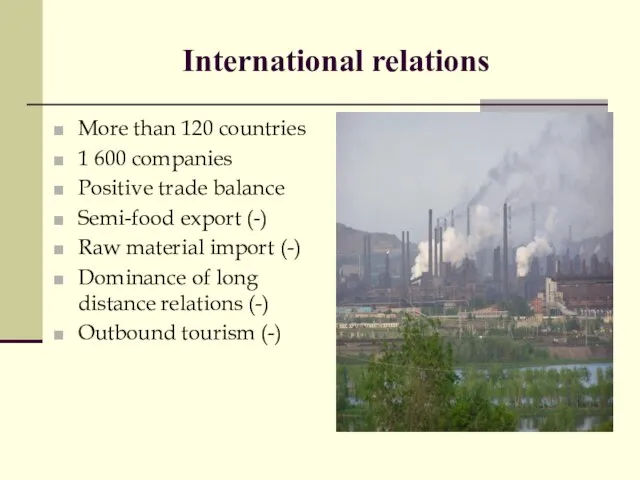
Слайд 38International relations
More than 120 countries
1 600 companies
Positive trade balance
Semi-food export (-)
Raw material
International relations
More than 120 countries
1 600 companies
Positive trade balance
Semi-food export (-)
Raw material
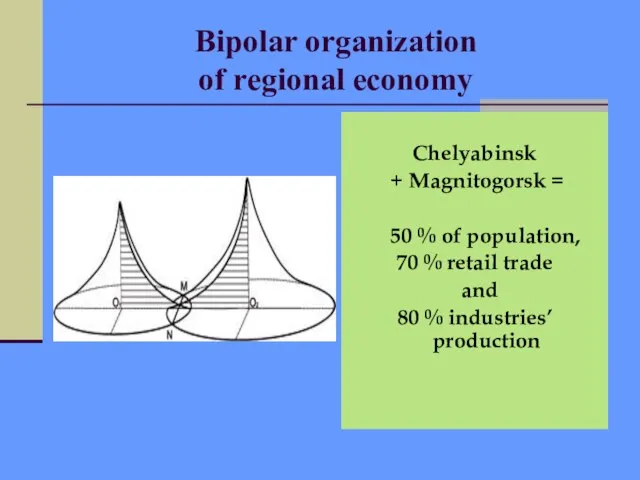
Слайд 39Bipolar organization
of regional economy
Chelyabinsk
+ Magnitogorsk =
50 % of population,
Bipolar organization
of regional economy
Chelyabinsk
+ Magnitogorsk =
50 % of population,
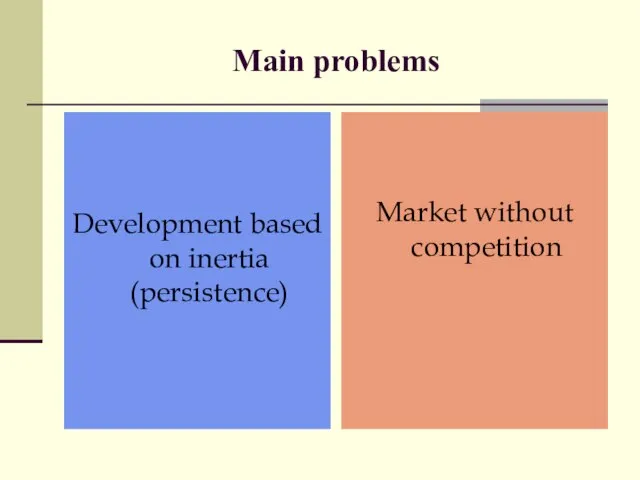
Слайд 40Main problems
Development based on inertia (persistence)
Market without competition
Main problems
Development based on inertia (persistence)
Market without competition
 Конструкт урока
 Презентация на тему Профессия шофер
  Камышинский ХБКТекстильный кластер «Поволжье»
 Совет Существ
 Береги глаза смолоду!
 Диаграмма №1
  Правила сравнения дробей
 Очистка поверхностных вод Минско-Вилейской системы
 Об обучении эсперанто
 Бренд города
 Янтарные штучки
 Обязательные элементы спортивных дисциплин
 Молдавия
 Металлы
 Материалы К заседанию Общественного совета при Федеральной службе по экологическому, технологическому и атомному надзору ПРЕД
 Компания «ФОРМА»ПРЕДСТАВЛЯЕТ…….
 Мировая история: переход к новому времени. Россия в 16-17вв.
 Бизнес-план придорожного отеля Кипарис
 psikhya_Microsoft_PowerPoint
 Партнёрство бизнеса и Даунсайд Ап. Дети с синдромом Дауна в России Каждый год в России рождается 2500 детей с синдромом Дауна. От 85% та
 «Для ребят дошкольного возраста игры имеют исключительное значение: игра для них – учеба, игра для них – труд, игра для них – серье
 Сущность человека и смысл человеческой жизни
 Организация внеурочной деятельности
 Авангардизм в музыке
 Результаты анкетирования«Определение уровня информированности о подготовке и процедуре проведения ЕГЭ» (ноябрь 2010г.)
 Творчество Караваджо, Веласкеса
 Вирусные видео на YouTube: успех - дело техники
 Adidas performance outdoor ss'22