- Choosing independent variables

Содержание
- 2. Choosing independent variables Three popular methods of choosing independent variables are: Hellwig's method Graphs analysis method
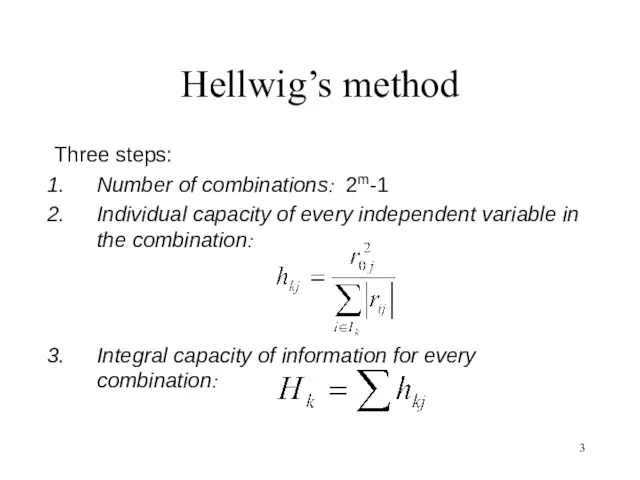
- 3. Hellwig’s method Three steps: Number of combinations: 2m-1 Individual capacity of every independent variable in the
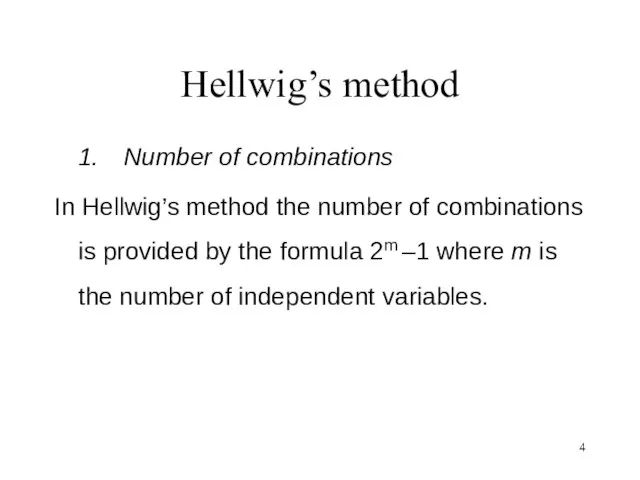
- 4. Hellwig’s method 1. Number of combinations In Hellwig’s method the number of combinations is provided by
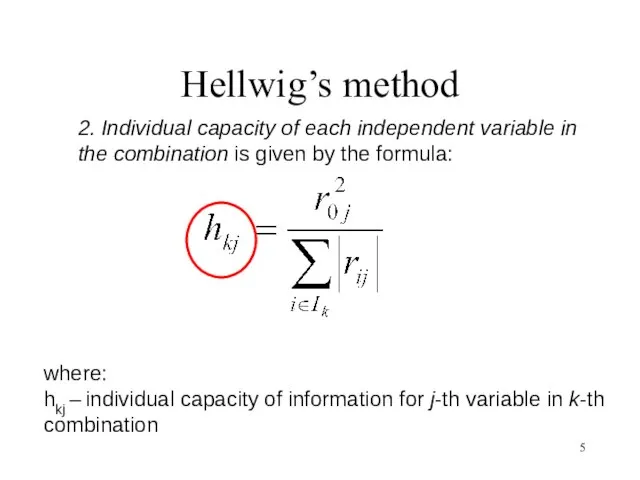
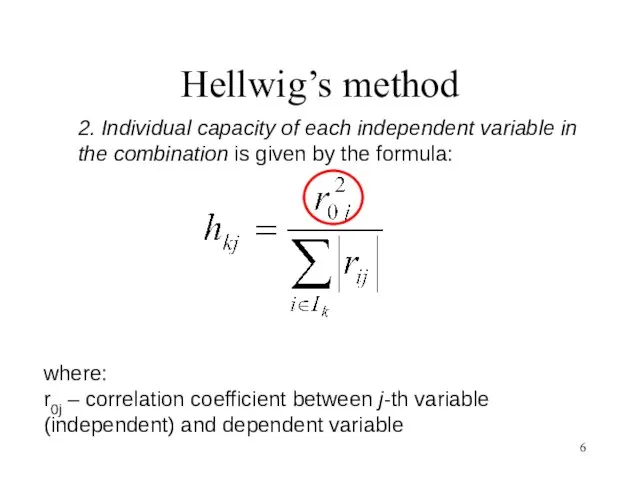
- 5. Hellwig’s method 2. Individual capacity of each independent variable in the combination is given by the
- 6. Hellwig’s method 2. Individual capacity of each independent variable in the combination is given by the
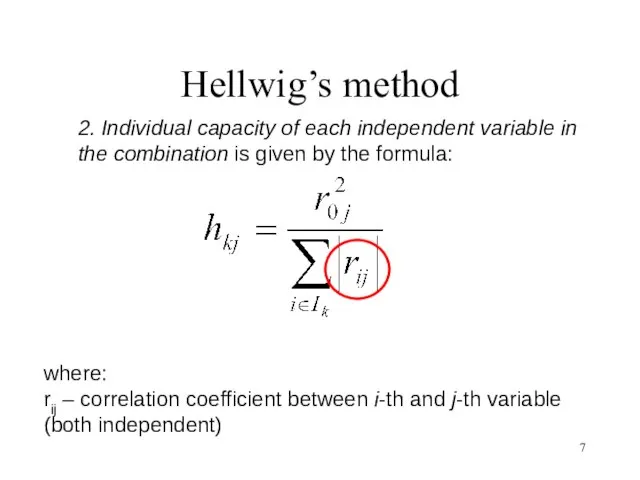
- 7. Hellwig’s method 2. Individual capacity of each independent variable in the combination is given by the
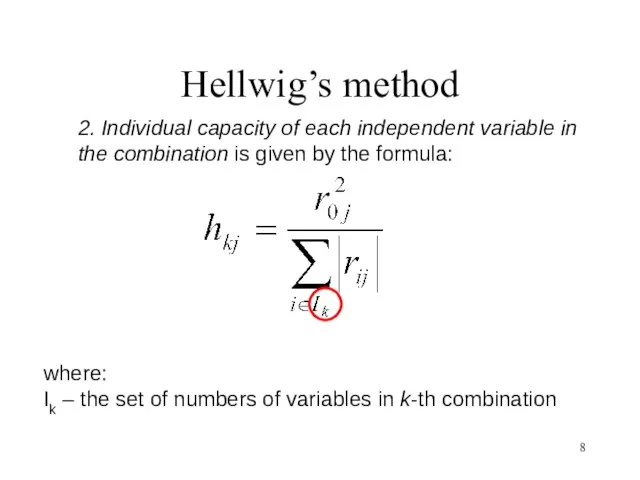
- 8. Hellwig’s method 2. Individual capacity of each independent variable in the combination is given by the
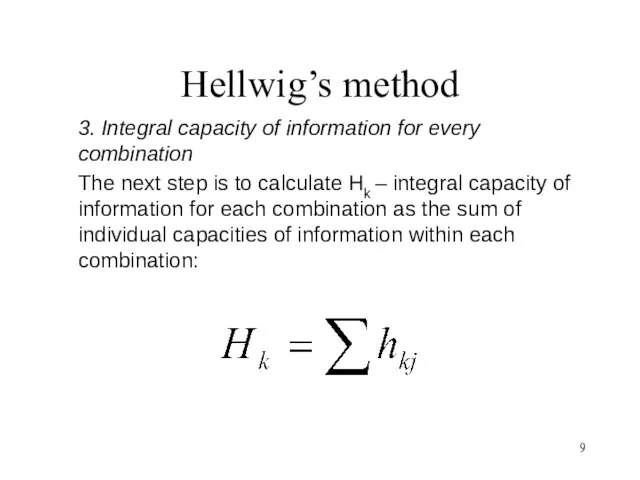
- 9. Hellwig’s method 3. Integral capacity of information for every combination The next step is to calculate
- 10. Hellwig’s method Q: HOW TO CHOOSE INDEPENDENT VARIABLES? A: LOOK AT INTEGRAL CAPACITIES OF INFORMATION. THE
- 11. Example Let’s choose independent variables, using Hellwig's method.
- 12. Example First we need to have vector and matrix of correlation coefficients. ❑ Correlation coefficients between
- 13. Example First we need to have vector and matrix of correlation coefficients. ❑ Correlation matrix R
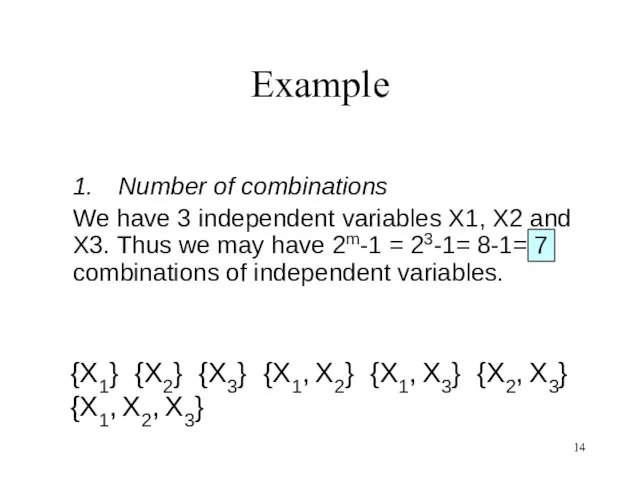
- 14. Example 1. Number of combinations We have 3 independent variables X1, X2 and X3. Thus we
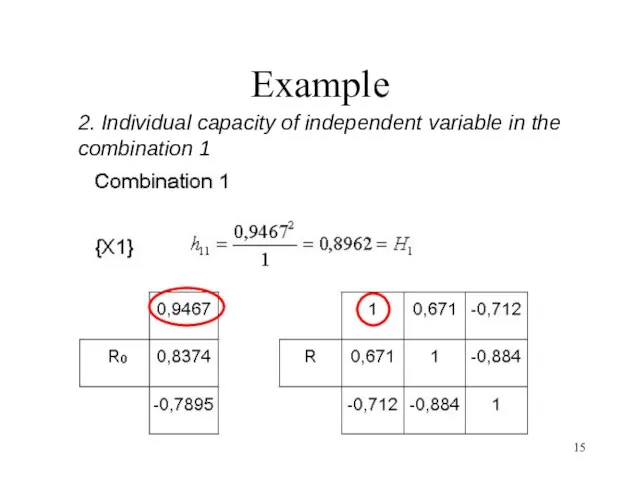
- 15. Example 2. Individual capacity of independent variable in the combination 1
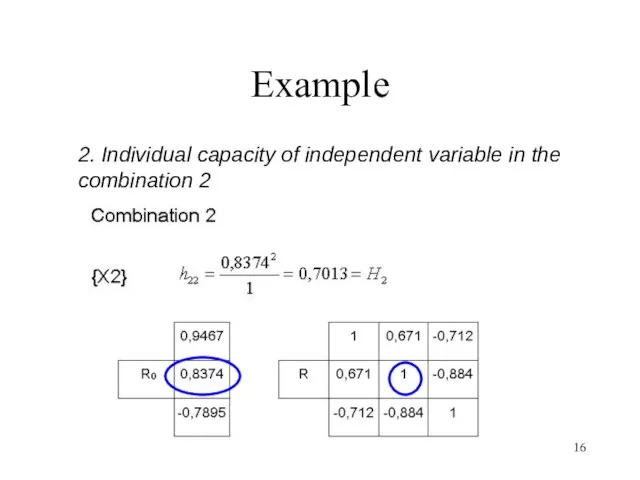
- 16. Example 2. Individual capacity of independent variable in the combination 2
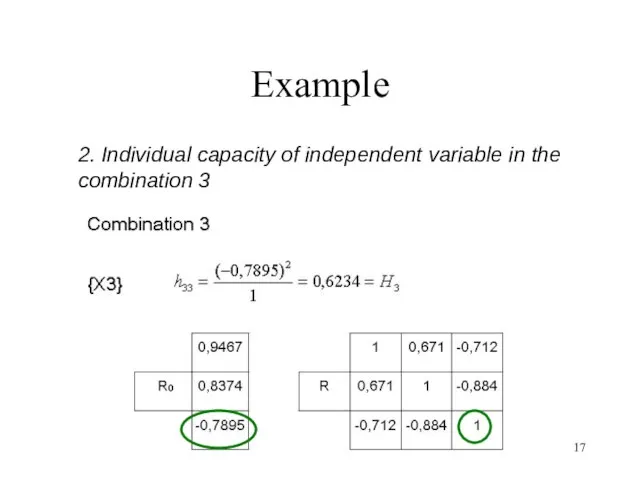
- 17. Example 2. Individual capacity of independent variable in the combination 3
- 18. Example 2. Individual capacity of every independent variable in the combination 4
- 19. Example 2. Individual capacity of independent variables in the combination 5
- 20. Example 2. Individual capacity of every independent variables in the combination 6
- 21. Example
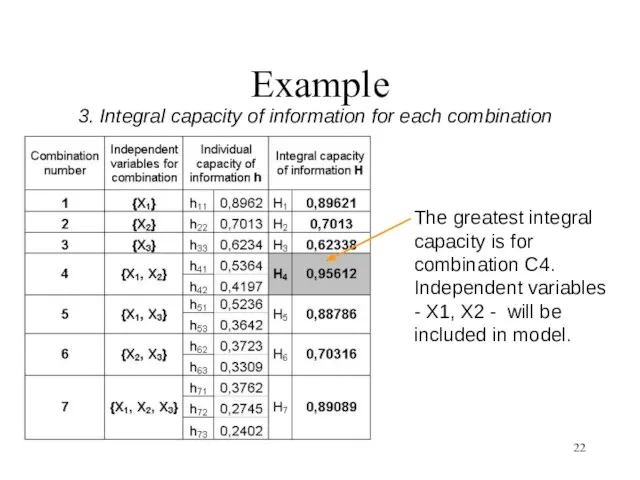
- 22. Example 3. Integral capacity of information for each combination The greatest integral capacity is for combination
- 23. Graph analysis method Three steps Calculating r* Modification of correlation matrix Drawing the graph
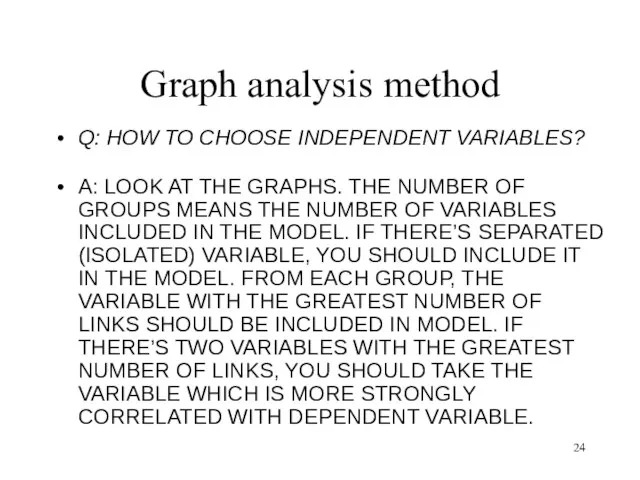
- 24. Graph analysis method Q: HOW TO CHOOSE INDEPENDENT VARIABLES? A: LOOK AT THE GRAPHS. THE NUMBER
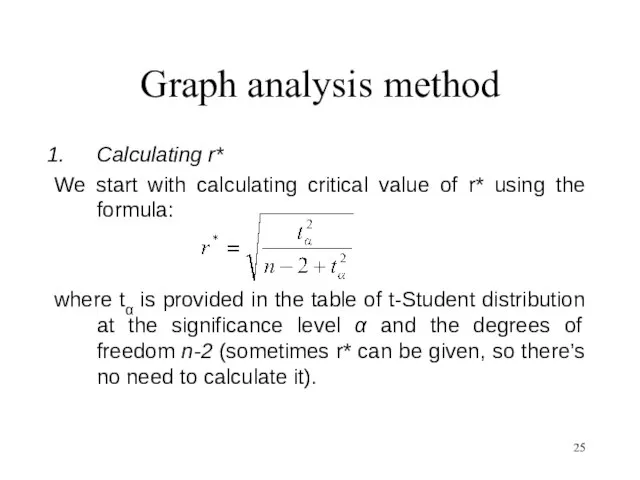
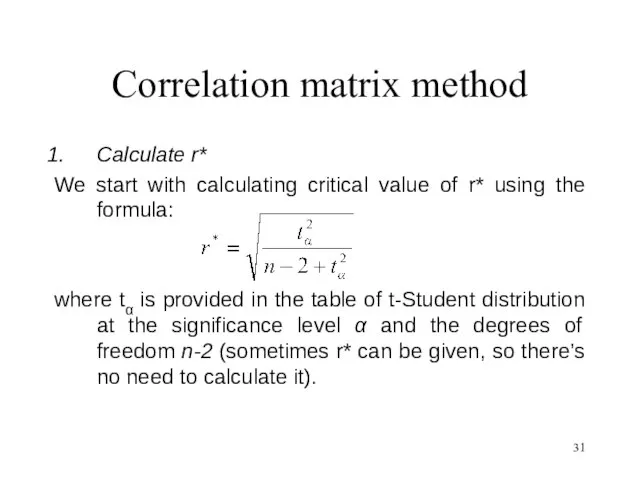
- 25. Graph analysis method Calculating r* We start with calculating critical value of r* using the formula:
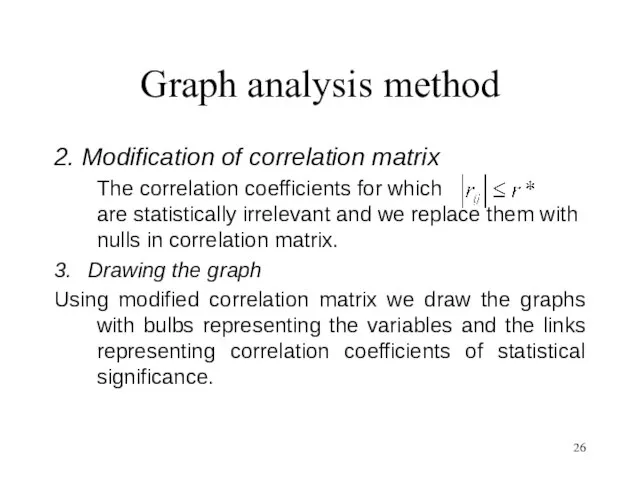
- 26. Graph analysis method 2. Modification of correlation matrix The correlation coefficients for which are statistically irrelevant
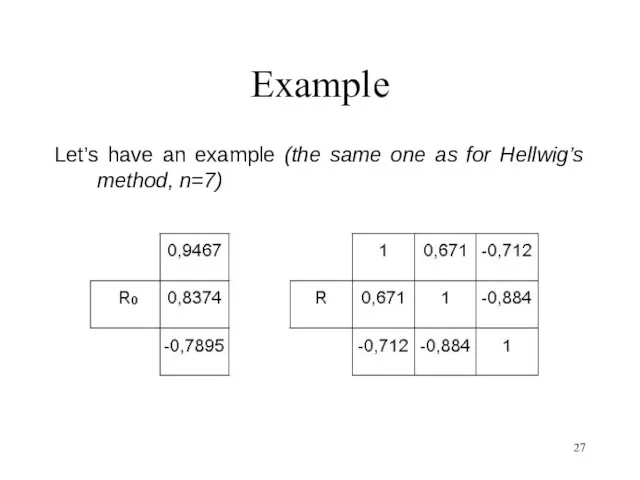
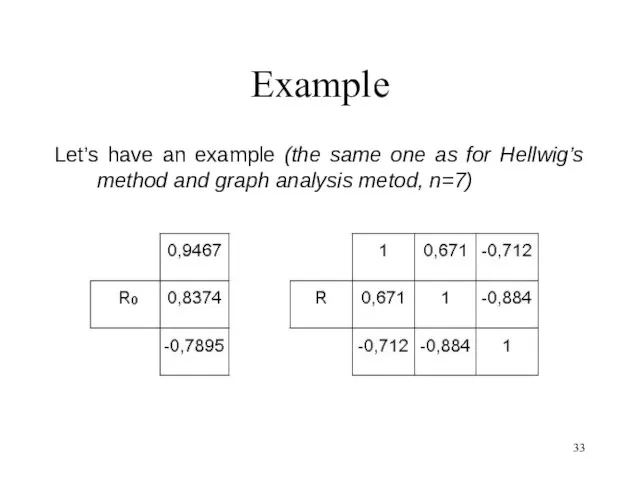
- 27. Example Let’s have an example (the same one as for Hellwig’s method, n=7)
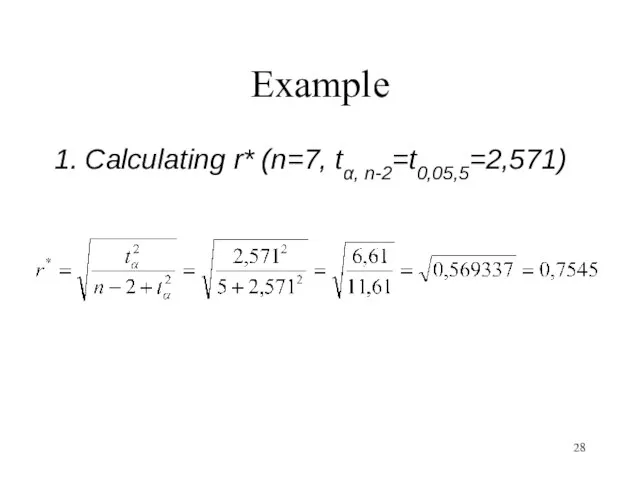
- 28. Example 1. Calculating r* (n=7, tα, n-2=t0,05,5=2,571)
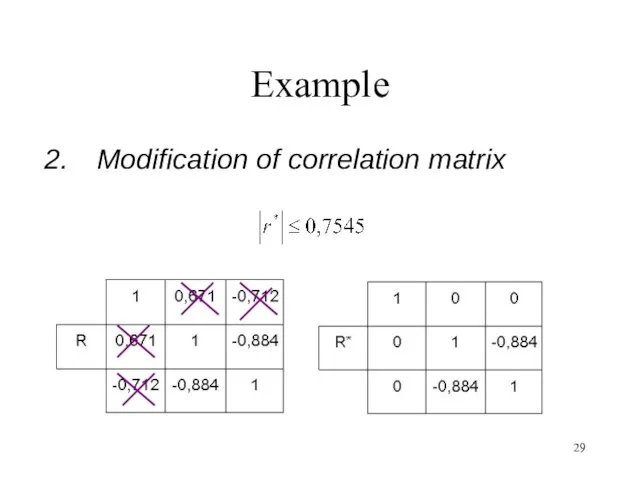
- 29. Example Modification of correlation matrix
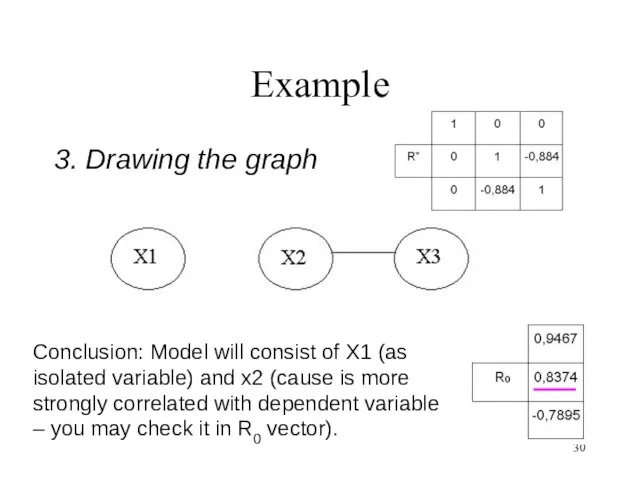
- 30. Example 3. Drawing the graph Conclusion: Model will consist of X1 (as isolated variable) and x2
- 31. Correlation matrix method Calculate r* We start with calculating critical value of r* using the formula:
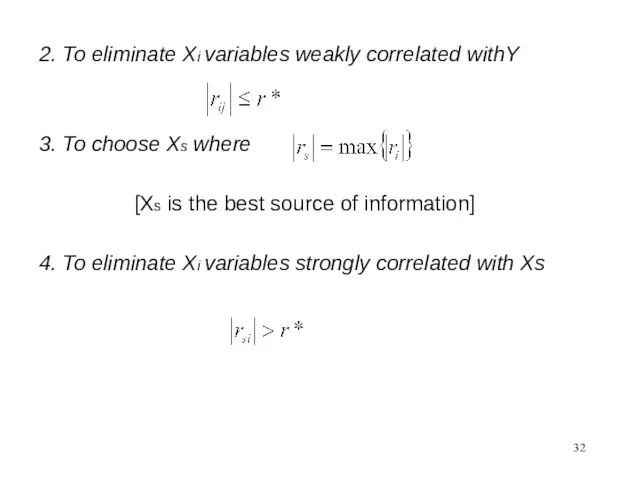
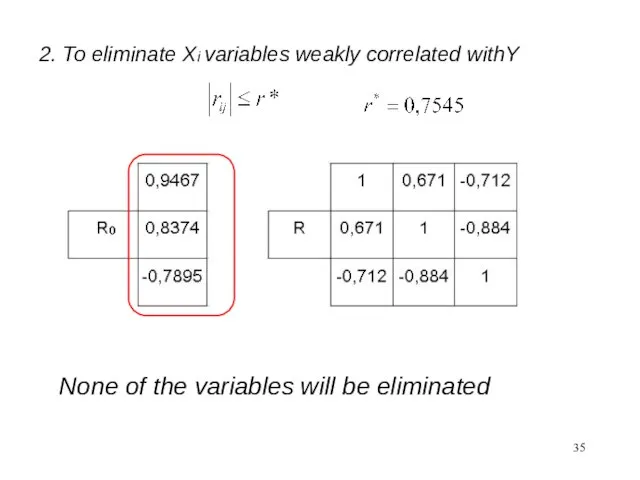
- 32. 2. To eliminate Xi variables weakly correlated withY 3. To choose Xs where [Xs is the
- 33. Example Let’s have an example (the same one as for Hellwig’s method and graph analysis metod,
- 34. Example 1. Calculating r* (n=7, tα, n-2=t0,05,5=2,571)
- 35. 2. To eliminate Xi variables weakly correlated withY None of the variables will be eliminated
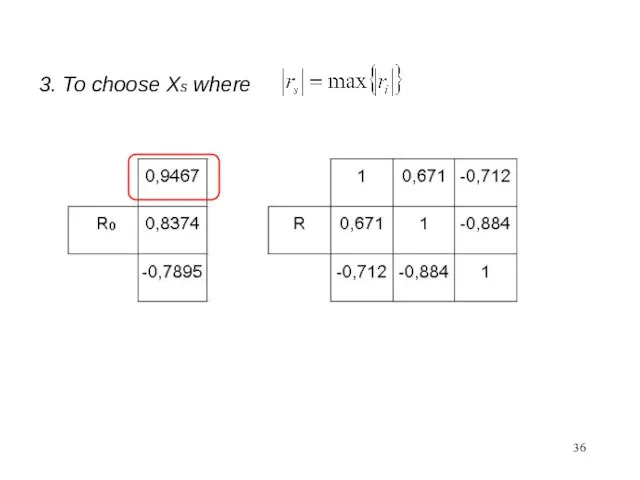
- 36. 3. To choose Xs where
- 37. 4. To eliminate Xi variables strongly correlated with Xs None of the variables will be eliminated.
- 39. Скачать презентацию
Слайд 2Choosing independent variables
Three popular methods of choosing independent variables are:
Hellwig's method
Graphs
Choosing independent variables
Three popular methods of choosing independent variables are:
Hellwig's method
Graphs
Слайд 3Hellwig’s method
Three steps:
Number of combinations: 2m-1
Individual capacity of every independent variable in
Hellwig’s method
Three steps:
Number of combinations: 2m-1
Individual capacity of every independent variable in
Слайд 4Hellwig’s method
1. Number of combinations
In Hellwig’s method the number of combinations is
Hellwig’s method
1. Number of combinations
In Hellwig’s method the number of combinations is
Слайд 5Hellwig’s method
2. Individual capacity of each independent variable in the combination is
Hellwig’s method
2. Individual capacity of each independent variable in the combination is
Слайд 6Hellwig’s method
2. Individual capacity of each independent variable in the combination is
Hellwig’s method
2. Individual capacity of each independent variable in the combination is
Слайд 7Hellwig’s method
2. Individual capacity of each independent variable in the combination is
Hellwig’s method
2. Individual capacity of each independent variable in the combination is
Слайд 8Hellwig’s method
2. Individual capacity of each independent variable in the combination is
Hellwig’s method
2. Individual capacity of each independent variable in the combination is
Слайд 9Hellwig’s method
3. Integral capacity of information for every combination
The next step
Hellwig’s method
3. Integral capacity of information for every combination
The next step
Слайд 10Hellwig’s method
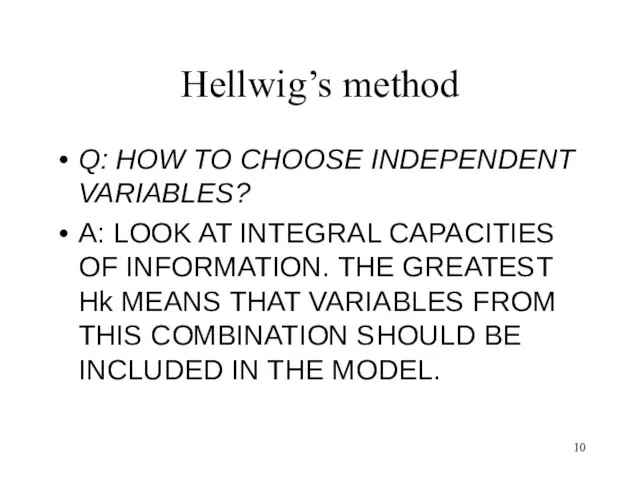
Q: HOW TO CHOOSE INDEPENDENT VARIABLES?
A: LOOK AT INTEGRAL CAPACITIES
Hellwig’s method
Q: HOW TO CHOOSE INDEPENDENT VARIABLES?
A: LOOK AT INTEGRAL CAPACITIES
Слайд 11Example
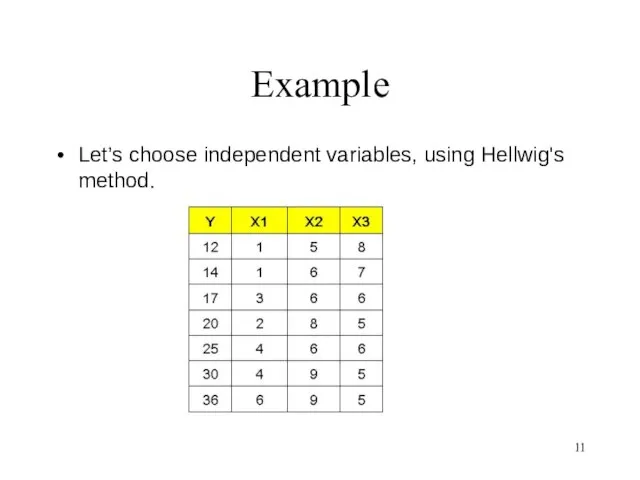
Let’s choose independent variables, using Hellwig's method.
Example
Let’s choose independent variables, using Hellwig's method.
Слайд 12Example
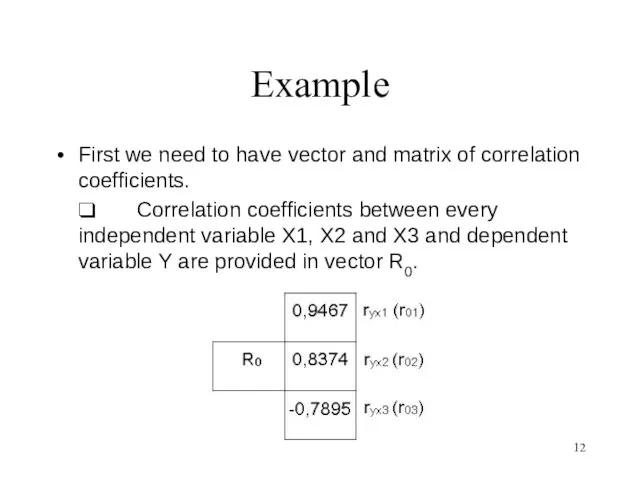
First we need to have vector and matrix of correlation coefficients.
Example
First we need to have vector and matrix of correlation coefficients.
Слайд 13Example
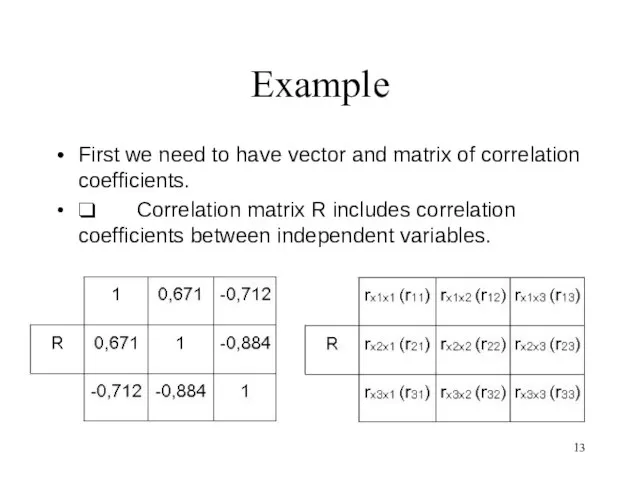
First we need to have vector and matrix of correlation coefficients.
Example
First we need to have vector and matrix of correlation coefficients.
Слайд 14Example
1. Number of combinations
We have 3 independent variables X1, X2 and
Example
1. Number of combinations
We have 3 independent variables X1, X2 and
Слайд 15Example
2. Individual capacity of independent variable in the combination 1
Example
2. Individual capacity of independent variable in the combination 1
Слайд 16Example
2. Individual capacity of independent variable in the combination 2
Example
2. Individual capacity of independent variable in the combination 2
Слайд 17Example
2. Individual capacity of independent variable in the combination 3
Example
2. Individual capacity of independent variable in the combination 3
Слайд 18Example
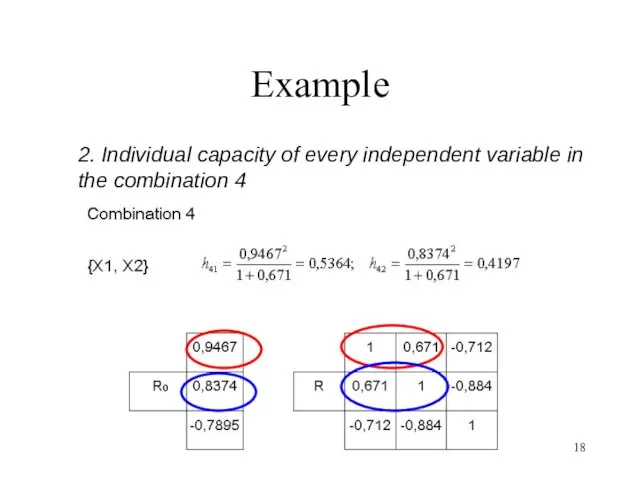
2. Individual capacity of every independent variable in the combination 4
Example
2. Individual capacity of every independent variable in the combination 4
Слайд 19Example
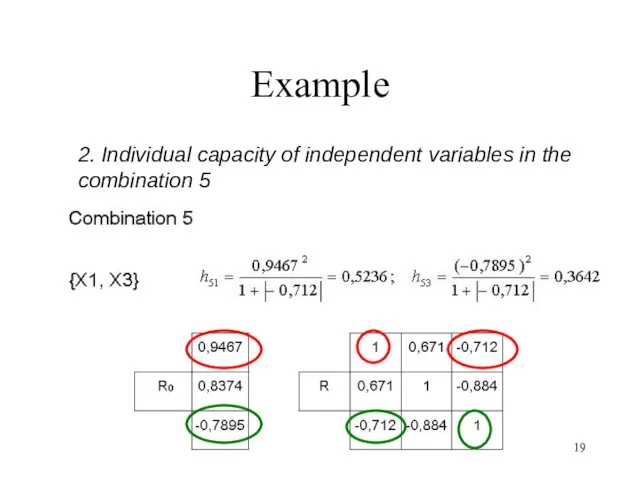
2. Individual capacity of independent variables in the combination 5
Example
2. Individual capacity of independent variables in the combination 5
Слайд 20Example
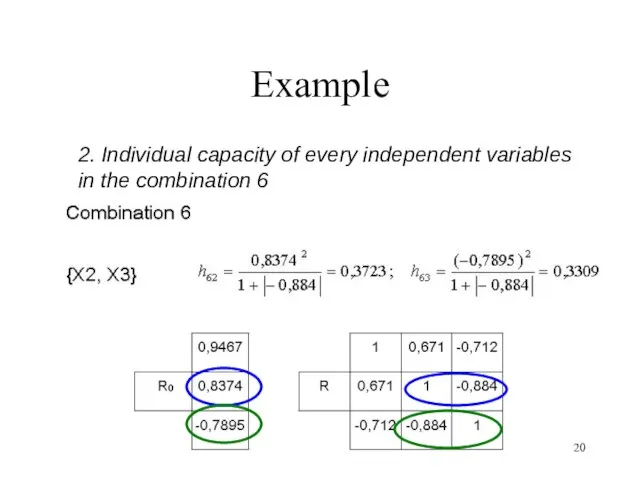
2. Individual capacity of every independent variables in the combination 6
Example
2. Individual capacity of every independent variables in the combination 6
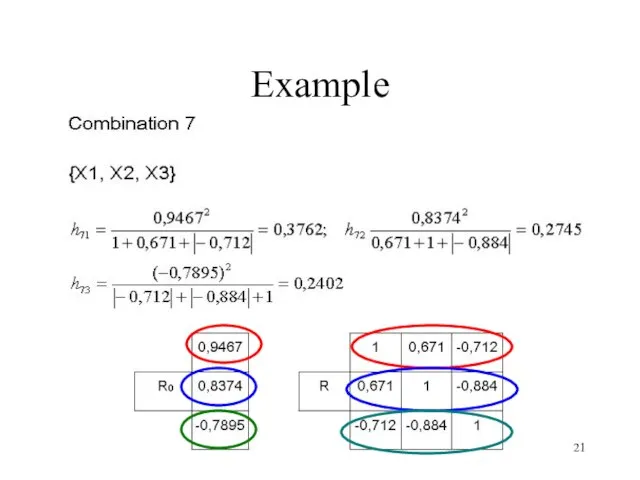
Слайд 21Example
Example
Слайд 22Example
3. Integral capacity of information for each combination
The greatest integral
Example
3. Integral capacity of information for each combination
The greatest integral
Слайд 23Graph analysis method
Three steps
Calculating r*
Modification of correlation matrix
Drawing the graph
Graph analysis method
Three steps
Calculating r*
Modification of correlation matrix
Drawing the graph
Слайд 24Graph analysis method
Q: HOW TO CHOOSE INDEPENDENT VARIABLES?
A: LOOK AT THE GRAPHS.
Graph analysis method
Q: HOW TO CHOOSE INDEPENDENT VARIABLES?
A: LOOK AT THE GRAPHS.
Слайд 25Graph analysis method
Calculating r*
We start with calculating critical value of r*
Graph analysis method
Calculating r*
We start with calculating critical value of r*
Слайд 26Graph analysis method
2. Modification of correlation matrix
The correlation coefficients for which
Graph analysis method
2. Modification of correlation matrix
The correlation coefficients for which
Слайд 27Example
Let’s have an example (the same one as for Hellwig’s method,
Example
Let’s have an example (the same one as for Hellwig’s method,
Слайд 28Example
1. Calculating r* (n=7, tα, n-2=t0,05,5=2,571)
Example
1. Calculating r* (n=7, tα, n-2=t0,05,5=2,571)
Слайд 29Example
Modification of correlation matrix
Example
Modification of correlation matrix
Слайд 30Example
3. Drawing the graph
Conclusion: Model will consist of X1 (as
Example
3. Drawing the graph
Conclusion: Model will consist of X1 (as
Слайд 31Correlation matrix method
Calculate r*
We start with calculating critical value of r*
Correlation matrix method
Calculate r*
We start with calculating critical value of r*
Слайд 322. To eliminate Xi variables weakly correlated withY
3. To choose Xs where
2. To eliminate Xi variables weakly correlated withY
3. To choose Xs where
Слайд 33Example
Let’s have an example (the same one as for Hellwig’s method
Example
Let’s have an example (the same one as for Hellwig’s method
Слайд 34Example
1. Calculating r* (n=7, tα, n-2=t0,05,5=2,571)
Example
1. Calculating r* (n=7, tα, n-2=t0,05,5=2,571)

Слайд 352. To eliminate Xi variables weakly correlated withY
None of the variables will
2. To eliminate Xi variables weakly correlated withY
None of the variables will
Слайд 363. To choose Xs where
Слайд 374. To eliminate Xi variables strongly correlated with Xs
None of the variables
None of the variables

 Понятие трудового договора, его стороны и значение. Содержание трудового договора, порядок заключения и расторжения
 Автоматизация р
 All kinds of animals
 Экономика государства
 Компьютерные презентации
 Селекция2
 Презентация на тему Письменные буквы русского алфавита
  Суриков Сергей Григорьевич Ученик 9 б класса МБОУ СОШ № 9
  Художественное ремесло
 АСГОР «РГК»
 Знакомство с Богом
 Четыре живописца
 Терроризм как опаснейшее социально-политическое явление сегодняшнего мира
 Филиппины
  Программа поддержки многодетных семей в РФ
 Группа развития
 Презентация на тему Природные зоны Африки
  Тема доклада: «Обязательные виды страхования - драйвер роста или тупиковый путь развития?»
 Профориентационная работа в условиях школы-интерната
 Подводная угадайка
 Hafta 3-2Menderes Dönemi
 Эксклюзив
 ВРЕМЕНА ГОДА SEASONS
  Состав рабочих групп проектов окружного методического совета
 Презентация на тему Семейство Губоцветные
  Межрегиональный конкурс по проектной робототехнике РобоТех (Ярославль)
 О результатах государственной (итоговой) аттестации выпускников IX классов общеобразовательных учреждений, организуемой региона
 презентация